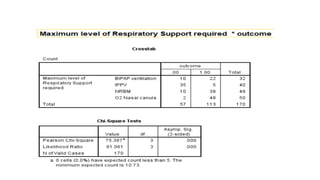
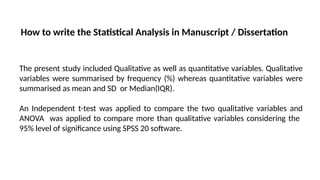
Basic Statistical Analysis for
Bio Medical Research
Dr. Swati Patel
Data Collection
Explaratory Data Analysis
Data Organization
(Master chart preparation)
Data Cleaning
Hypothesis testing
Inferential Statistics
Conclusion & Interpretation
Descriptive Statistic
Types of Medical Data
• Qualitative Data: Qualitative data helps in categorizing and understanding
the demographic and social characteristics of patients.
• Qualitative data are descriptive and non-numeric, such as patient gender,
ethnicity, or medical history.
• Quantitative Data: Quantitative data provides precise measurements and
allows for statistical analysis to assess trends, associations, and outcomes.
• Quantitative data are numerical and can be measured and analyzed
statistically. They include variables like blood pressure, cholesterol levels,
and patient age.
• Quantitative data can be further categorized into continuous data (e.g., blood
pressure, height) and discrete data (e.g., number of hospital visits, counts of
specific medical events).
• Continuous data can take any value within a certain range and can be
measured with great precision. Continuous data can theoretically have an
infinite number of values within a range, making them suitable for statistical
analysis using techniques like mean, standard deviation, and correlation.
• Discrete data are whole numbers or counts that cannot be subdivided into
smaller units.
Qualitative data:
• Categorical data: values belong to categories
Nominal data: there is no natural order to the categories
e.g. blood groups
Ordinal data: there is natural order e.g. Adverse Events
(Mild/Moderate/Severe/Life Threatening)
•Binary data: there are only two possible categories
e.g. alive/dead
The researcher calculates
summary statistics to describe the
characteristics of the data.
TThe researcher uses inferential
statistics to make predictions or draw
conclusions about a population
based on sample data
Basic steps to select the statistical test
Type of Variables
Qualitative Variable
(Binary/Categorical)
Quantitative Variable
(Numerical)
2 groups > 2 groups
Independent Dependent
Independent
t-test
Paired t-test
ANOVA Repeated measures of
ANOVA
Independent Dependent
2 binary/ordinal/
Nominal Variables
2 independent
population
proportion
Independent Dependent
Chi-Square test
Fisher Exact test
Mc Nemar test
Z-test of
Proportion
Data Analysis using SPSS
• Independent t-test
• Paired t-test
• ANOVA
• Chi-Square test
• Fisher Exact test
• Mc Nemar`s test
• Z- test of Proportion
95 % Confidence Interval
• A 95% confidence interval (CI) provides a range of values within
which we are 95% confident that the true population parameter
lies.
• This means that if we repeatedly sample from the population
and compute the estimation parameter that will be lies in
between the value of 95% Confidence interval only.
• Suppose we are estimating the average systolic blood pressure
in a population, and we compute a 95% confidence interval of
[120, 130] mmHg based on a sample of individuals.
• This means that we are 95% confident that the true average
systolic blood pressure in the population falls somewhere
P- Value
• The p-value, or probability value, is a measure used in
statistical hypothesis testing to determine the strength of
evidence against the null hypothesis.
• Suppose a researcher is conducting a study to determine if a new medication is effective in
reducing pain. They collect data from a sample of patients and perform a statistical test.
• The resulting p-value is 0.02.
Independent t-test out come table
Study Variables N Mean Std. Deviation P-Value
Haemoglobin Case 60 10.50 1.834
Control 30 13.68 1.234
ESR Case 60 42.32 19.008
Control 30 14.67 4.310
Calprotectin Case 60 818.02 345.755
Control 30 35.21 14.392
D.dimer Case 60 766.42 286.347
Control 30 185.54 98.582
Paired t test
Chi-Square test
How to write the Statistical Analysis in Manuscript / Dissertation
The present study included Qualitative as well as quantitative variables. Qualitative
variables were summarised by frequency (%) whereas quantitative variables were
summarised as mean and SD or Median(IQR).
An Independent t-test was applied to compare the two qualitative variables and
ANOVA was applied to compare more than qualitative variables considering the
95% level of significance using SPSS 20 software.
Thank you

Basic Statistical Analysis for Bio Medical Research.pptx

  • 1.
    Basic Statistical Analysisfor Bio Medical Research Dr. Swati Patel
  • 2.
    Data Collection Explaratory DataAnalysis Data Organization (Master chart preparation) Data Cleaning Hypothesis testing Inferential Statistics Conclusion & Interpretation Descriptive Statistic
  • 4.
  • 5.
    • Qualitative Data:Qualitative data helps in categorizing and understanding the demographic and social characteristics of patients. • Qualitative data are descriptive and non-numeric, such as patient gender, ethnicity, or medical history. • Quantitative Data: Quantitative data provides precise measurements and allows for statistical analysis to assess trends, associations, and outcomes. • Quantitative data are numerical and can be measured and analyzed statistically. They include variables like blood pressure, cholesterol levels, and patient age.
  • 6.
    • Quantitative datacan be further categorized into continuous data (e.g., blood pressure, height) and discrete data (e.g., number of hospital visits, counts of specific medical events). • Continuous data can take any value within a certain range and can be measured with great precision. Continuous data can theoretically have an infinite number of values within a range, making them suitable for statistical analysis using techniques like mean, standard deviation, and correlation. • Discrete data are whole numbers or counts that cannot be subdivided into smaller units.
  • 7.
    Qualitative data: • Categoricaldata: values belong to categories Nominal data: there is no natural order to the categories e.g. blood groups Ordinal data: there is natural order e.g. Adverse Events (Mild/Moderate/Severe/Life Threatening) •Binary data: there are only two possible categories e.g. alive/dead
  • 8.
    The researcher calculates summarystatistics to describe the characteristics of the data. TThe researcher uses inferential statistics to make predictions or draw conclusions about a population based on sample data
  • 9.
    Basic steps toselect the statistical test Type of Variables Qualitative Variable (Binary/Categorical) Quantitative Variable (Numerical) 2 groups > 2 groups Independent Dependent Independent t-test Paired t-test ANOVA Repeated measures of ANOVA Independent Dependent 2 binary/ordinal/ Nominal Variables 2 independent population proportion Independent Dependent Chi-Square test Fisher Exact test Mc Nemar test Z-test of Proportion
  • 10.
    Data Analysis usingSPSS • Independent t-test • Paired t-test • ANOVA • Chi-Square test • Fisher Exact test • Mc Nemar`s test • Z- test of Proportion
  • 11.
    95 % ConfidenceInterval • A 95% confidence interval (CI) provides a range of values within which we are 95% confident that the true population parameter lies. • This means that if we repeatedly sample from the population and compute the estimation parameter that will be lies in between the value of 95% Confidence interval only. • Suppose we are estimating the average systolic blood pressure in a population, and we compute a 95% confidence interval of [120, 130] mmHg based on a sample of individuals. • This means that we are 95% confident that the true average systolic blood pressure in the population falls somewhere
  • 12.
    P- Value • Thep-value, or probability value, is a measure used in statistical hypothesis testing to determine the strength of evidence against the null hypothesis. • Suppose a researcher is conducting a study to determine if a new medication is effective in reducing pain. They collect data from a sample of patients and perform a statistical test. • The resulting p-value is 0.02.
  • 13.
    Independent t-test outcome table Study Variables N Mean Std. Deviation P-Value Haemoglobin Case 60 10.50 1.834 Control 30 13.68 1.234 ESR Case 60 42.32 19.008 Control 30 14.67 4.310 Calprotectin Case 60 818.02 345.755 Control 30 35.21 14.392 D.dimer Case 60 766.42 286.347 Control 30 185.54 98.582
  • 15.
  • 16.
  • 21.
    How to writethe Statistical Analysis in Manuscript / Dissertation The present study included Qualitative as well as quantitative variables. Qualitative variables were summarised by frequency (%) whereas quantitative variables were summarised as mean and SD or Median(IQR). An Independent t-test was applied to compare the two qualitative variables and ANOVA was applied to compare more than qualitative variables considering the 95% level of significance using SPSS 20 software.
  • 22.