Downloaded 283 times


![
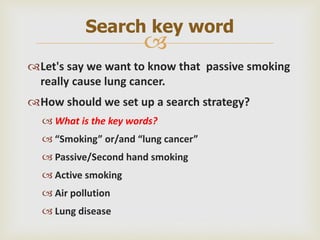
“passive smoking” OR “second hand
smoking”[text word] OR lung cancer
produces ALL articles that contain EITHER
smoking OR lung cancer to get a lot of
articles.
“Passive smoking” AND “lung cancer” will
capture only those subsets that have
BOTH smoking AND lung cancer reduce
the articles.
The Search](https://image.slidesharecdn.com/metaanalysisinmedicalresearch-speech-151225015103/85/Meta-analysis-in-medical-research-19-320.jpg)
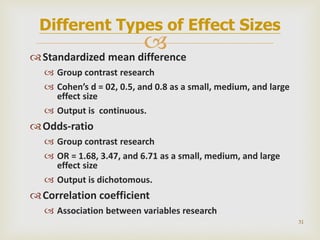
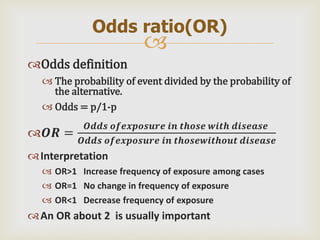
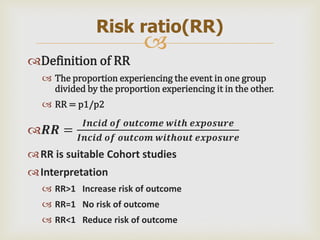
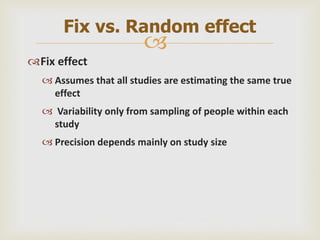

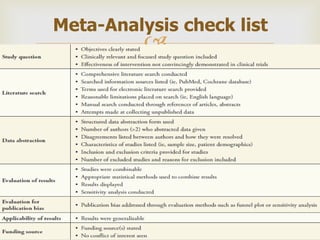


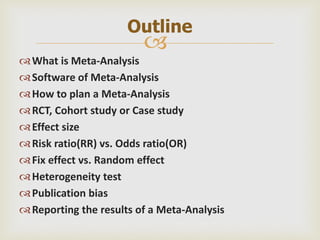
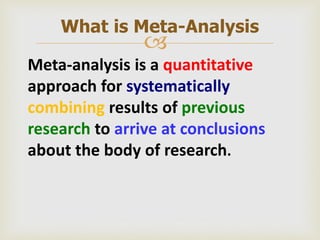
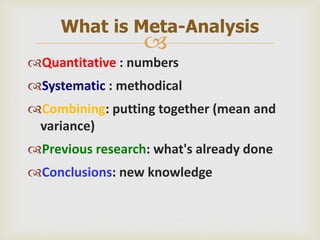
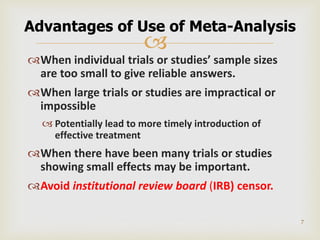
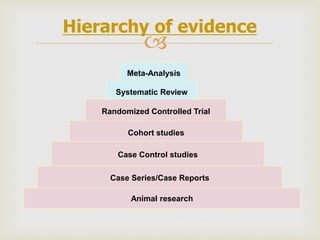
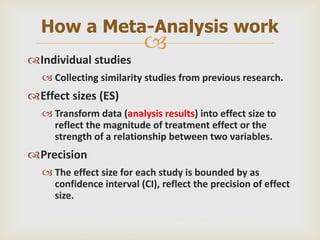
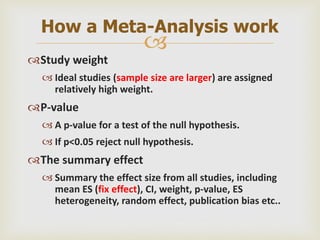
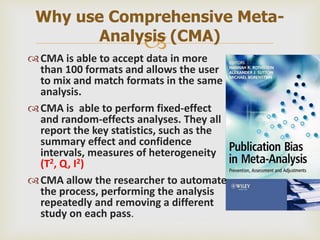
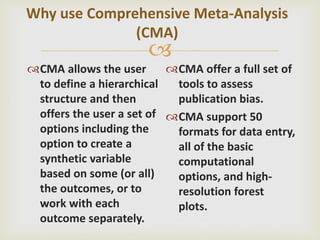
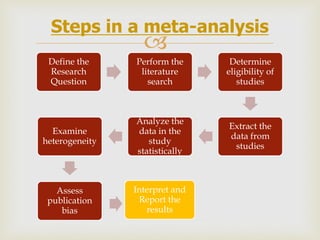
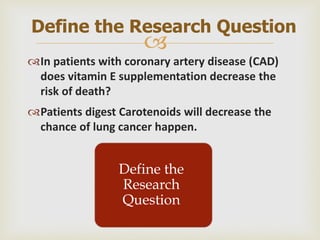
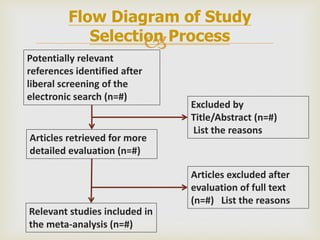
This document provides an overview of meta-analysis. It defines meta-analysis as a quantitative approach to systematically combining results from previous studies to arrive at conclusions about the body of research. It discusses key aspects of planning and conducting a meta-analysis such as defining the research question, searching for relevant literature, determining study eligibility, extracting data, analyzing effect sizes, assessing heterogeneity, and addressing publication bias. Software for performing meta-analyses and specific effect sizes like risk ratio and odds ratio are also mentioned.