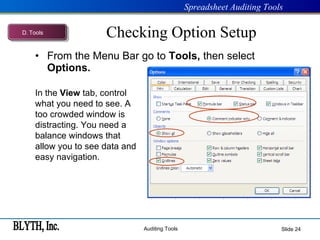
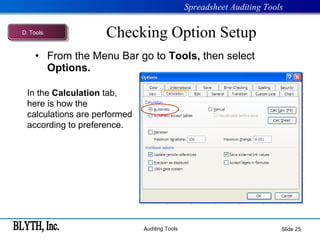
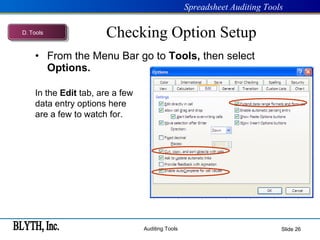
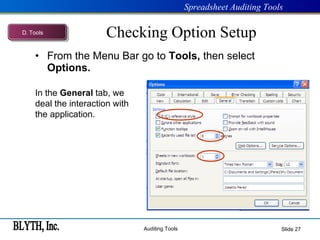
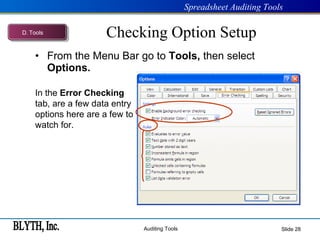
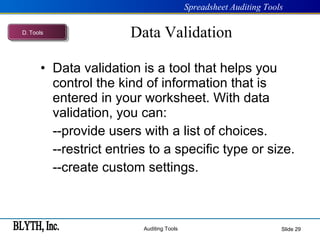
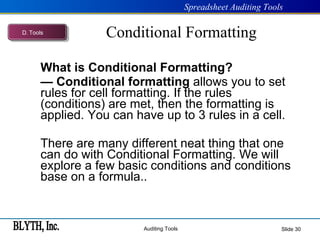
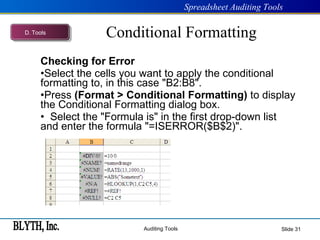
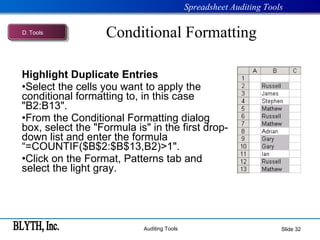
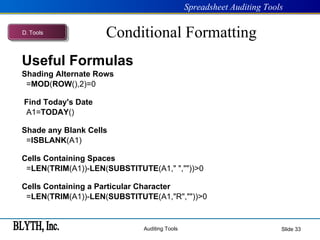
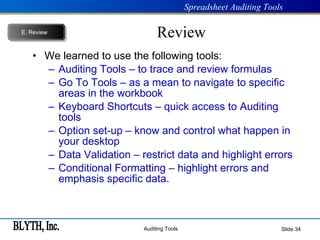
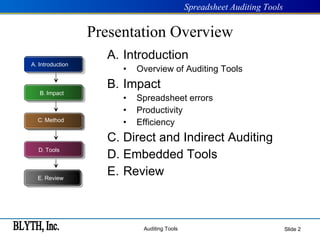
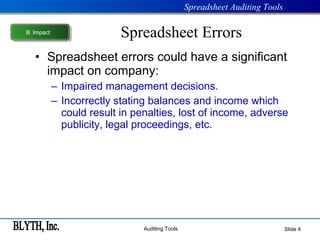
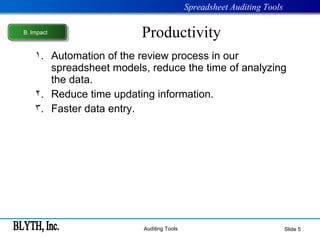
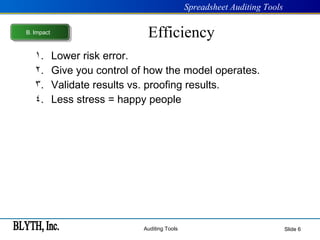
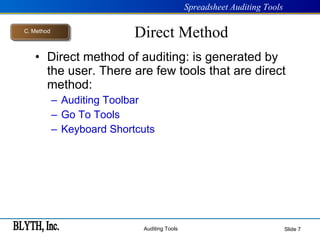
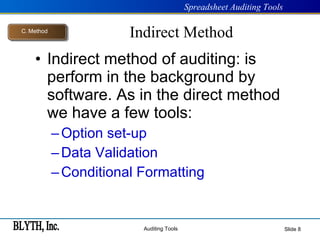
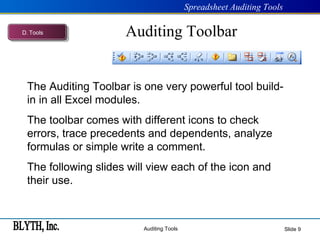
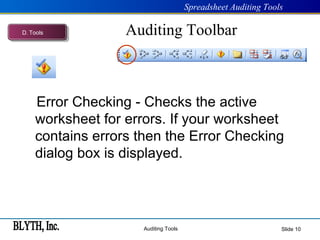
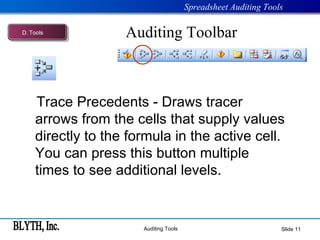
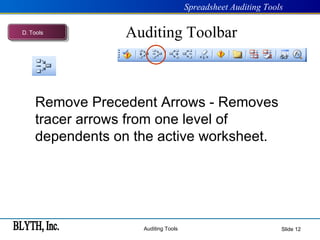
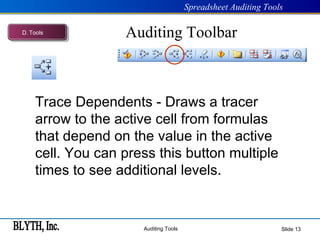
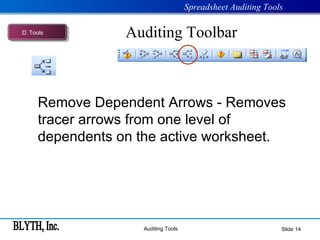
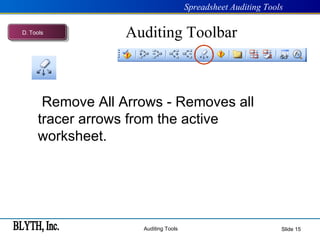
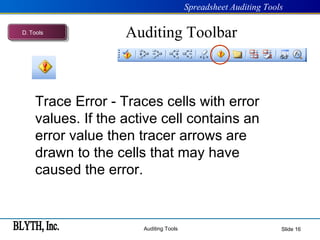
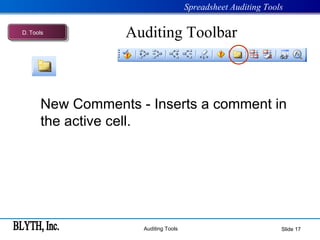
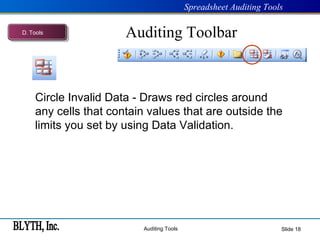
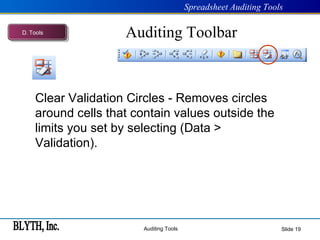
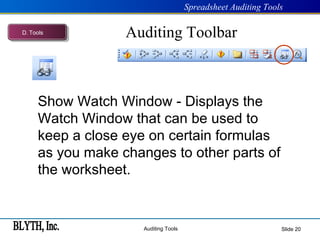
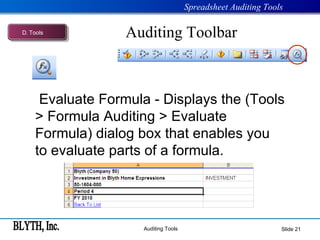
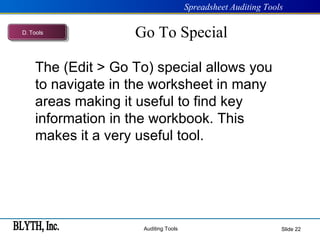
The document discusses various tools in Excel for auditing and reviewing spreadsheets. It describes direct auditing tools like the Auditing Toolbar, Go To Tools, and keyboard shortcuts that allow tracing formulas and errors. Indirect methods include data validation, conditional formatting, and setting calculation and view options. Examples are provided for using the Auditing Toolbar icons, Go To Special, conditional formatting formulas, and setting calculation and view options to improve spreadsheet accuracy and productivity.
We use reports in our daily life. Now a days, computer is basic need of every place. MS ACCESS is used to present & analyse the data. Reports provide the most flexible way of viewing and printing summarized information. I hope this presentation will help you to prepare a report in MS Access.
Just some excel courses. Have fun and learn from basic to advance, to develope strong skills in operating Excel.
Microsoft Office Excel was never so easy to understand like now!
Microsoft Access is a database management system from Microsoft that combines the relational Access Database Engine with a graphical user interface and software-development tools. It is a member of the Microsoft 365 suite of applications, included in the Professional and higher editions or sold separately.
In ArcGIS, a data model describes the thematic layers used in the applications (for example, hamburger stands, roads, and counties); their spatial representation (for example, point, line, or polygon); their attributes; their integrity rules and relationships (for example, counties must nest within states).
Lab view pdf of front panel gives information about how to design design the front panel. its completely designed by National instruments and good for beginners.
From this power point you can get the details about Advanced Filter, Use of Macros with Advanced Filter, Data Validation, Creation of data validation Drop-Down List, Handling of External Data, Goal Seek, What-if analysis,
Creating accessible modals and autocompletesRuss Weakley
In this two-part presentation, Russ will guide us on a deep dive into how to create accessible modals and accessible autocomplete search functions. Along the way, we will look at the problem for different types of users as well as explore how ARIA can be used to improve these experiences. There will be blood, sweat and tears (Russ' words!) but hopefully a happy outcome for all.
Presentation for the Sydney Web Accessibility & Inclusive Design - 30 August 2019
1. (TCO 1) Which of the following sets of SQL clauses represent the minimum combination of clauses to make a working SQL statement? (Points : 5)
SELECT, WHERE
FROM, WHERE
SELECT, FROM
FROM, ORDER BY
WinEst As 1. Es2. Tassignment stInfo (Esti.docxalanfhall8953
WinEst As
1. Es
2. Ta
ssignment
stInfo (Estim
a. Name
b. Due:
c. Estima
d. Start
e. Estima
f. Rate
i.
ii.
ake Off (Ite
mate Inform
e: Driveway
1 month fro
ate Type: B
Date: Toda
ate Status:
Tables:
Sample L
Sample E
ems)
P
C
mation)
y Proposal
om today
udgetary
ay
Submitted
abor Rates
quipment R
Page 1 of 2
COMPU
Rates
TERS FO
Engi
OR CONS
TEC
neering Tec
Un
Colleg
STRUCTI
CHNOLO
hnology Pro
niversity of To
ge of Engine
ON
OGY
gram
oledo
eering
Page 2 of 2
3. Adding Markups
a. Add Net Markup
i. Name: Overhead and Profit
ii. Type: 15%
b. Add Sales Tax
i. Name: Sales Tax
ii. Type: 6.5%
iii. Restrict this Tax Markup to: Material
4. Print Report
a. Report 1:
i. Sheet View, set Filter to “’95 Div Details”
ii. File -> Print Preview -> Style
1. Layout: Landscape
2. Header/Footer -> Custom Header
a. Left Text (Use Field Tags…)
i. Est Info – Project Name
ii. Est Info – Start Date
iii. Est Info – Due Date
b. Center Text (Use Field Tags…)
i. Est Info – Type
ii. Est Info – Status
c. Right Text
i. Name
ii. Professor Name
iii. Class
iv. Date
b. Report 2:
i. Totals View
ii. File -> Print Preview
1. Ensure the Layout and Headers match Report 1
5. DUE: Monday, April 7, 2014 by 5:00 pm
1
Getting Started with WinEst
Sample Exercise v10.1
Professional Cost Estimating and Budgeting
Things you need to know about WinEst
Pull Down Menus & Tool Bars
There are different ways to view your toolbar in WinEst. Here are 2 examples. If you prefer large toolbar buttons,
select ‘Preferences’ from the ‘Tools’ menu option. Now select the Toolbars option from the displayed list of
preferences. To the right, under ‘Style’, change the Images to ‘Large’. Click OK.
Toolbar - Small Images with Short Text
Toolbar - Large Images with Text
WinEst has pull down menus for each of the following - File, Edit, View, Filters, Tables, Tools, Database, Reports,
Custom, Window and Help. When the mouse is clicked on one of these menu items, a list drops down and the
available commands display for that menu. Scan the menus to see the features available in the WinEst program.
Help
Help is always available. You can select the Contents command on the Help menu or press the F1 key to view
help.
2
Navigating in WinEst
WinEst has three main views. These enable you to follow a structured method for building and reviewing your
estimates. You can move from view to view at any time by clicking one of the corresponding toolbar buttons
(‘Takeoff’, ‘Sheet’ and ‘Totals’) or by making selections from the ‘View’ Menu.
Takeoff View
This view is for adding items to your estimate from the price book Database. From here you can:
• Lookup items in the database
• Perform takeoff calculations
• Assign Work Breakdown Structures (WBS) to items
• Analyze the Item takeoff audit trail
• Enter unique, “one time” items
• Add notes to it.
Dynamics CRM 2013: Create or customize dashboardsVinh Nguyen
Dynamics CRM 2013: Create or customize dashboards
If you need to find a perfect solution for your business or should you have any questions please do not hesitate to contact Think Next
Website: http://www.thinknext.vn
Forum: http://www.thinknext.vn/diendan/index.php?threads/dynamics-crm-create-or-customize-dashboards.464/
Observability Concepts EVERY Developer Should Know -- DeveloperWeek Europe.pdfPaige Cruz
Monitoring and observability aren’t traditionally found in software curriculums and many of us cobble this knowledge together from whatever vendor or ecosystem we were first introduced to and whatever is a part of your current company’s observability stack.
While the dev and ops silo continues to crumble….many organizations still relegate monitoring & observability as the purview of ops, infra and SRE teams. This is a mistake - achieving a highly observable system requires collaboration up and down the stack.
I, a former op, would like to extend an invitation to all application developers to join the observability party will share these foundational concepts to build on:
GraphSummit Singapore | The Art of the Possible with Graph - Q2 2024Neo4j
Neha Bajwa, Vice President of Product Marketing, Neo4j
Join us as we explore breakthrough innovations enabled by interconnected data and AI. Discover firsthand how organizations use relationships in data to uncover contextual insights and solve our most pressing challenges – from optimizing supply chains, detecting fraud, and improving customer experiences to accelerating drug discoveries.
Unlocking Productivity: Leveraging the Potential of Copilot in Microsoft 365, a presentation by Christoforos Vlachos, Senior Solutions Manager – Modern Workplace, Uni Systems
Communications Mining Series - Zero to Hero - Session 1DianaGray10
This session provides introduction to UiPath Communication Mining, importance and platform overview. You will acquire a good understand of the phases in Communication Mining as we go over the platform with you. Topics covered:
• Communication Mining Overview
• Why is it important?
• How can it help today’s business and the benefits
• Phases in Communication Mining
• Demo on Platform overview
• Q/A
UiPath Test Automation using UiPath Test Suite series, part 5DianaGray10
Welcome to UiPath Test Automation using UiPath Test Suite series part 5. In this session, we will cover CI/CD with devops.
Topics covered:
CI/CD with in UiPath
End-to-end overview of CI/CD pipeline with Azure devops
Speaker:
Lyndsey Byblow, Test Suite Sales Engineer @ UiPath, Inc.
GridMate - End to end testing is a critical piece to ensure quality and avoid...ThomasParaiso2
End to end testing is a critical piece to ensure quality and avoid regressions. In this session, we share our journey building an E2E testing pipeline for GridMate components (LWC and Aura) using Cypress, JSForce, FakerJS…
GraphSummit Singapore | The Future of Agility: Supercharging Digital Transfor...Neo4j
Leonard Jayamohan, Partner & Generative AI Lead, Deloitte
This keynote will reveal how Deloitte leverages Neo4j’s graph power for groundbreaking digital twin solutions, achieving a staggering 100x performance boost. Discover the essential role knowledge graphs play in successful generative AI implementations. Plus, get an exclusive look at an innovative Neo4j + Generative AI solution Deloitte is developing in-house.
UiPath Test Automation using UiPath Test Suite series, part 6DianaGray10
Welcome to UiPath Test Automation using UiPath Test Suite series part 6. In this session, we will cover Test Automation with generative AI and Open AI.
UiPath Test Automation with generative AI and Open AI webinar offers an in-depth exploration of leveraging cutting-edge technologies for test automation within the UiPath platform. Attendees will delve into the integration of generative AI, a test automation solution, with Open AI advanced natural language processing capabilities.
Throughout the session, participants will discover how this synergy empowers testers to automate repetitive tasks, enhance testing accuracy, and expedite the software testing life cycle. Topics covered include the seamless integration process, practical use cases, and the benefits of harnessing AI-driven automation for UiPath testing initiatives. By attending this webinar, testers, and automation professionals can gain valuable insights into harnessing the power of AI to optimize their test automation workflows within the UiPath ecosystem, ultimately driving efficiency and quality in software development processes.
What will you get from this session?
1. Insights into integrating generative AI.
2. Understanding how this integration enhances test automation within the UiPath platform
3. Practical demonstrations
4. Exploration of real-world use cases illustrating the benefits of AI-driven test automation for UiPath
Topics covered:
What is generative AI
Test Automation with generative AI and Open AI.
UiPath integration with generative AI
Speaker:
Deepak Rai, Automation Practice Lead, Boundaryless Group and UiPath MVP
Removing Uninteresting Bytes in Software FuzzingAftab Hussain
Imagine a world where software fuzzing, the process of mutating bytes in test seeds to uncover hidden and erroneous program behaviors, becomes faster and more effective. A lot depends on the initial seeds, which can significantly dictate the trajectory of a fuzzing campaign, particularly in terms of how long it takes to uncover interesting behaviour in your code. We introduce DIAR, a technique designed to speedup fuzzing campaigns by pinpointing and eliminating those uninteresting bytes in the seeds. Picture this: instead of wasting valuable resources on meaningless mutations in large, bloated seeds, DIAR removes the unnecessary bytes, streamlining the entire process.
In this work, we equipped AFL, a popular fuzzer, with DIAR and examined two critical Linux libraries -- Libxml's xmllint, a tool for parsing xml documents, and Binutil's readelf, an essential debugging and security analysis command-line tool used to display detailed information about ELF (Executable and Linkable Format). Our preliminary results show that AFL+DIAR does not only discover new paths more quickly but also achieves higher coverage overall. This work thus showcases how starting with lean and optimized seeds can lead to faster, more comprehensive fuzzing campaigns -- and DIAR helps you find such seeds.
- These are slides of the talk given at IEEE International Conference on Software Testing Verification and Validation Workshop, ICSTW 2022.
Enchancing adoption of Open Source Libraries. A case study on Albumentations.AIVladimir Iglovikov, Ph.D.
Presented by Vladimir Iglovikov:
- https://www.linkedin.com/in/iglovikov/
- https://x.com/viglovikov
- https://www.instagram.com/ternaus/
This presentation delves into the journey of Albumentations.ai, a highly successful open-source library for data augmentation.
Created out of a necessity for superior performance in Kaggle competitions, Albumentations has grown to become a widely used tool among data scientists and machine learning practitioners.
This case study covers various aspects, including:
People: The contributors and community that have supported Albumentations.
Metrics: The success indicators such as downloads, daily active users, GitHub stars, and financial contributions.
Challenges: The hurdles in monetizing open-source projects and measuring user engagement.
Development Practices: Best practices for creating, maintaining, and scaling open-source libraries, including code hygiene, CI/CD, and fast iteration.
Community Building: Strategies for making adoption easy, iterating quickly, and fostering a vibrant, engaged community.
Marketing: Both online and offline marketing tactics, focusing on real, impactful interactions and collaborations.
Mental Health: Maintaining balance and not feeling pressured by user demands.
Key insights include the importance of automation, making the adoption process seamless, and leveraging offline interactions for marketing. The presentation also emphasizes the need for continuous small improvements and building a friendly, inclusive community that contributes to the project's growth.
Vladimir Iglovikov brings his extensive experience as a Kaggle Grandmaster, ex-Staff ML Engineer at Lyft, sharing valuable lessons and practical advice for anyone looking to enhance the adoption of their open-source projects.
Explore more about Albumentations and join the community at:
GitHub: https://github.com/albumentations-team/albumentations
Website: https://albumentations.ai/
LinkedIn: https://www.linkedin.com/company/100504475
Twitter: https://x.com/albumentations
Sudheer Mechineni, Head of Application Frameworks, Standard Chartered Bank
Discover how Standard Chartered Bank harnessed the power of Neo4j to transform complex data access challenges into a dynamic, scalable graph database solution. This keynote will cover their journey from initial adoption to deploying a fully automated, enterprise-grade causal cluster, highlighting key strategies for modelling organisational changes and ensuring robust disaster recovery. Learn how these innovations have not only enhanced Standard Chartered Bank’s data infrastructure but also positioned them as pioneers in the banking sector’s adoption of graph technology.
Encryption in Microsoft 365 - ExpertsLive Netherlands 2024Albert Hoitingh
In this session I delve into the encryption technology used in Microsoft 365 and Microsoft Purview. Including the concepts of Customer Key and Double Key Encryption.
Generative AI Deep Dive: Advancing from Proof of Concept to ProductionAggregage
Join Maher Hanafi, VP of Engineering at Betterworks, in this new session where he'll share a practical framework to transform Gen AI prototypes into impactful products! He'll delve into the complexities of data collection and management, model selection and optimization, and ensuring security, scalability, and responsible use.
Epistemic Interaction - tuning interfaces to provide information for AI supportAlan Dix
Paper presented at SYNERGY workshop at AVI 2024, Genoa, Italy. 3rd June 2024
https://alandix.com/academic/papers/synergy2024-epistemic/
As machine learning integrates deeper into human-computer interactions, the concept of epistemic interaction emerges, aiming to refine these interactions to enhance system adaptability. This approach encourages minor, intentional adjustments in user behaviour to enrich the data available for system learning. This paper introduces epistemic interaction within the context of human-system communication, illustrating how deliberate interaction design can improve system understanding and adaptation. Through concrete examples, we demonstrate the potential of epistemic interaction to significantly advance human-computer interaction by leveraging intuitive human communication strategies to inform system design and functionality, offering a novel pathway for enriching user-system engagements.
In his public lecture, Christian Timmerer provides insights into the fascinating history of video streaming, starting from its humble beginnings before YouTube to the groundbreaking technologies that now dominate platforms like Netflix and ORF ON. Timmerer also presents provocative contributions of his own that have significantly influenced the industry. He concludes by looking at future challenges and invites the audience to join in a discussion.
20240609 QFM020 Irresponsible AI Reading List May 2024
Spreadsheet Auditing
1. Spreadsheet Auditing Tools A Strategic Approach to Improve Spreadsheet Using Analysis Embedded Tools of Excel By Joselito Pérez
2.
3.
4.
5.
6.
7.
8.
9. Auditing Toolbar Slide The Auditing Toolbar is one very powerful tool build-in in all Excel modules. The toolbar comes with different icons to check errors, trace precedents and dependents, analyze formulas or simple write a comment. The following slides will view each of the icon and their use. D . Tools
10. Auditing Toolbar Slide Error Checking - Checks the active worksheet for errors. If your worksheet contains errors then the Error Checking dialog box is displayed. D . Tools
11. Auditing Toolbar Slide Trace Precedents - Draws tracer arrows from the cells that supply values directly to the formula in the active cell. You can press this button multiple times to see additional levels. D . Tools
12. Auditing Toolbar Slide Remove Precedent Arrows - Removes tracer arrows from one level of dependents on the active worksheet. D . Tools
13. Auditing Toolbar Slide Trace Dependents - Draws a tracer arrow to the active cell from formulas that depend on the value in the active cell. You can press this button multiple times to see additional levels. D . Tools
14. Auditing Toolbar Slide Remove Dependent Arrows - Removes tracer arrows from one level of dependents on the active worksheet. D . Tools
15. Auditing Toolbar Slide Remove All Arrows - Removes all tracer arrows from the active worksheet. D . Tools
16. Auditing Toolbar Slide Trace Error - Traces cells with error values. If the active cell contains an error value then tracer arrows are drawn to the cells that may have caused the error. D . Tools
18. Auditing Toolbar Slide Circle Invalid Data - Draws red circles around any cells that contain values that are outside the limits you set by using Data Validation. D . Tools
19. Auditing Toolbar Slide Clear Validation Circles - Removes circles around cells that contain values outside the limits you set by selecting (Data > Validation). D . Tools
20. Auditing Toolbar Slide Show Watch Window - Displays the Watch Window that can be used to keep a close eye on certain formulas as you make changes to other parts of the worksheet. D . Tools
21. Auditing Toolbar Slide Evaluate Formula - Displays the (Tools > Formula Auditing > Evaluate Formula) dialog box that enables you to evaluate parts of a formula. D . Tools
22. Go To Special Slide The (Edit > Go To) special allows you to navigate in the worksheet in many areas making it useful to find key information in the workbook. This makes it a very useful tool. D . Tools
23. Keyboard Shortcuts Slide ( Ctrl + [ )—to select the cells that are precedents of the active cell. (Ctrl + Shift + [ )—Selects all the cells that are directly or indirectly referred to by the formula in the active cell. (Ctrl + Shift + ] )—Selects all the cells that directly or indirectly refer to the active cell. (F5)—Opens Go To dialogue box. (`)—Show the formula in the selected cell. (Shift + F2) – edit or create a new comment. D . Tools
Many businesses use it as the main tool to analyze data and make business decisions. Other very important use of spreadsheet is to provide backup information to presented financial reports. Complex Spreadsheets Modeling might have hidden errors. These errors occurs in formula changes by additions or subtractions of rows and columns. Some of these errors are not find, specially when we are not the creator of the model. Fortunately, there auditing tools embedded to helps un in the process reviewing our spreadsheet models.
A simple spreadsheet error cost a TransAlta, a big Canadian power generator firm a whopping US$24m. Drew Cullen, “Spreadsheet snafu costs firm $24m,” The Register , June 19, 2003, www.theregister.co.uk/content/67/31298.html. A simple number enter as text cost school £30,000 shortfall . AccountingWeb News, “Excel spreadsheets in School budgeting - a cautionary tale (2001)” AccountingWeb, June 18, 2006, AccountingWEB.co.uk 18-Jun-2006 Double counted entry in budget face a fall short of $70M New Hampshire Sunday News Jan 29, 2005 "Mistakes happen during budget planning": US$70M http:// www.theunionleader.com/articles_showfast.html?article =50185 Many more case are publish by the European Spreadsheet Risks Interest Group Involving millions of dollars because of one single error.
It needs to be programmed by user to perform these activities. But once is setup it runs invisible and that is why we call it indirect method.
This Toolbar is so powerful and use by so many reviewers that Microsoft took this toolbar and add a few gadgets and is selling it as a separate Add-in to Excel. Before we invest in Add-in let first master these tools and if we need additional power then is worth investing.
You can also display the Error Checking dialog box by selecting (Tools > Error Checking) . This can help you to work out why a formula is returning an error and help you to identify the cause. When Excel cannot properly evaluate a formula it will display one of the default error values (#DIV/0!, #VALUE! etc).
Tracer arrows are graphical view of the flow of data on a worksheet and can help you to understand formulas that contain lots of cell references. When the cell reference is not on the active worksheet an arrow and a small worksheet icon appears. When a cell contains a reference to a different worksheet or to a workbook a dashed tracer arrow appears with a small icon attached to it.
A cell that has dependents can contain either a formula or a constant value. Alternatively you can select (Tools > Formula Auditing > Trace Precedents).
This option traces the error using the trace arrows, with the destitution in the line being red.
Comments are short bits of text: Adding comments to your worksheet cells has several uses: 1) Useful for tracking progress and for tracing your footsteps when handling complex formulas. 2) Useful for reminding yourself how certain areas of a worksheet work. 3) Useful for communicating with other people when you are sharing the same worksheet. You can only attach one comment per cell although you can make the comments as long as you want. By default a small red triangle appears in the top right corner of a cell when that cell contains a comment. When you move the cursor over a cell displaying this indicator the comment will be displayed automatically.
Data Validation another useful tool discuss later on this presentation. To see what data restrictions and messages are in effect for a cell, click the circled cell, and then select (Data > Validation). Data Validation can stop you from entering a value outside the range, give you a warning or allow you to enter the data if it is not properly setup.
This window allows you to monitor the output generated from formulas as you make changes to other parts of the workbook. This watch window will even work if you have cell references between workbooks and you are changing the values in the original workbook. This window is always visible and prevents you returning to the formulas location in order to see the results of a dynamic formula. This provides remote viewing for any cell on any open worksheet.
This feature was introduced in Excel 2002. Formulas can quickly become very complicated, especially if you are using nested worksheet functions. This allows you to break up your long formulas into smaller ones and to evaluate them separately. This helps you debug complex formulas by stepping you through each calculation and displaying the results. This dialog box displays the formula and the values that are supplied as arguments. If your formula does not return the correct value then you can use the Evaluate Formula dialog box to step into the formula. It does not allow you to change the formula only to step though it. If you want to change the formula you must close the Evaluate Formula dialog box. The formula in cell B2 contains a cell reference as well as two nested worksheet functions. =UPPER(LEFT(A2,FIND(" ",A2))) This formula can be broken up into individual steps: 1) The FIND() function is used to locate the character position of the first space in the text " Investment in Blyth Home Expressions ". 2) The LEFT() function is then used to obtain all the text that is to the left of this space. In this case the first word “Investment". 3) The UPPER() function is then used to convert all the characters to uppercase resulting in the final value which is the text “INVESTMENT". Evaluate - Replaces any calculated arguments with their actual values. Shows result of an underlined expression or the value represented by an underlined cell reference. Step In - Allows you to examine the formula represented by the underlined cell reference. This is not available when the cell being referenced is in another workbook. Allows you to view the actual contents of any referenced cells before applying it to the formula by displaying it in a separate box. Step Out - Applies the argument to the function and combines the process. Selecting "Step In" evaluates the cell A2. This separates that particular piece of the formula and evaluates it separately in the box underneath. You can click the Evaluate button as many times as necessary to replace all the calculated arguments in your nested formulas
Comments - Cells that contain comments. Constants - Cells that contain constant data (text, numbers or dates) as opposed to formula. Select or clear the numbers, text, formula check boxes to specify whether to include them in the search. Formulas - Cells that contain formulas (i.e. start with an equal sign "=") rather than constant values. Select or clear the numbers, text, logical and errors check boxes to specify whether to include them in the search. Blanks - Cells that contain no data or formatting. Excel automatically ignores every cell below and to the right of the last cell in a worksheet that contains data. Current Region - The active cell and all cells surrounding it up to the first blank row and column in all directions. Current Array - select a cell with an array-entered formula. The entire range of cells containing the array formula is highlighted. Objects - Any objects on the worksheet including charts, text boxes, autoshapes. Row Differences - Selects cells whose contents are different from the comparison cell in each row. For each row, the comparison cell is in the same column as the active cell. Cells within the selected range whose contents are different from the contents of the comparison cells you specify. Select the range of cells to evaluate, click a cell in the comparison column to make it active, then select this option button on the dialog box. Column Differences - Precedents - Cells to which the active cell refers. Select the Direct Only option (default) to select only direct references or the All Levels option to include indirect references as well. Dependents - Cells refer to the active cell. Select the Direct Only option (default) to select only direct references or the All Levels option to include indirect references as well. Last Cell - The last cell used in the active worksheet. This cell is only updated when the workbook is closed. Visible Cells Only - Only cells which are visible as opposed to hidden. This option can be useful when you want to copy just the filtered rows from a table of data. Select the range, display the dialog, select this option and then copy the data. Conditional Formats - Cells that have had any conditional formatting applied to them. Select the All (default) option to select all cells or the Same option to select only cells which have the same conditional formatting as the active cell. Data Validation - Any cells that contain any data validation rules. Select the All (default) option to select all cells or the Same option to select only cells which have the same data validation as the active cell.
Some people hide the formula bar to make room in the window for other toolbar. Tracer line are objects if they do not show this option is uncheck. Gridlines might be remove to see report better.
Some times one is working in a spreadsheet and the formula do no update until one saves the files or press F9 to update the formulas. This is because is set to Manual calculation.
By default, Microsoft Excel automatically formats new data that you type at the end of a range to match the preceding rows. Excel also automatically copies formulas that have been repeated in the preceding rows and extends them to additional rows. Note In order to be extended to new rows in the range, the formats and formulas must appear in at least three of the five preceding rows.
R1 C1 is mostly use old school, people who were use to work with Lotus or Quattro. Other types of spreadsheet not commonly use. Insurance Risk analysis use the R1 C1 style cell reference in the formula reference because are self-contained. When a macro performs a calculation it uses the R1 C1 style cell reference.
Any cells that return an error have a Trace Error smart tag automatically appear in the bottom left corner of the cell. As discuss earlier there are many options to look with the error checking tool.
Note: Data validation is not foolproof. It can be circumvented by pasting data into the cell, or by choosing Edit|Clear|ClearAll Displaying a descriptive prompt to remind users what type of information should be entered in a cell. Displaying an error message if the user enters an invalid value in a cell. Prevent a value appearing more than once. numbers within a specific range. a certain number of characters to be entered. You can copy data validation from one cell to another by using the (Edit > Copy) and (Edit > Paste Special) dialog box. If you want to apply data validation to a large block of cells, it is easier to add the data validation to just one cell and then copy and paste the data validation using the Paste Special dialog box. These rules only apply to data that is entered into a cell manually and does not work on data that is pasted into cells using a macro ??
Although there are only three rules you can have four conditions by pre-formatting the cells as condition 1
The logic behind the formula is the countif function will look in the range ($B$2:$B$13) the criteria B2 (first cell) relative value, then we add >1 once it perform the count, if the count is more than one then it will highlight the color we indicate. If you want to high light the one that repeat twice the change the >1 to =2 for more than twice then change it to >2.