Downloaded 139 times


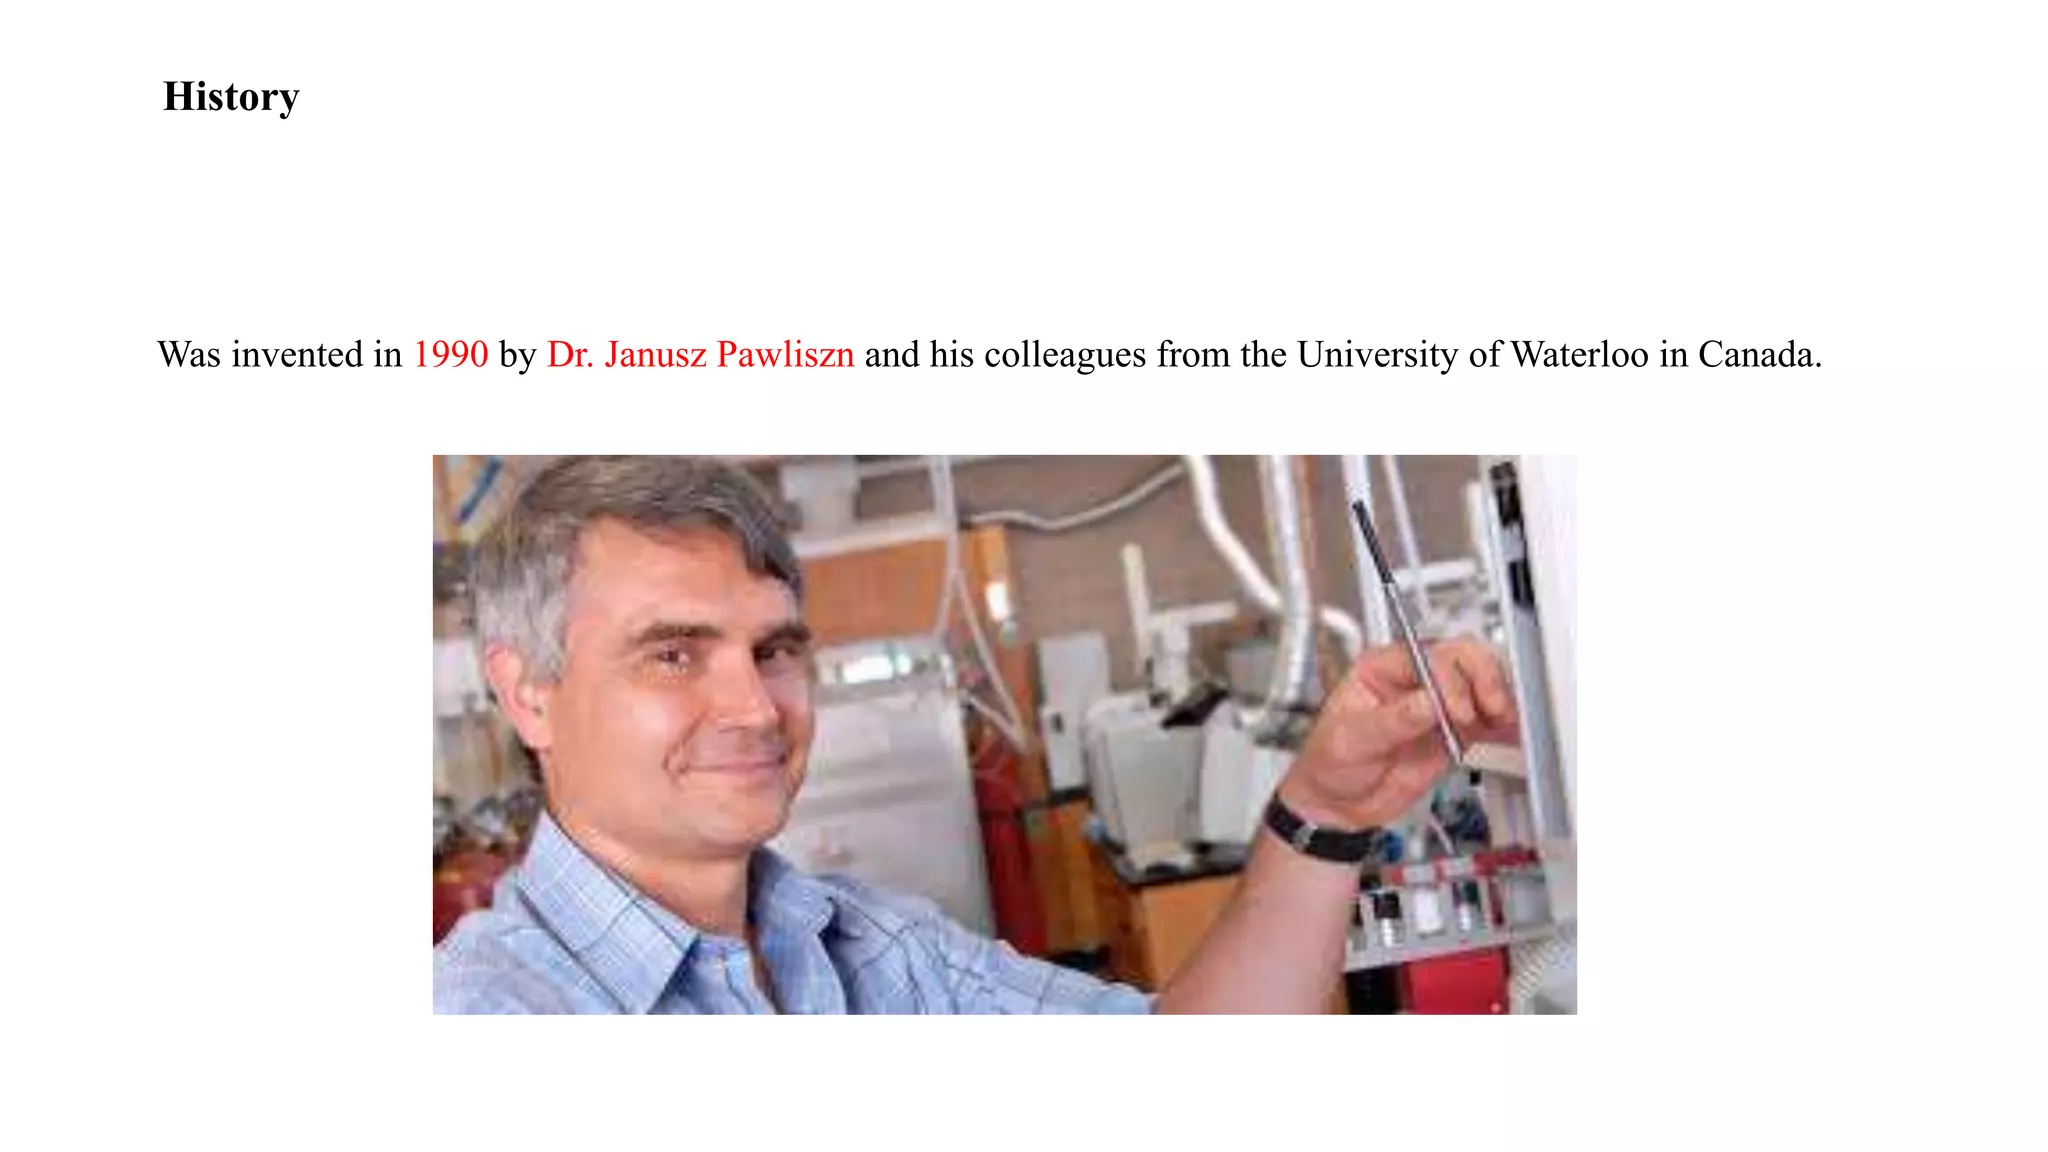
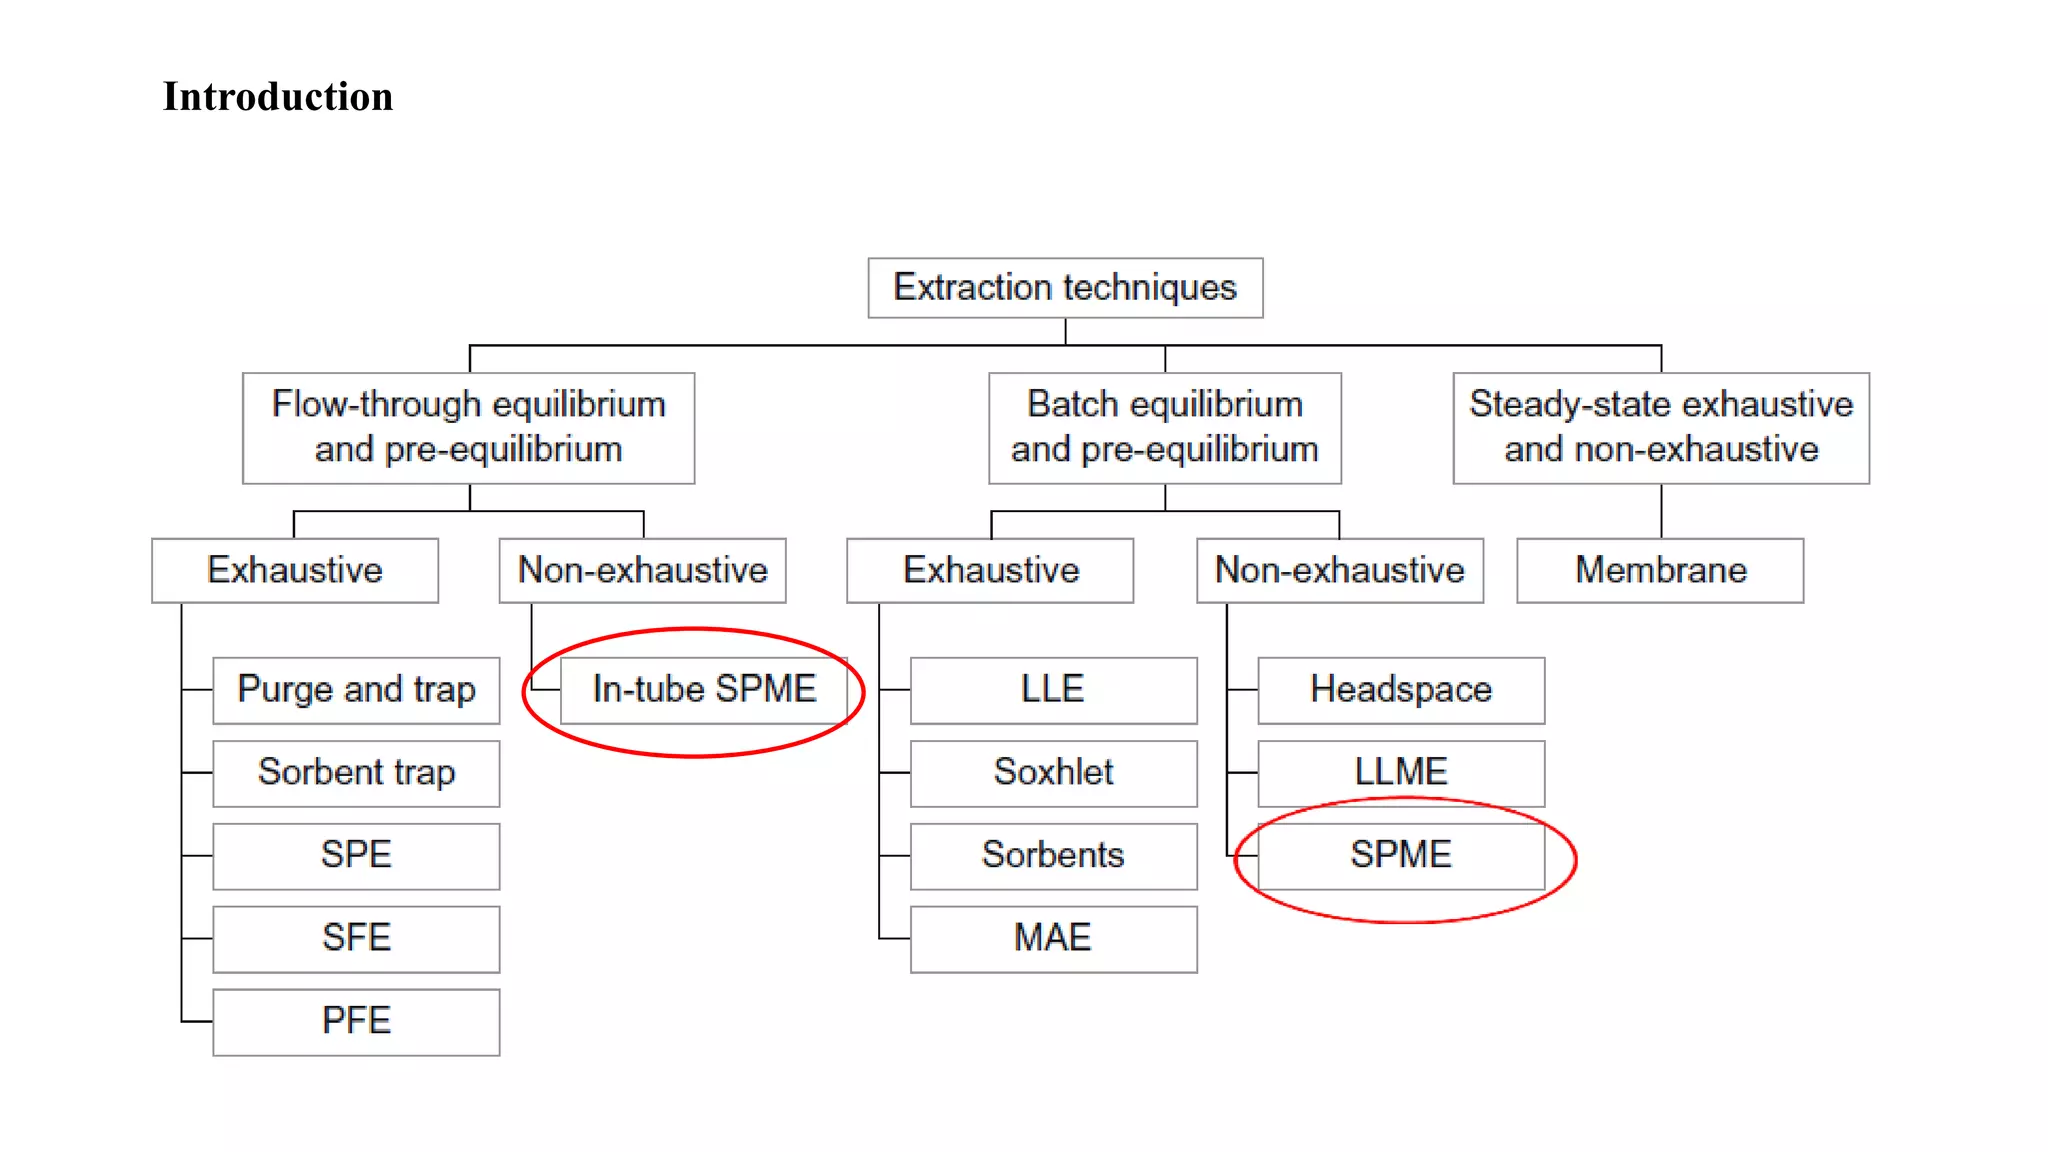
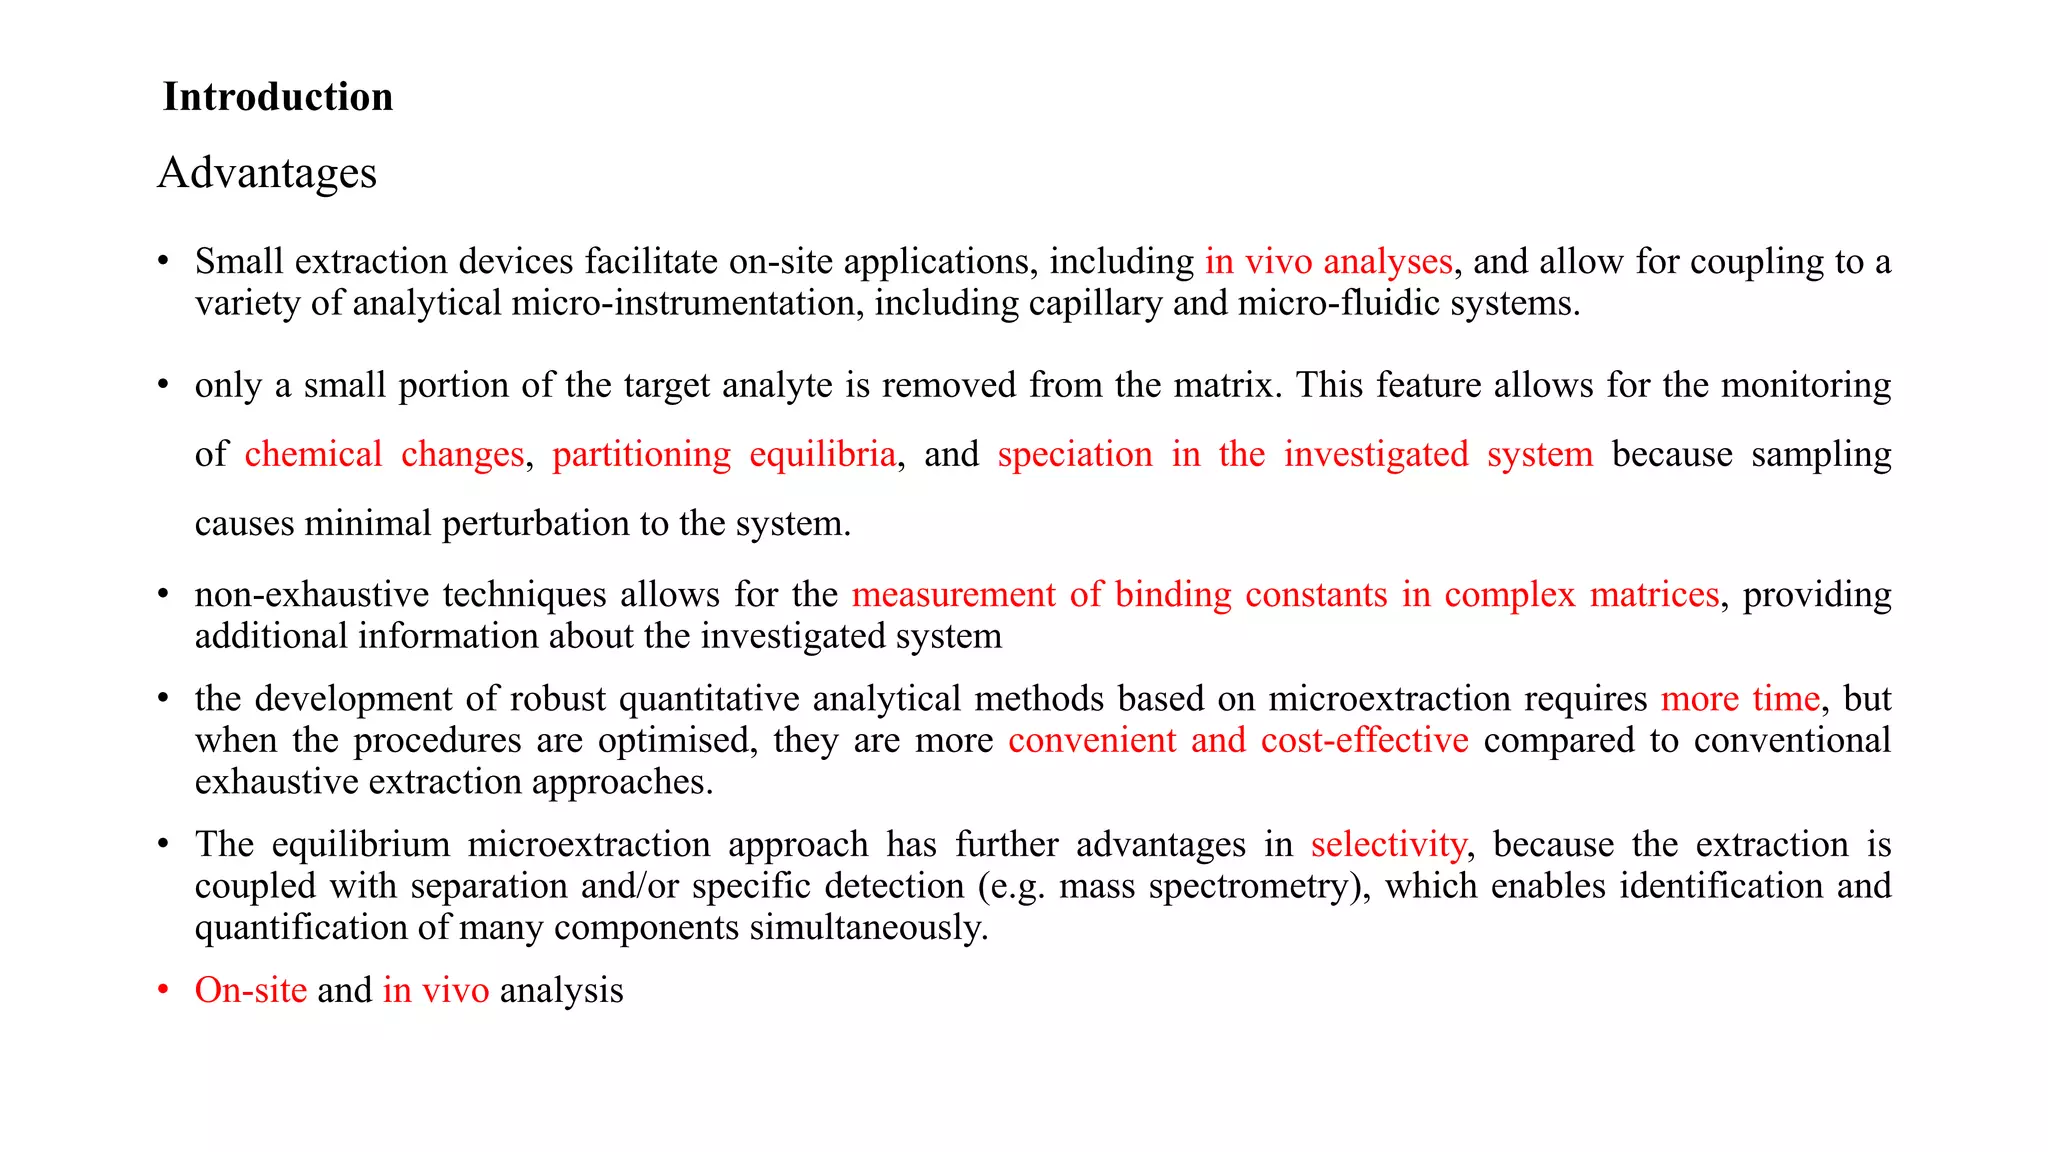
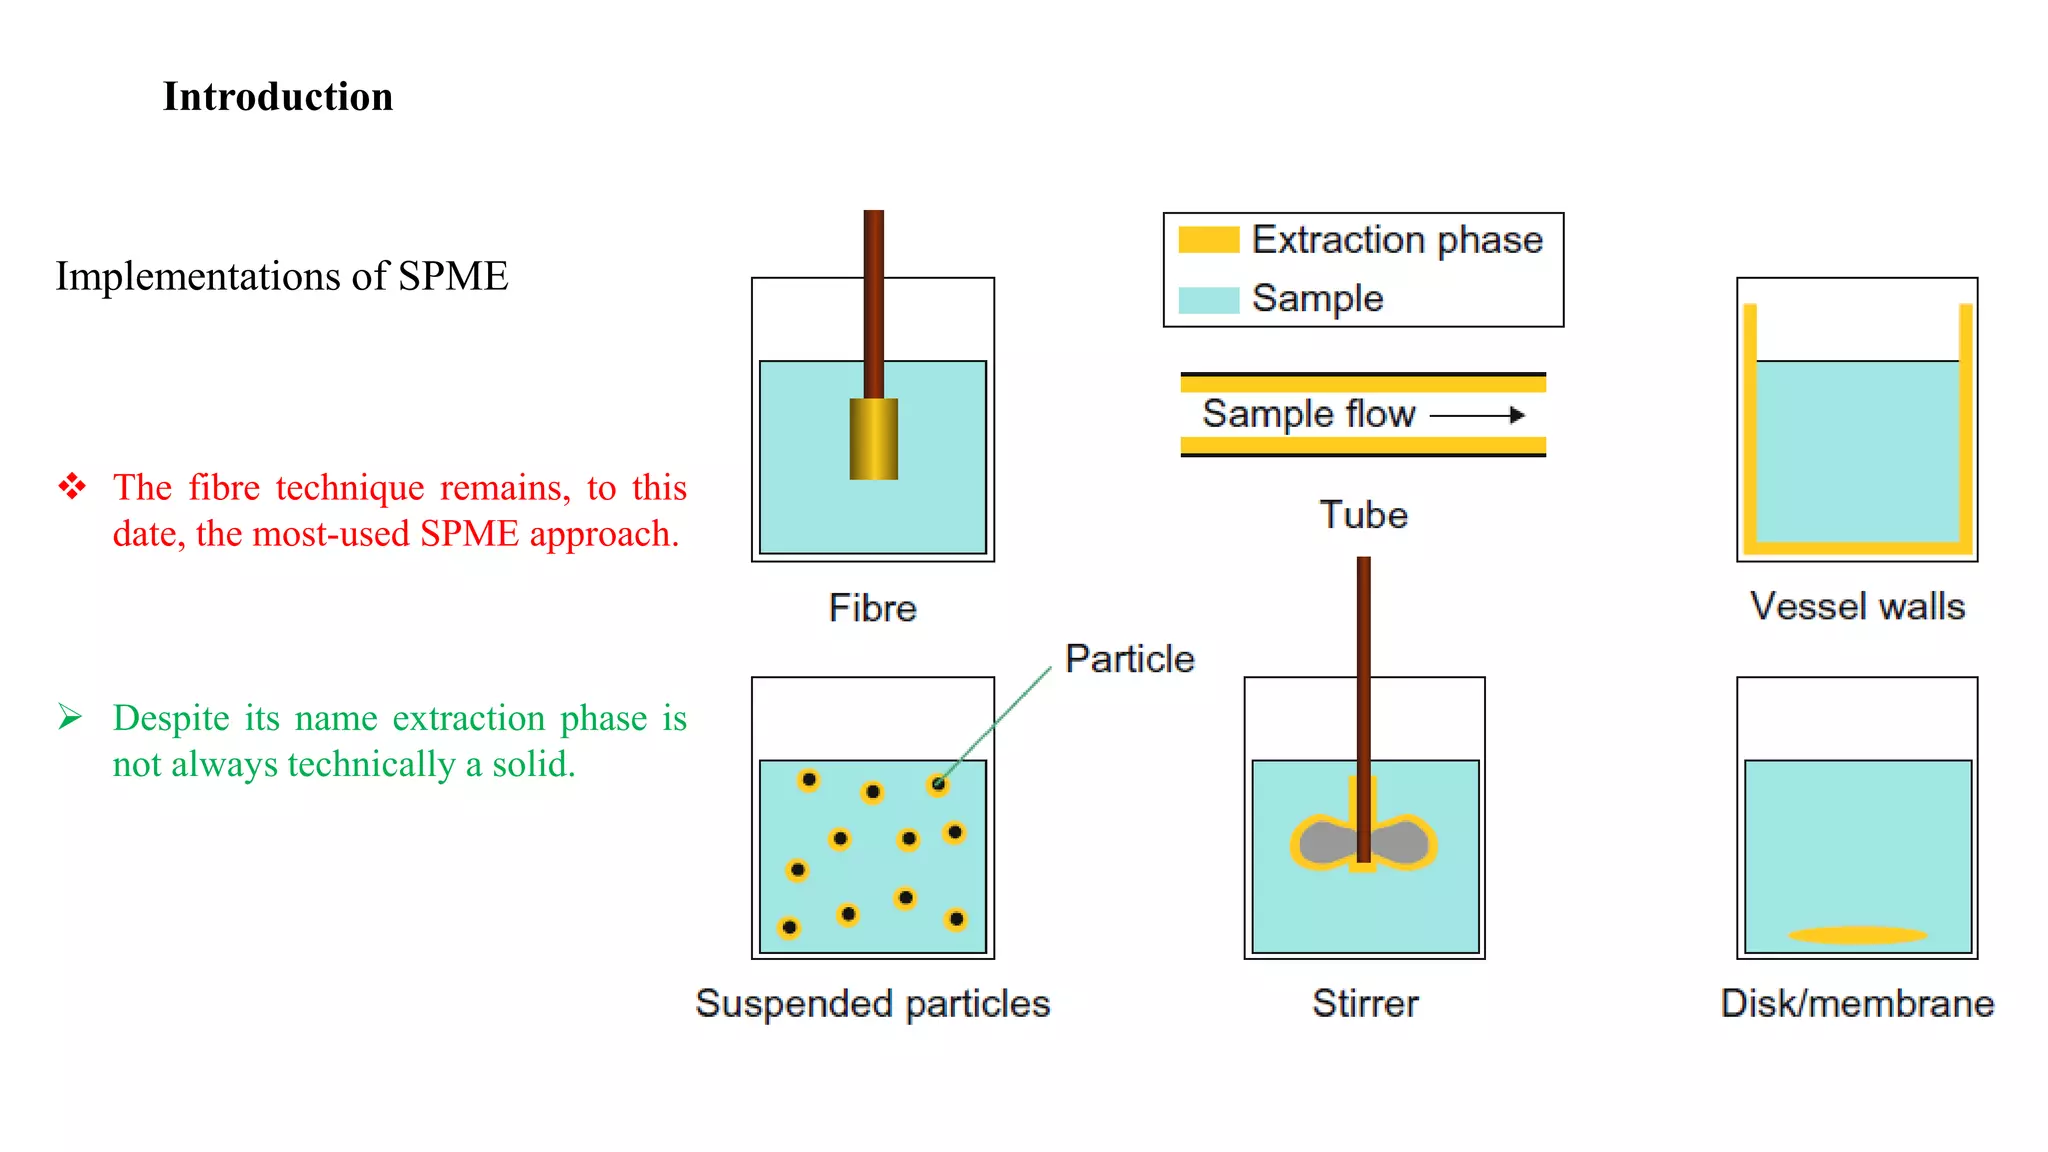
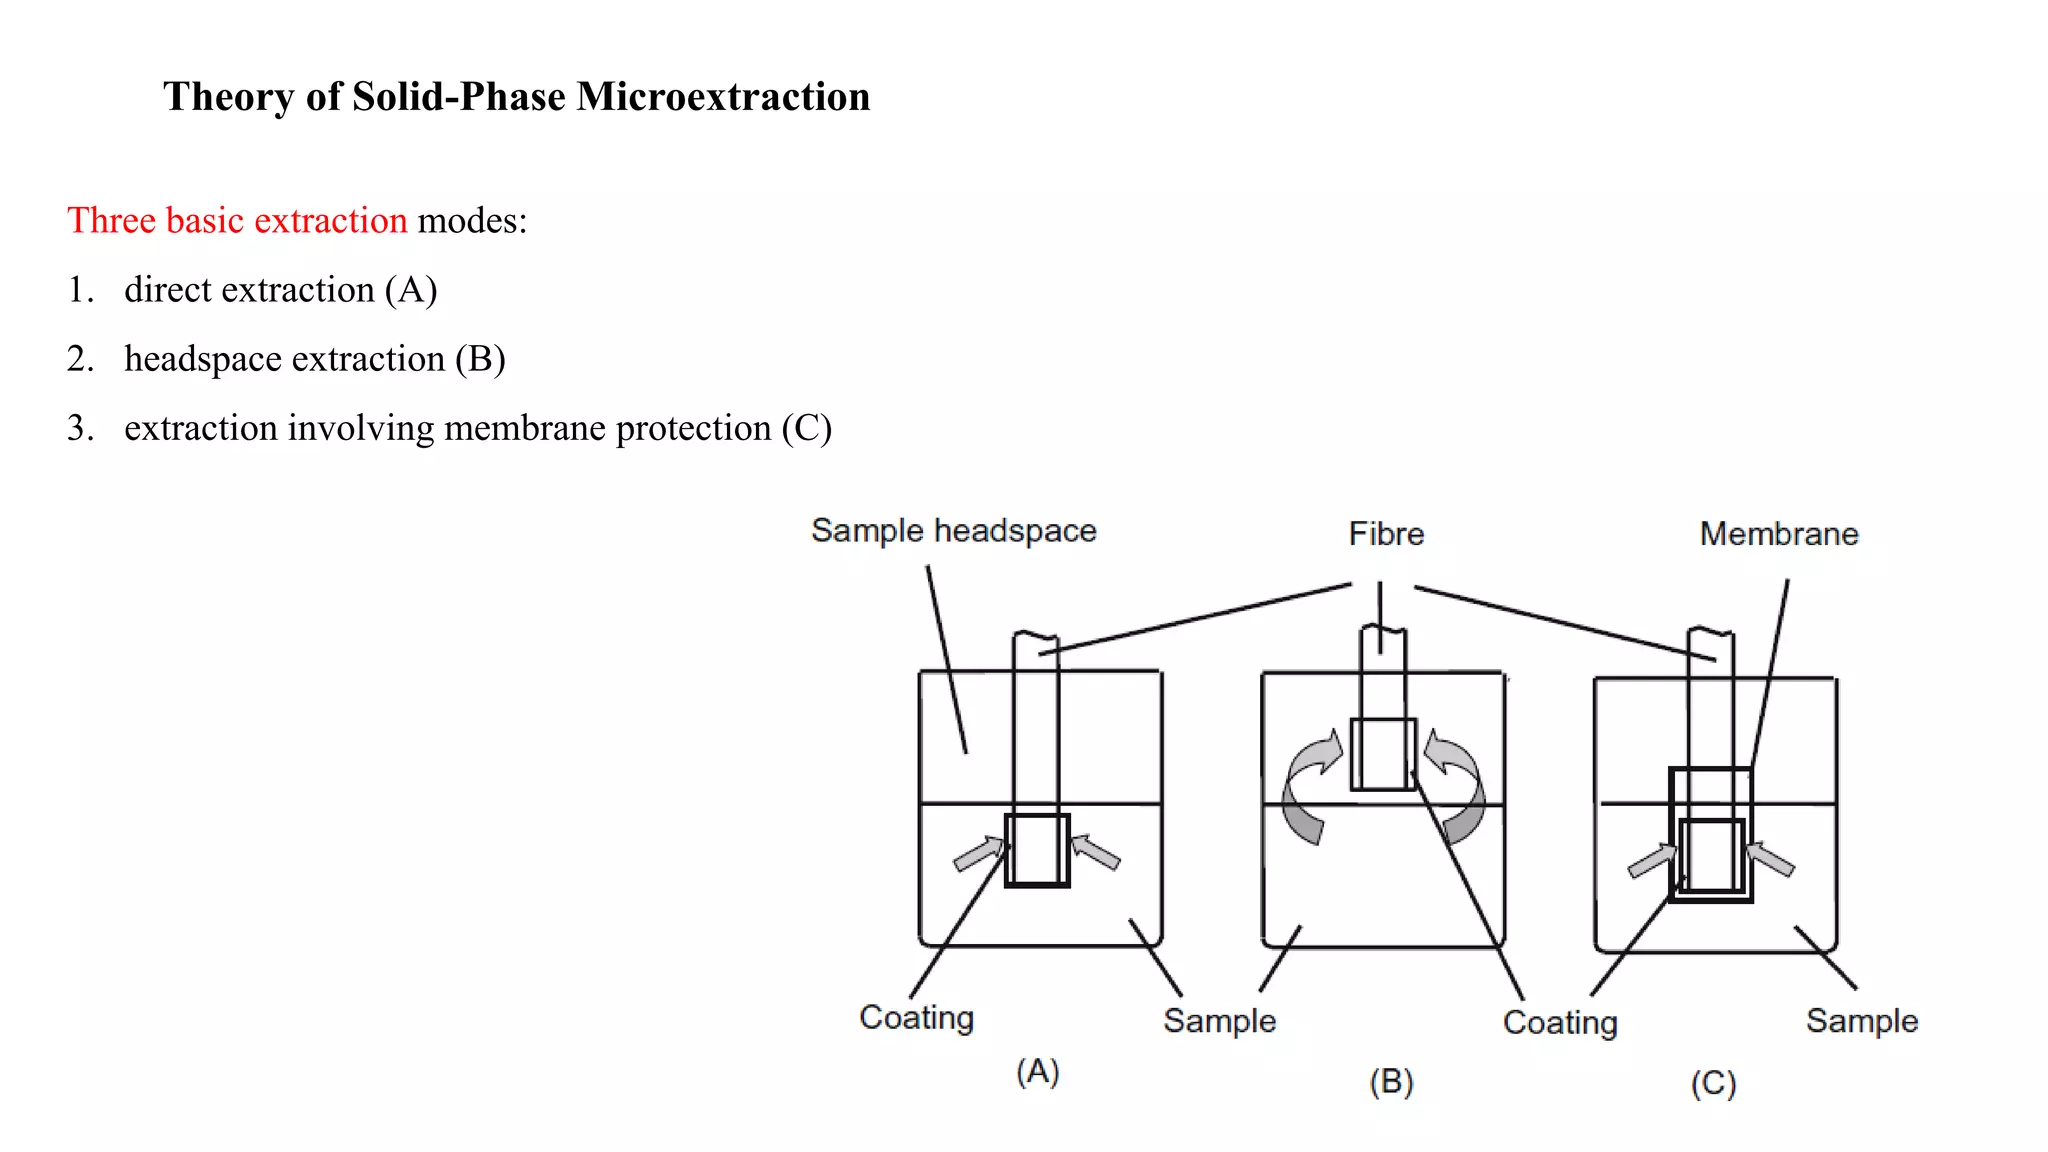

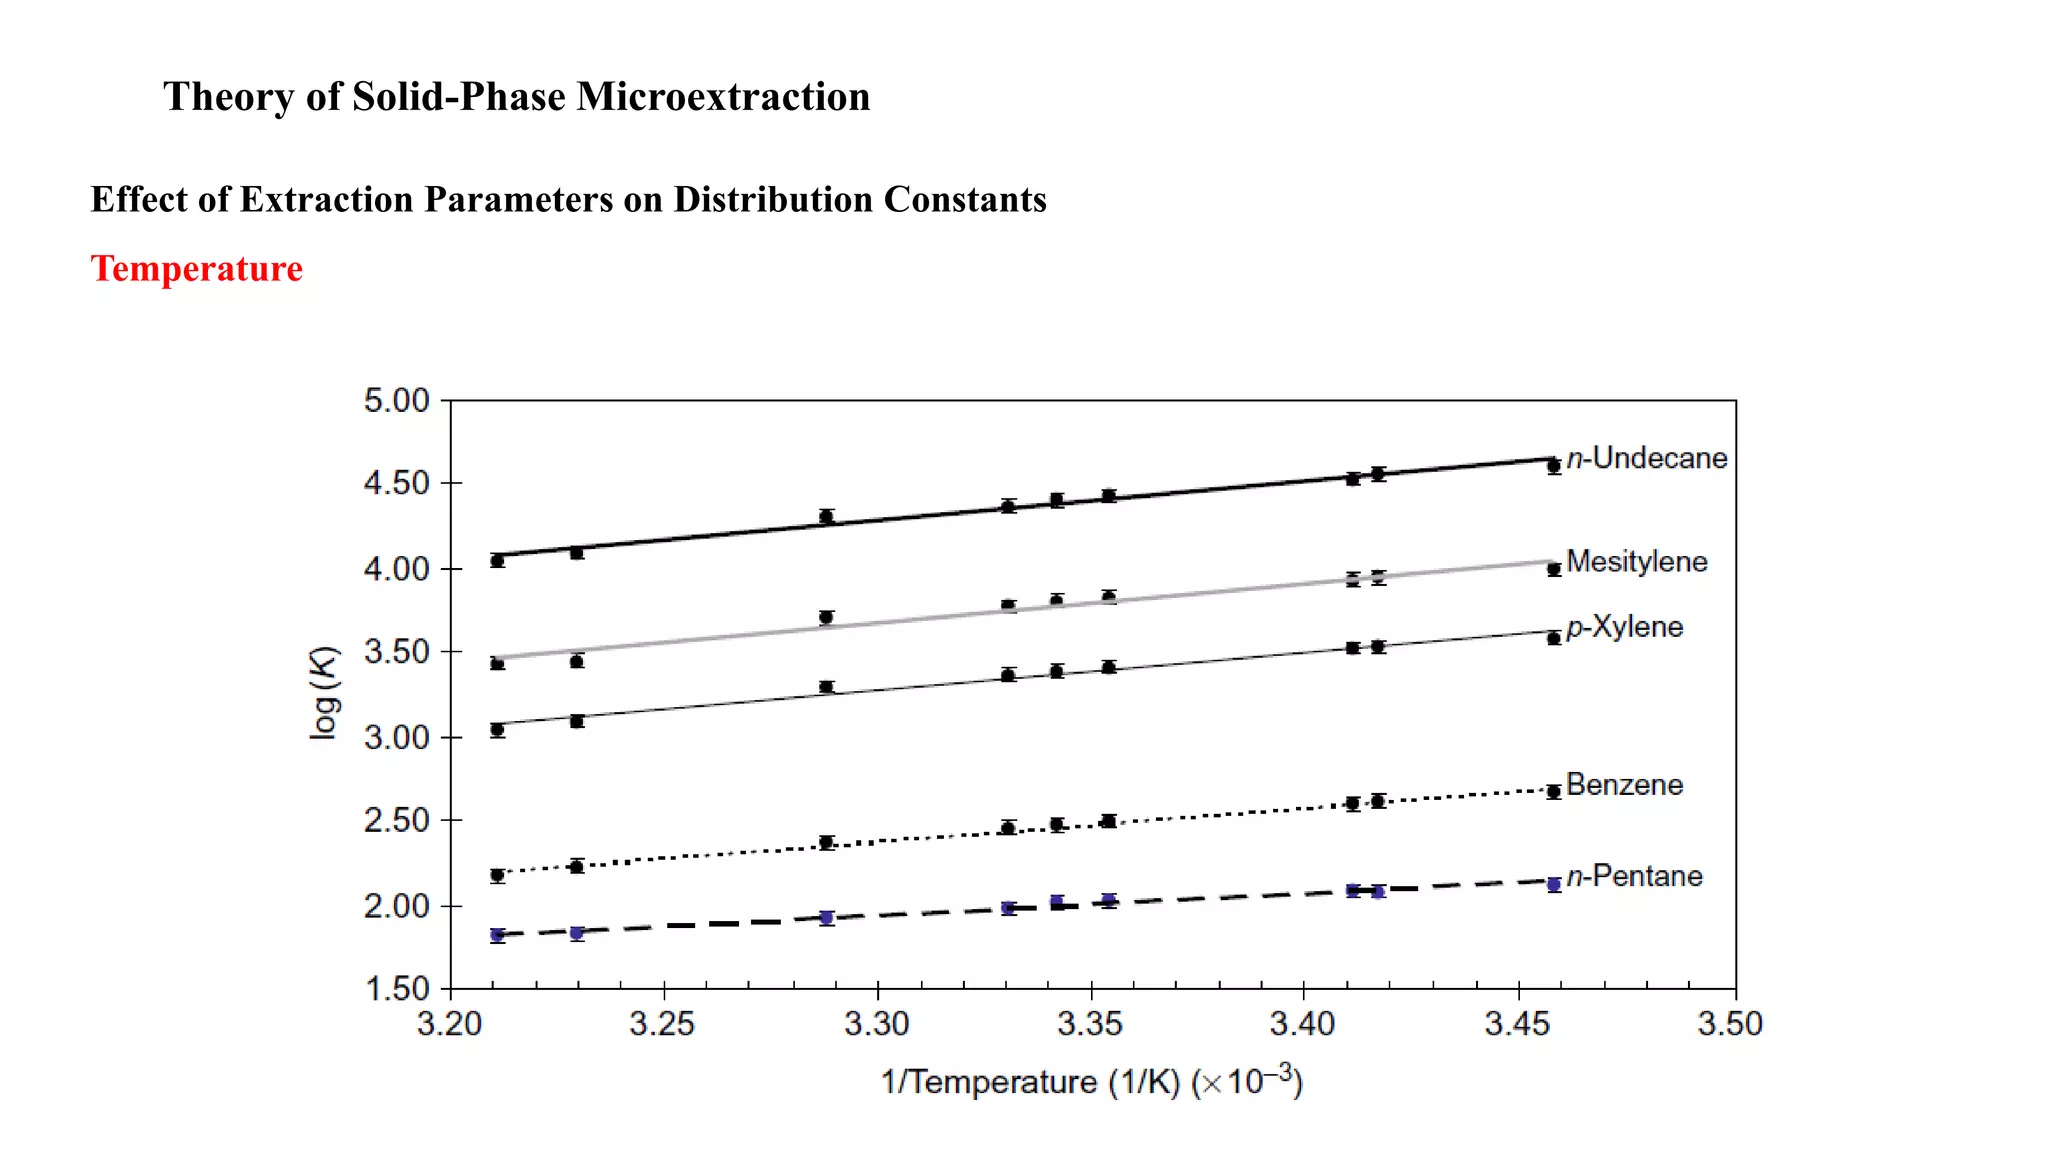
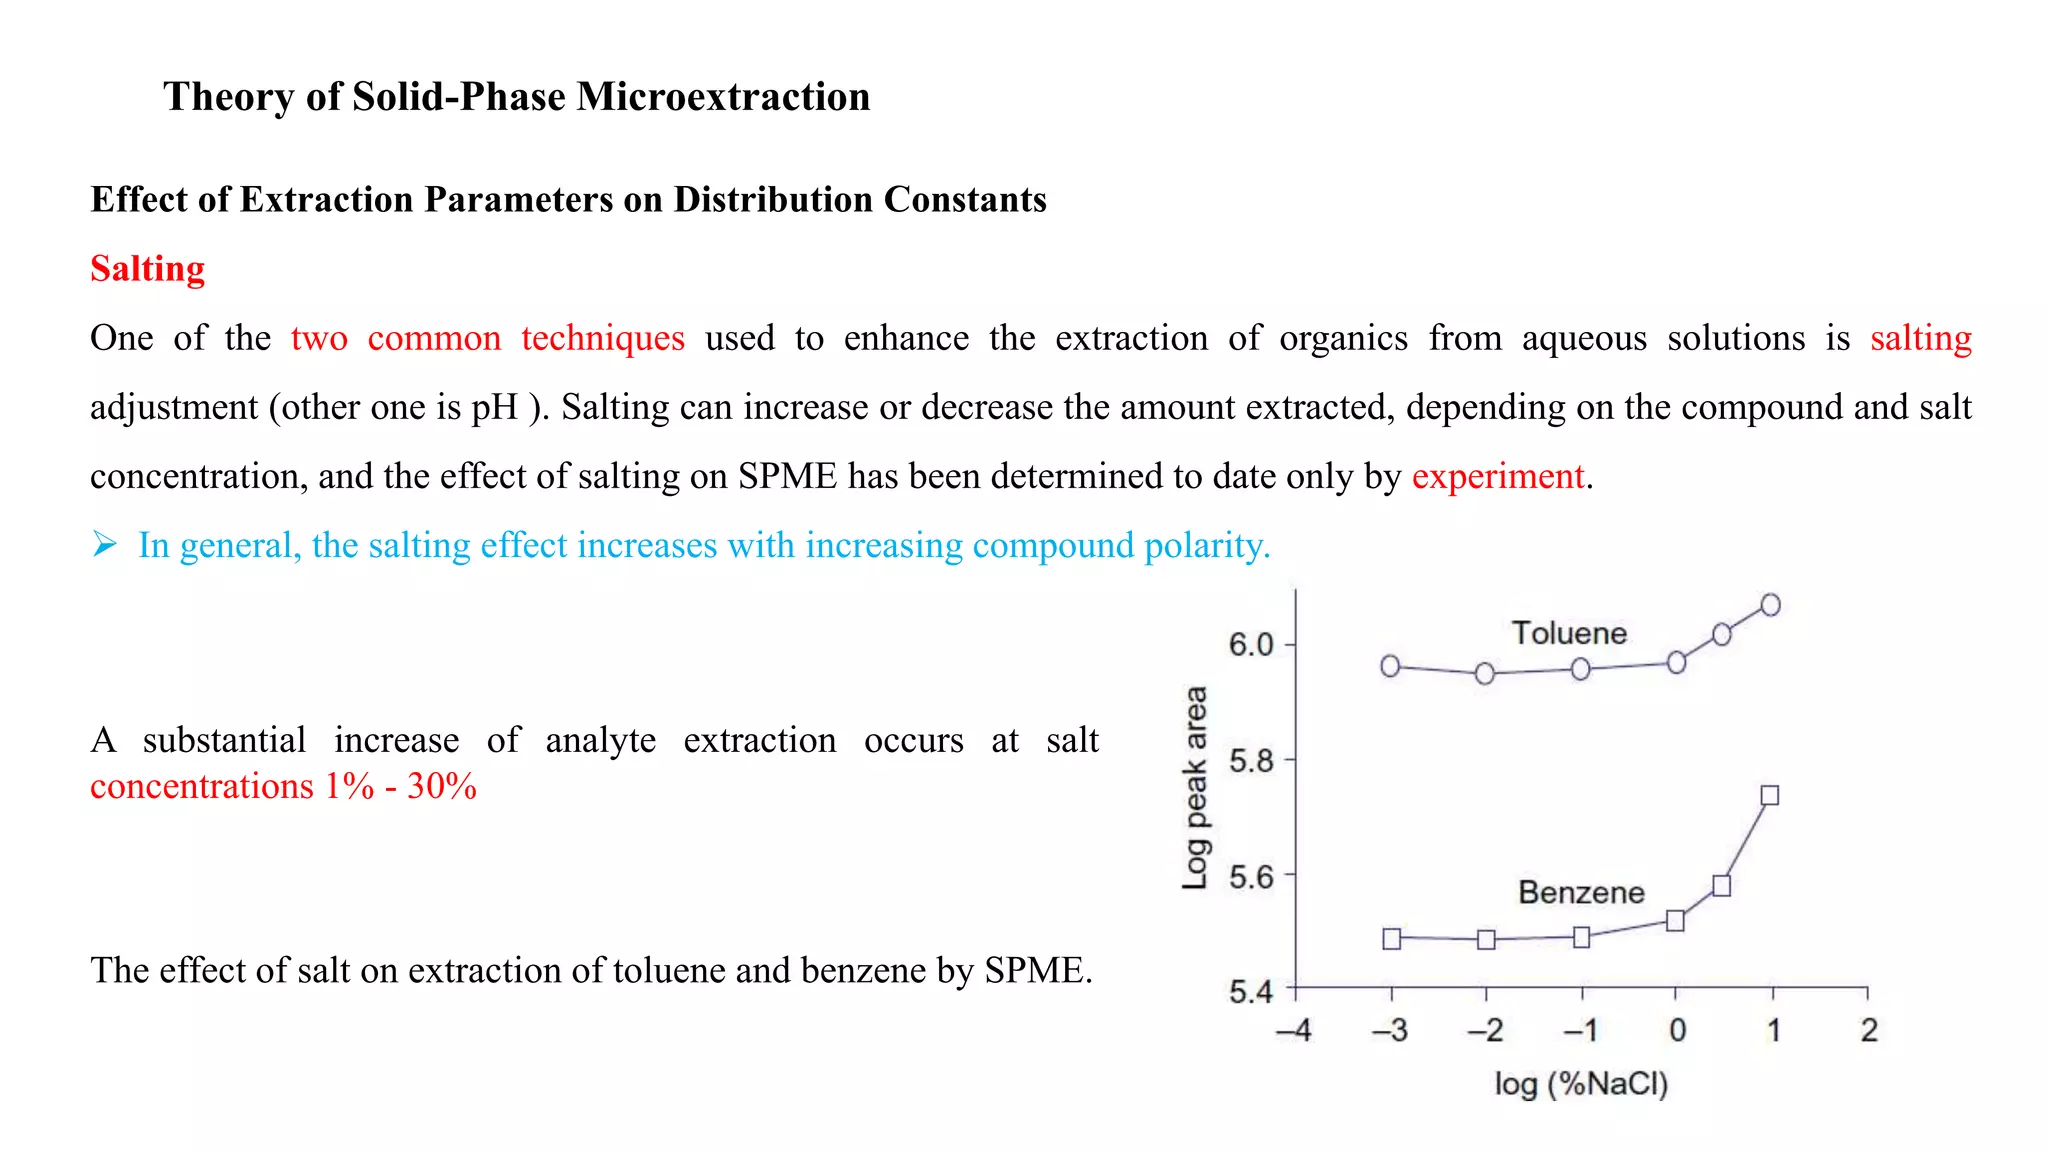
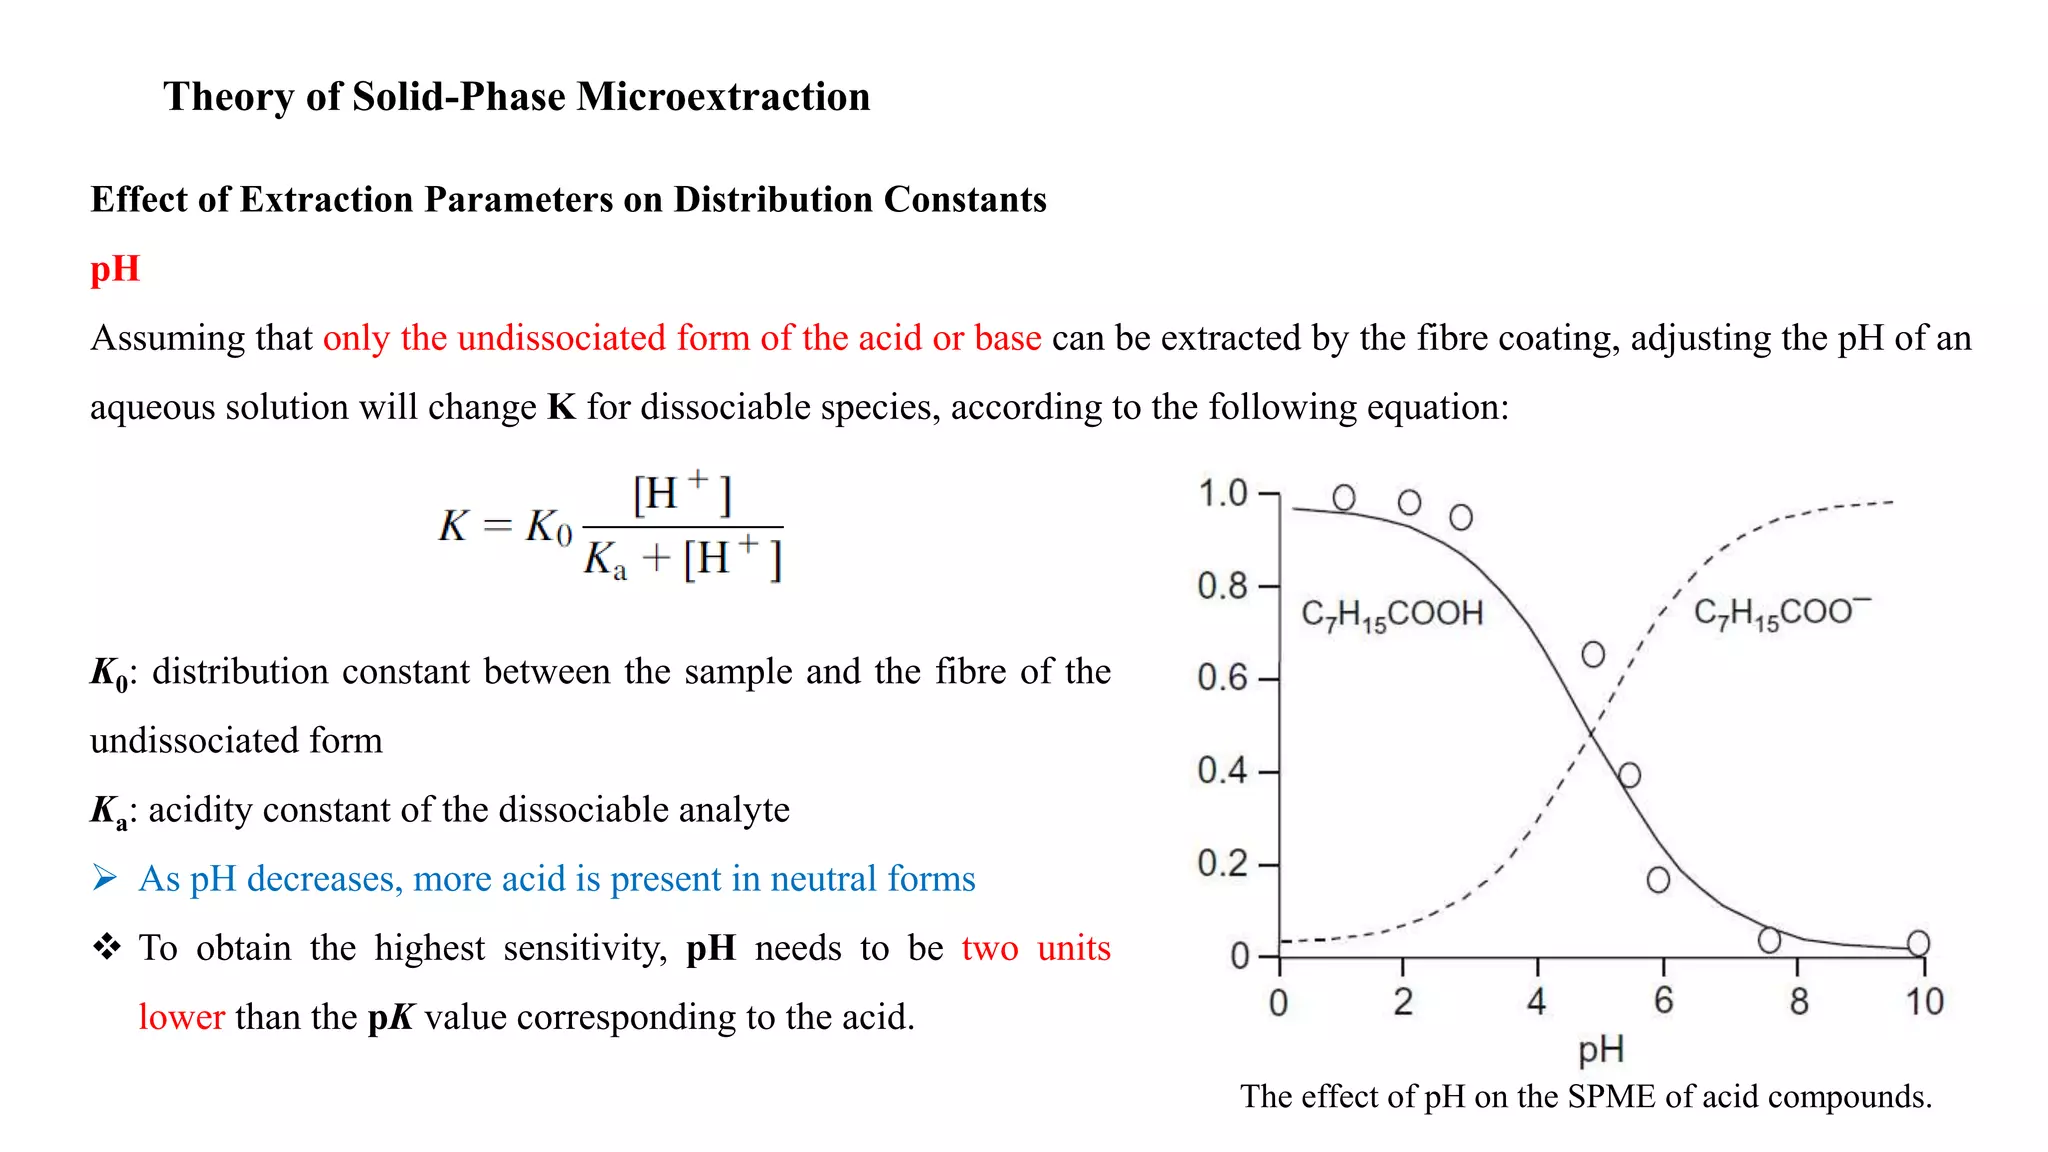
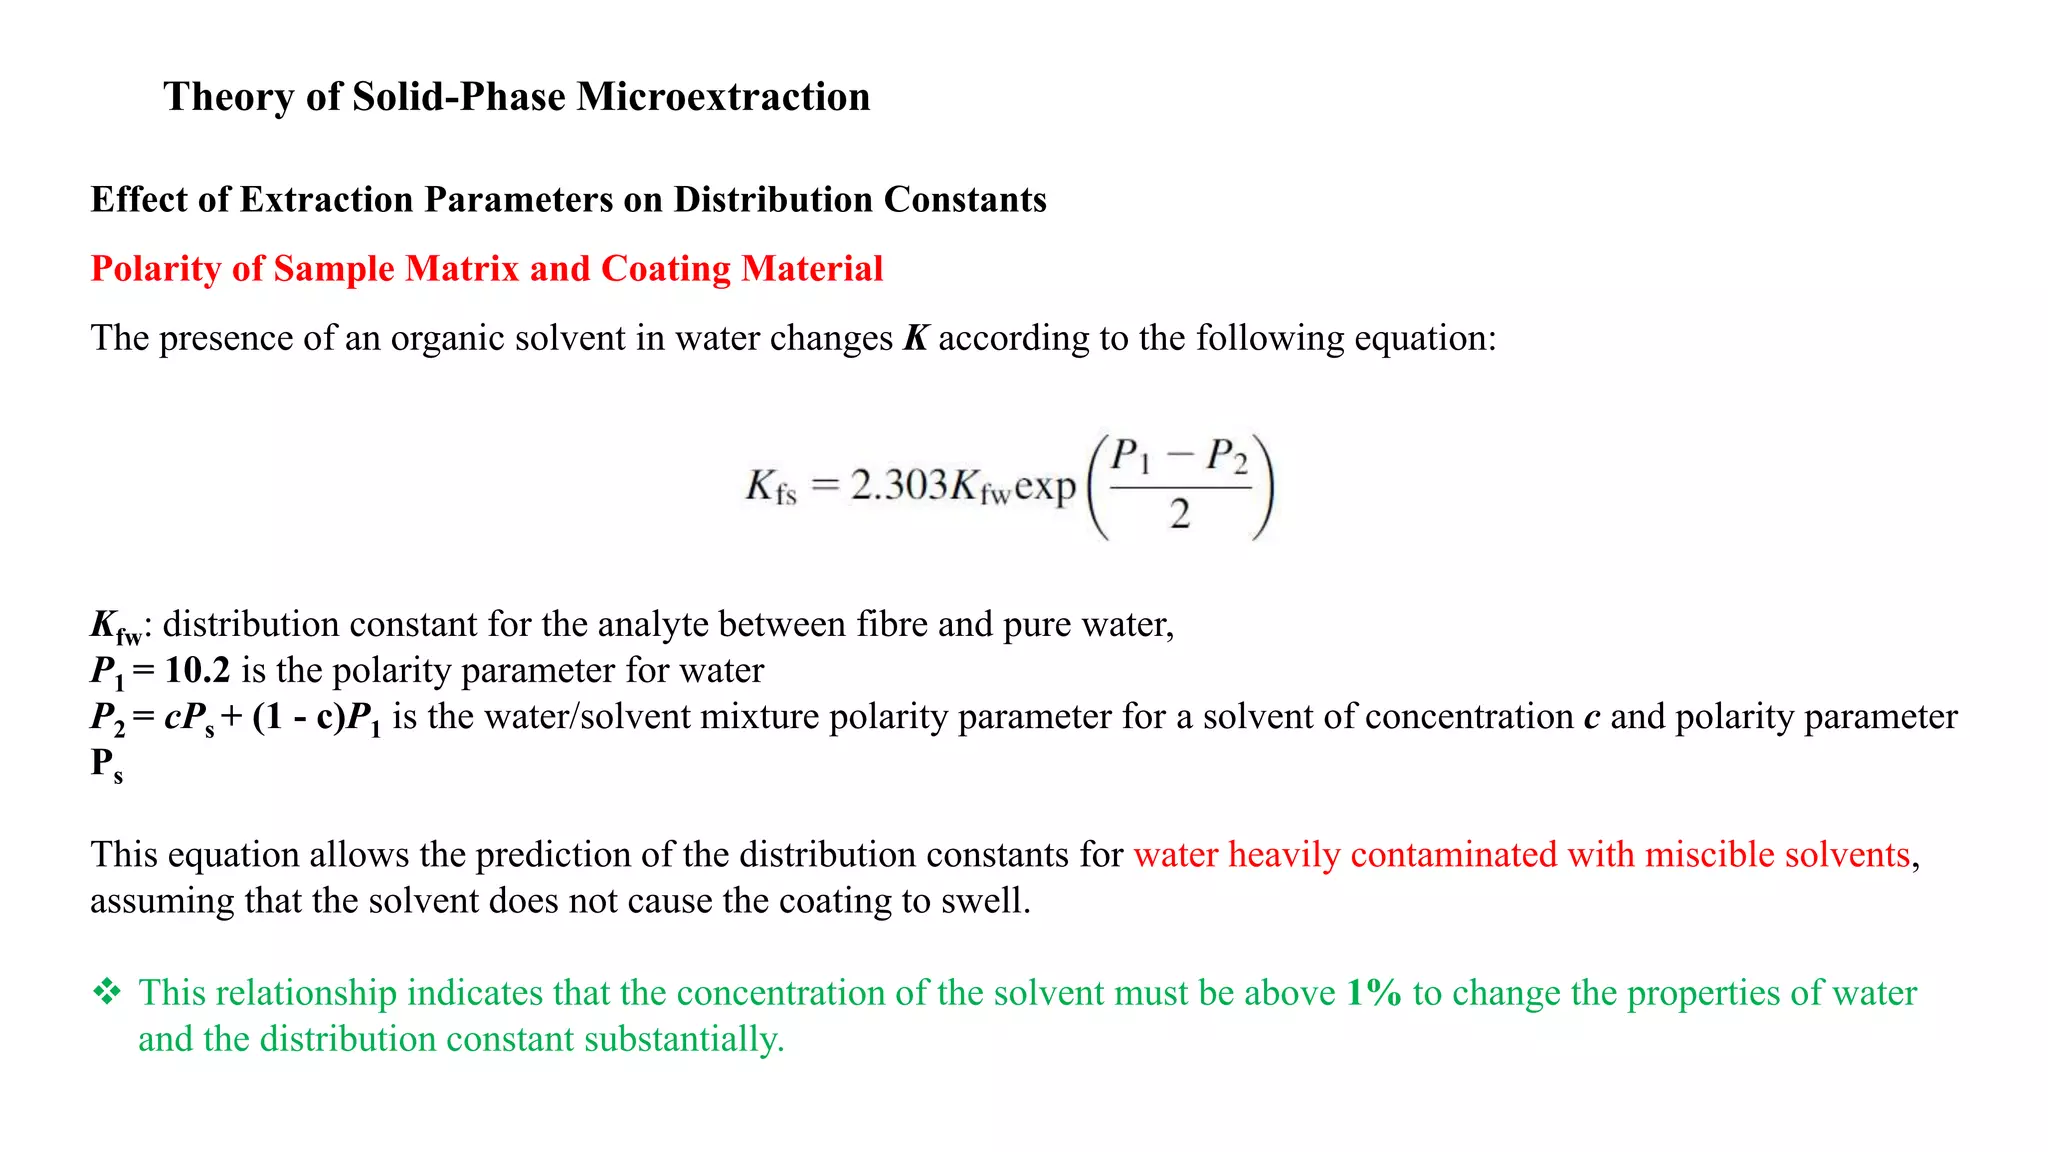
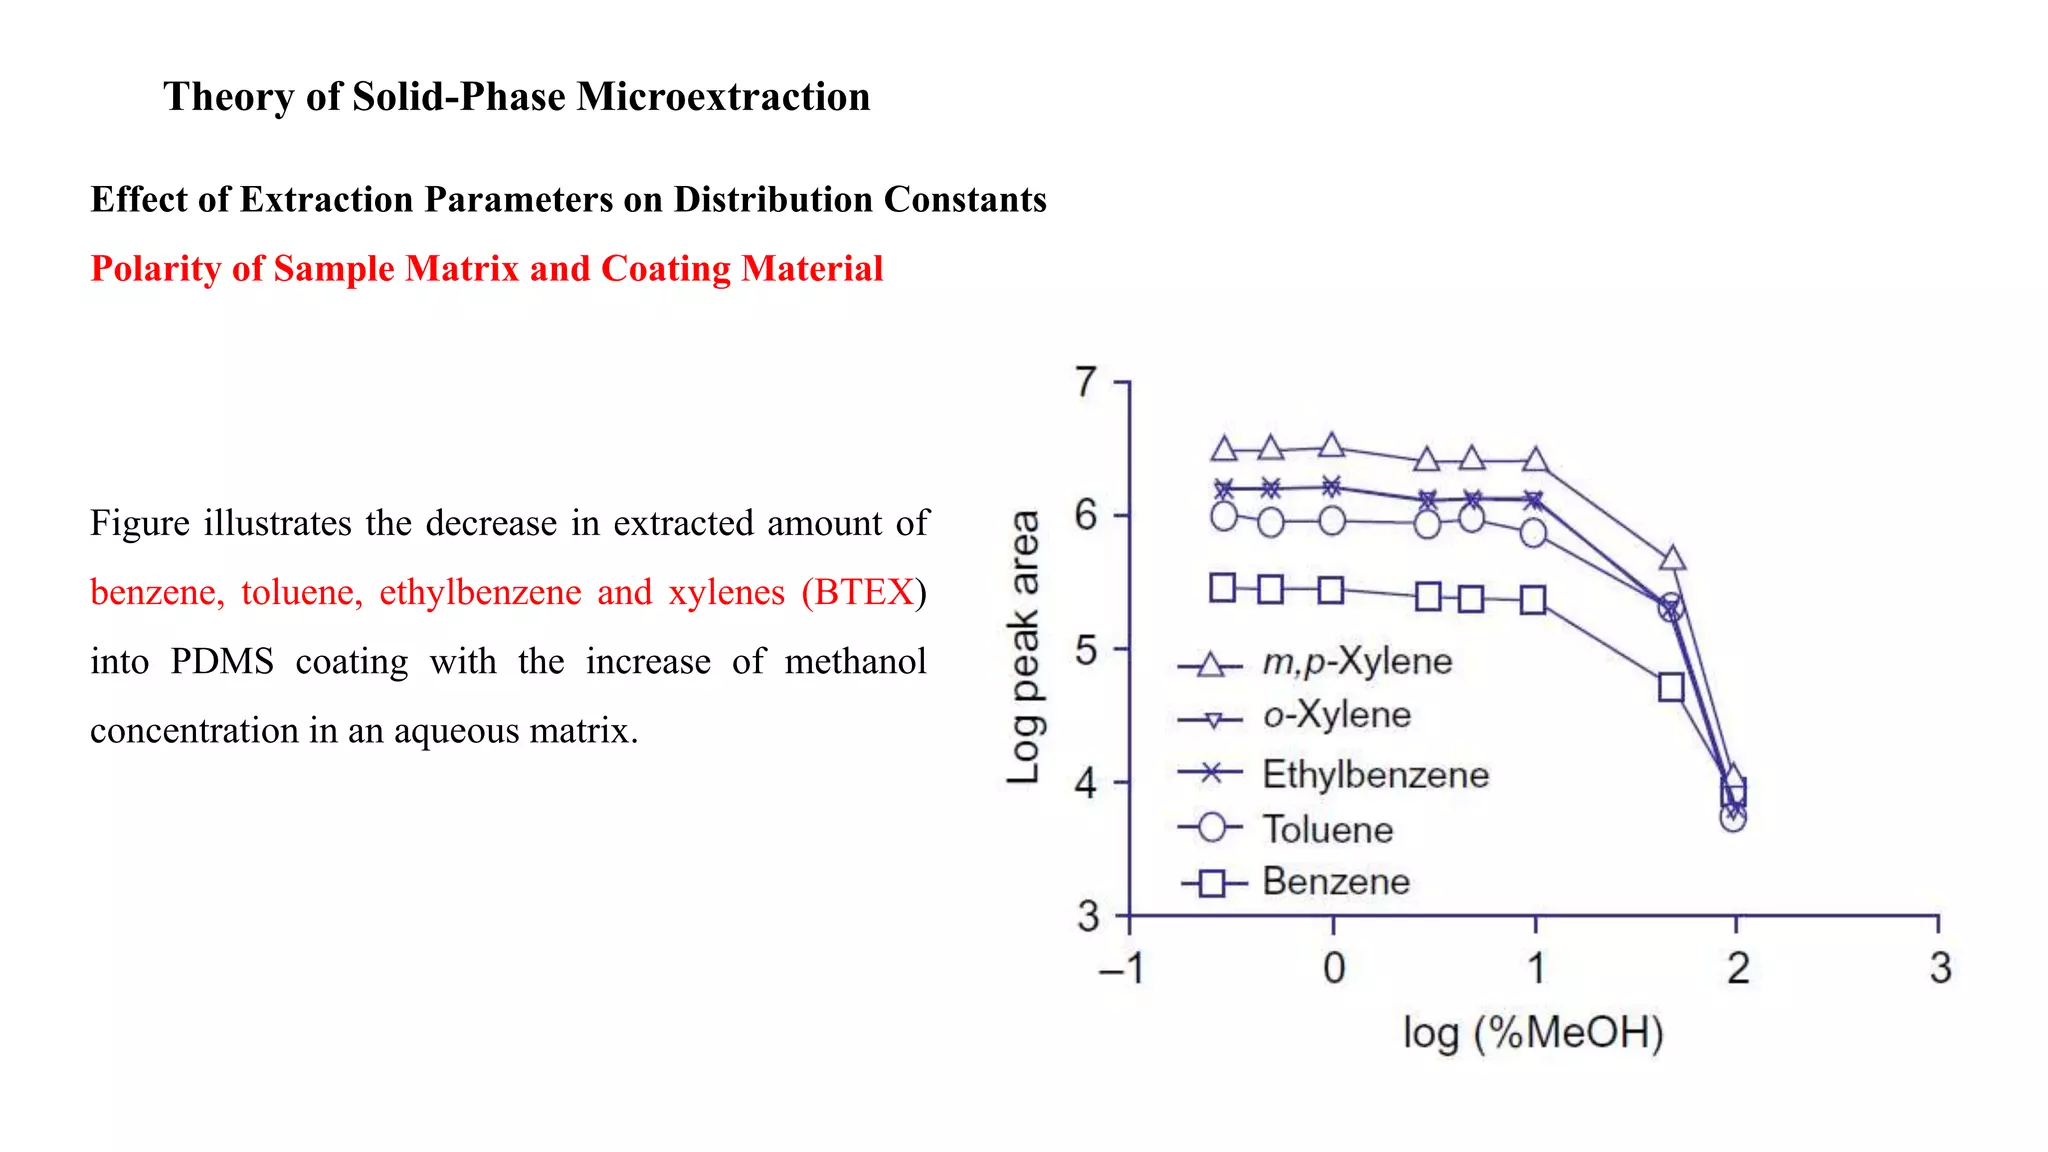
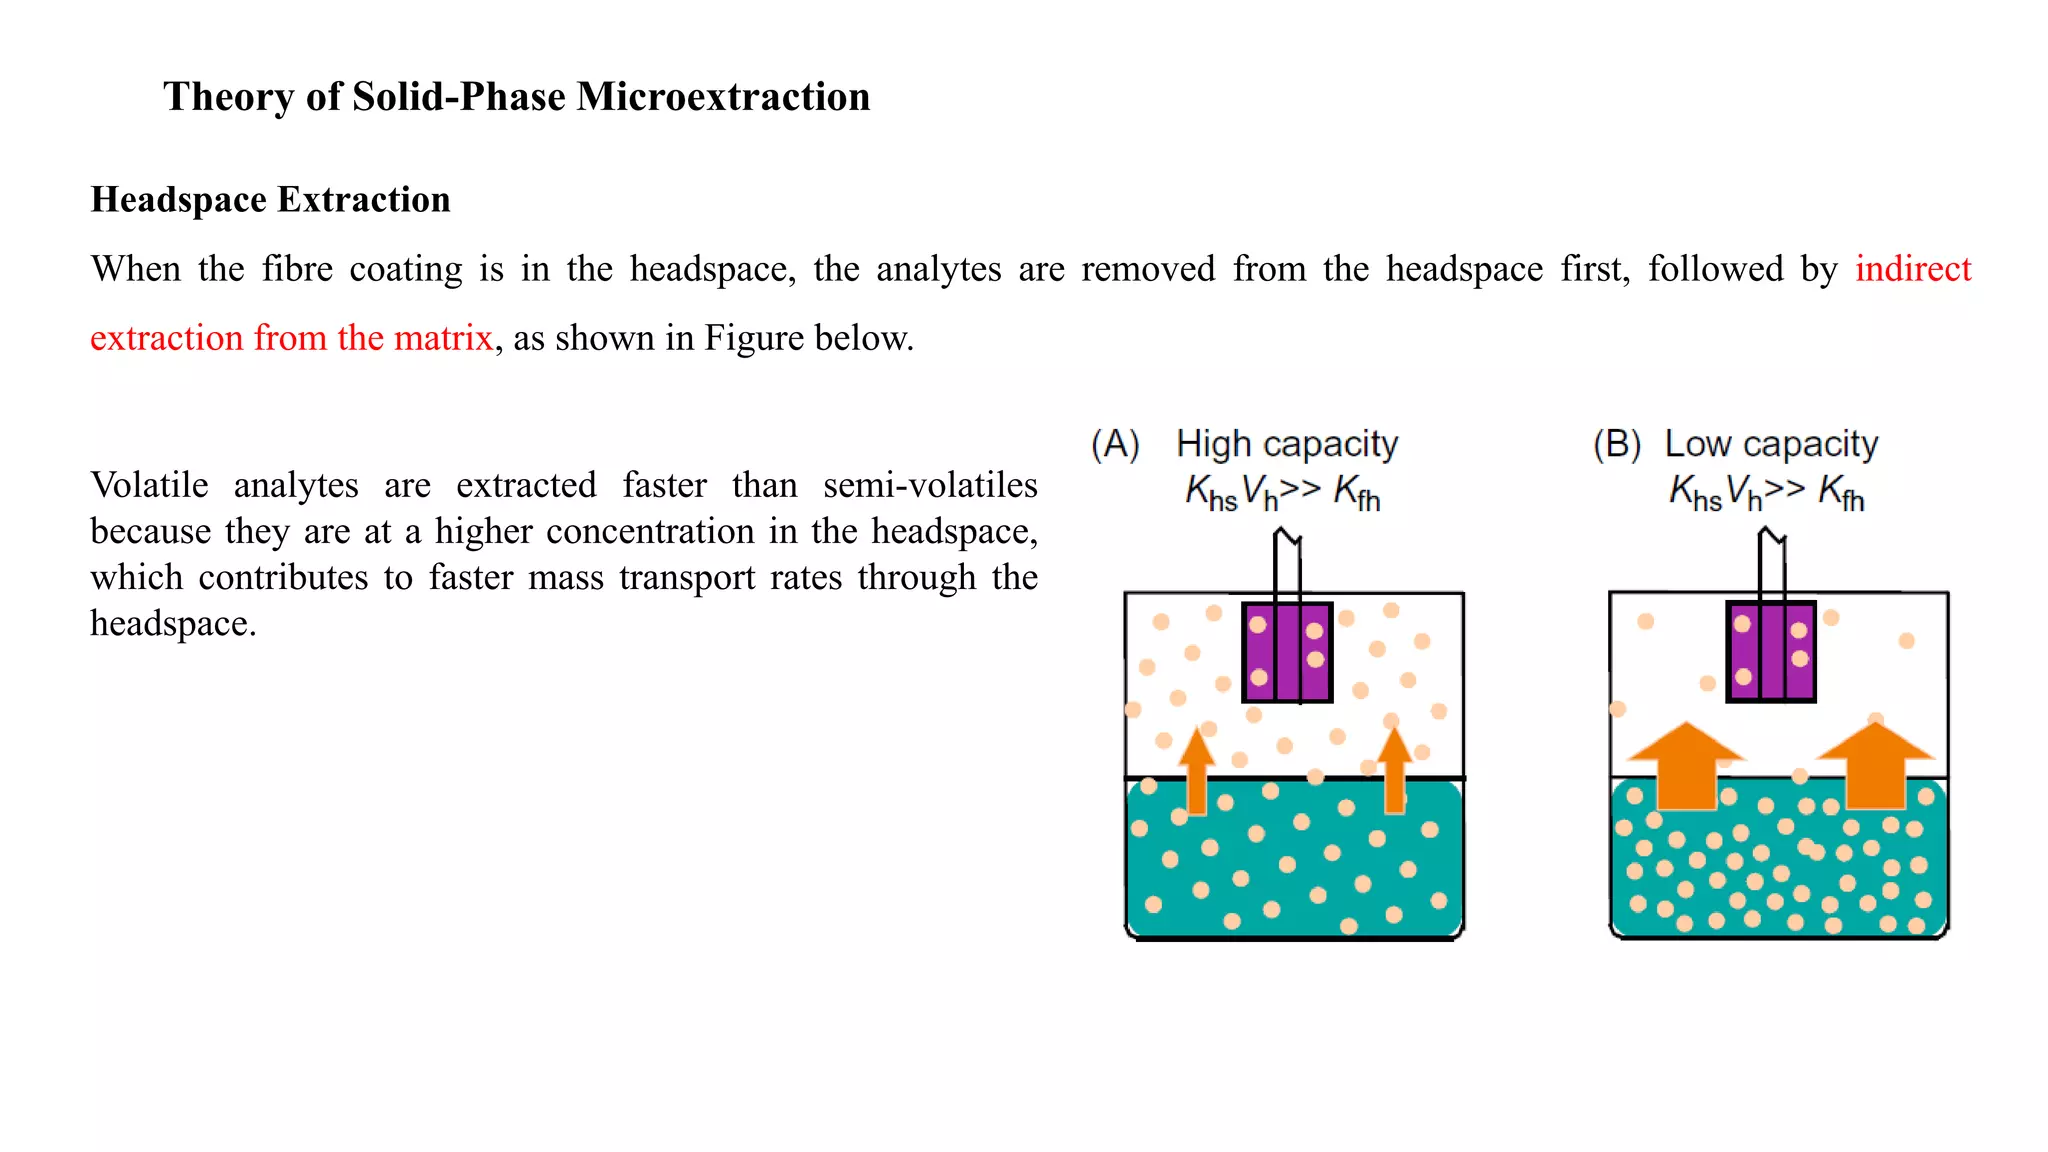
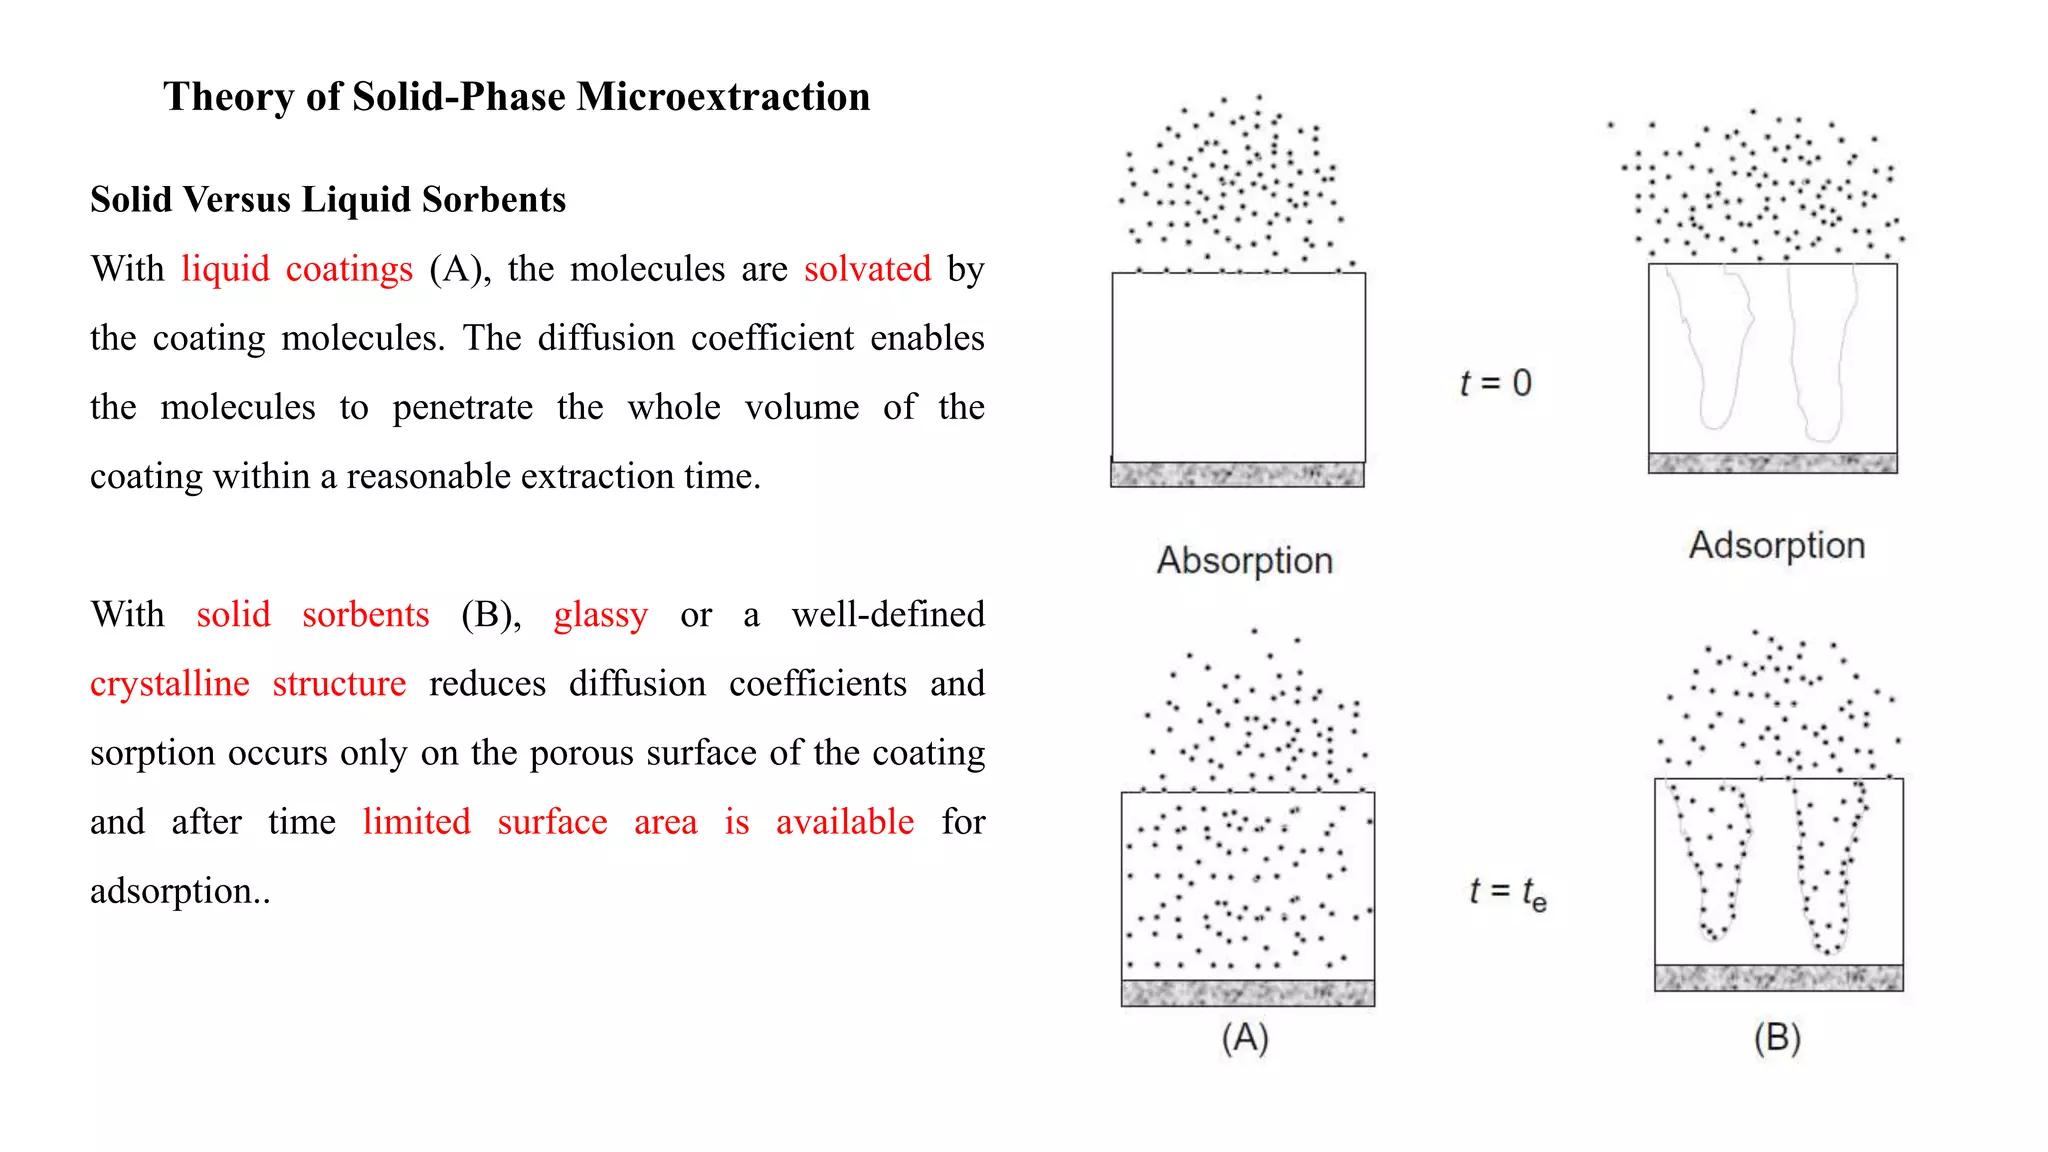


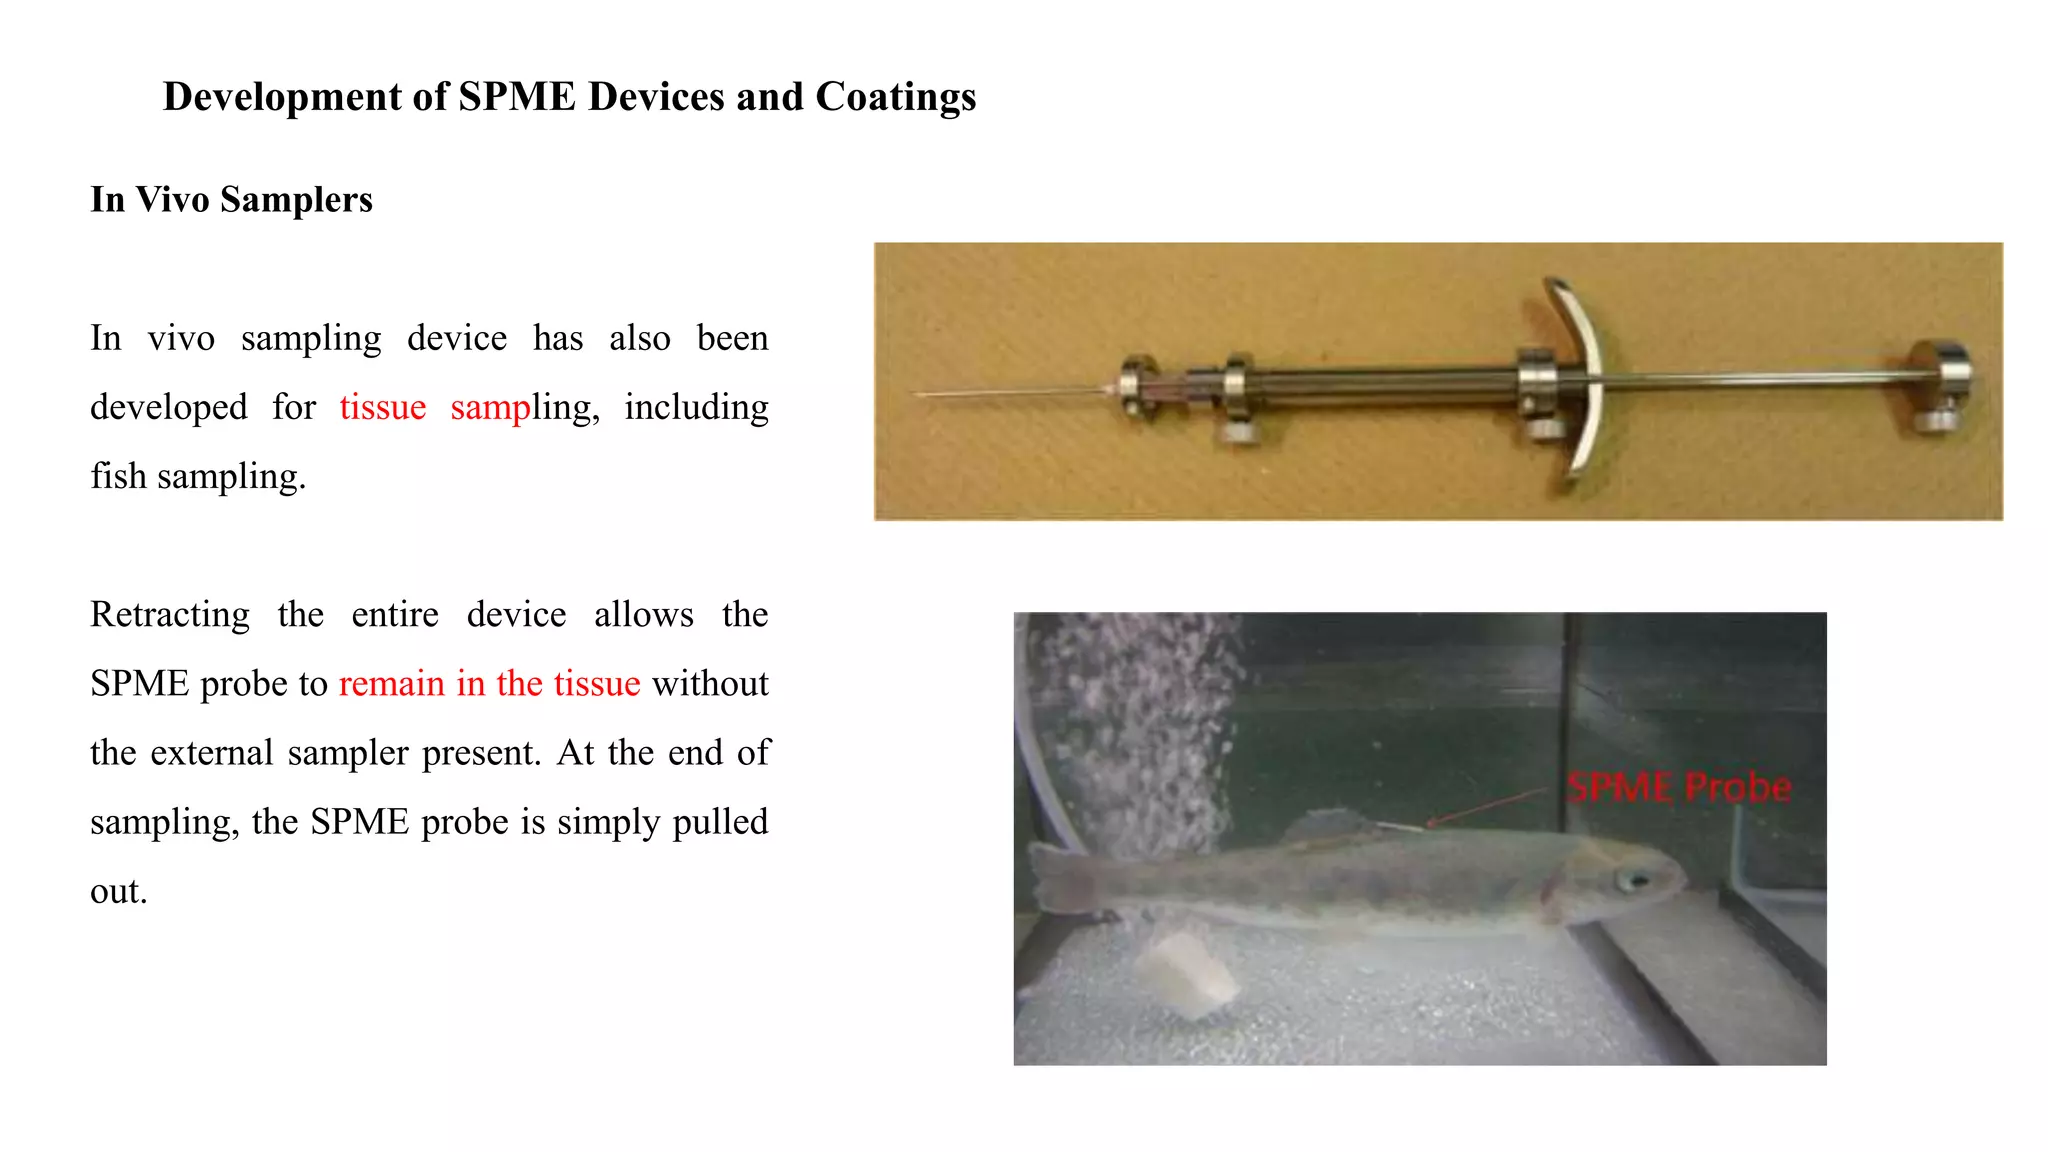
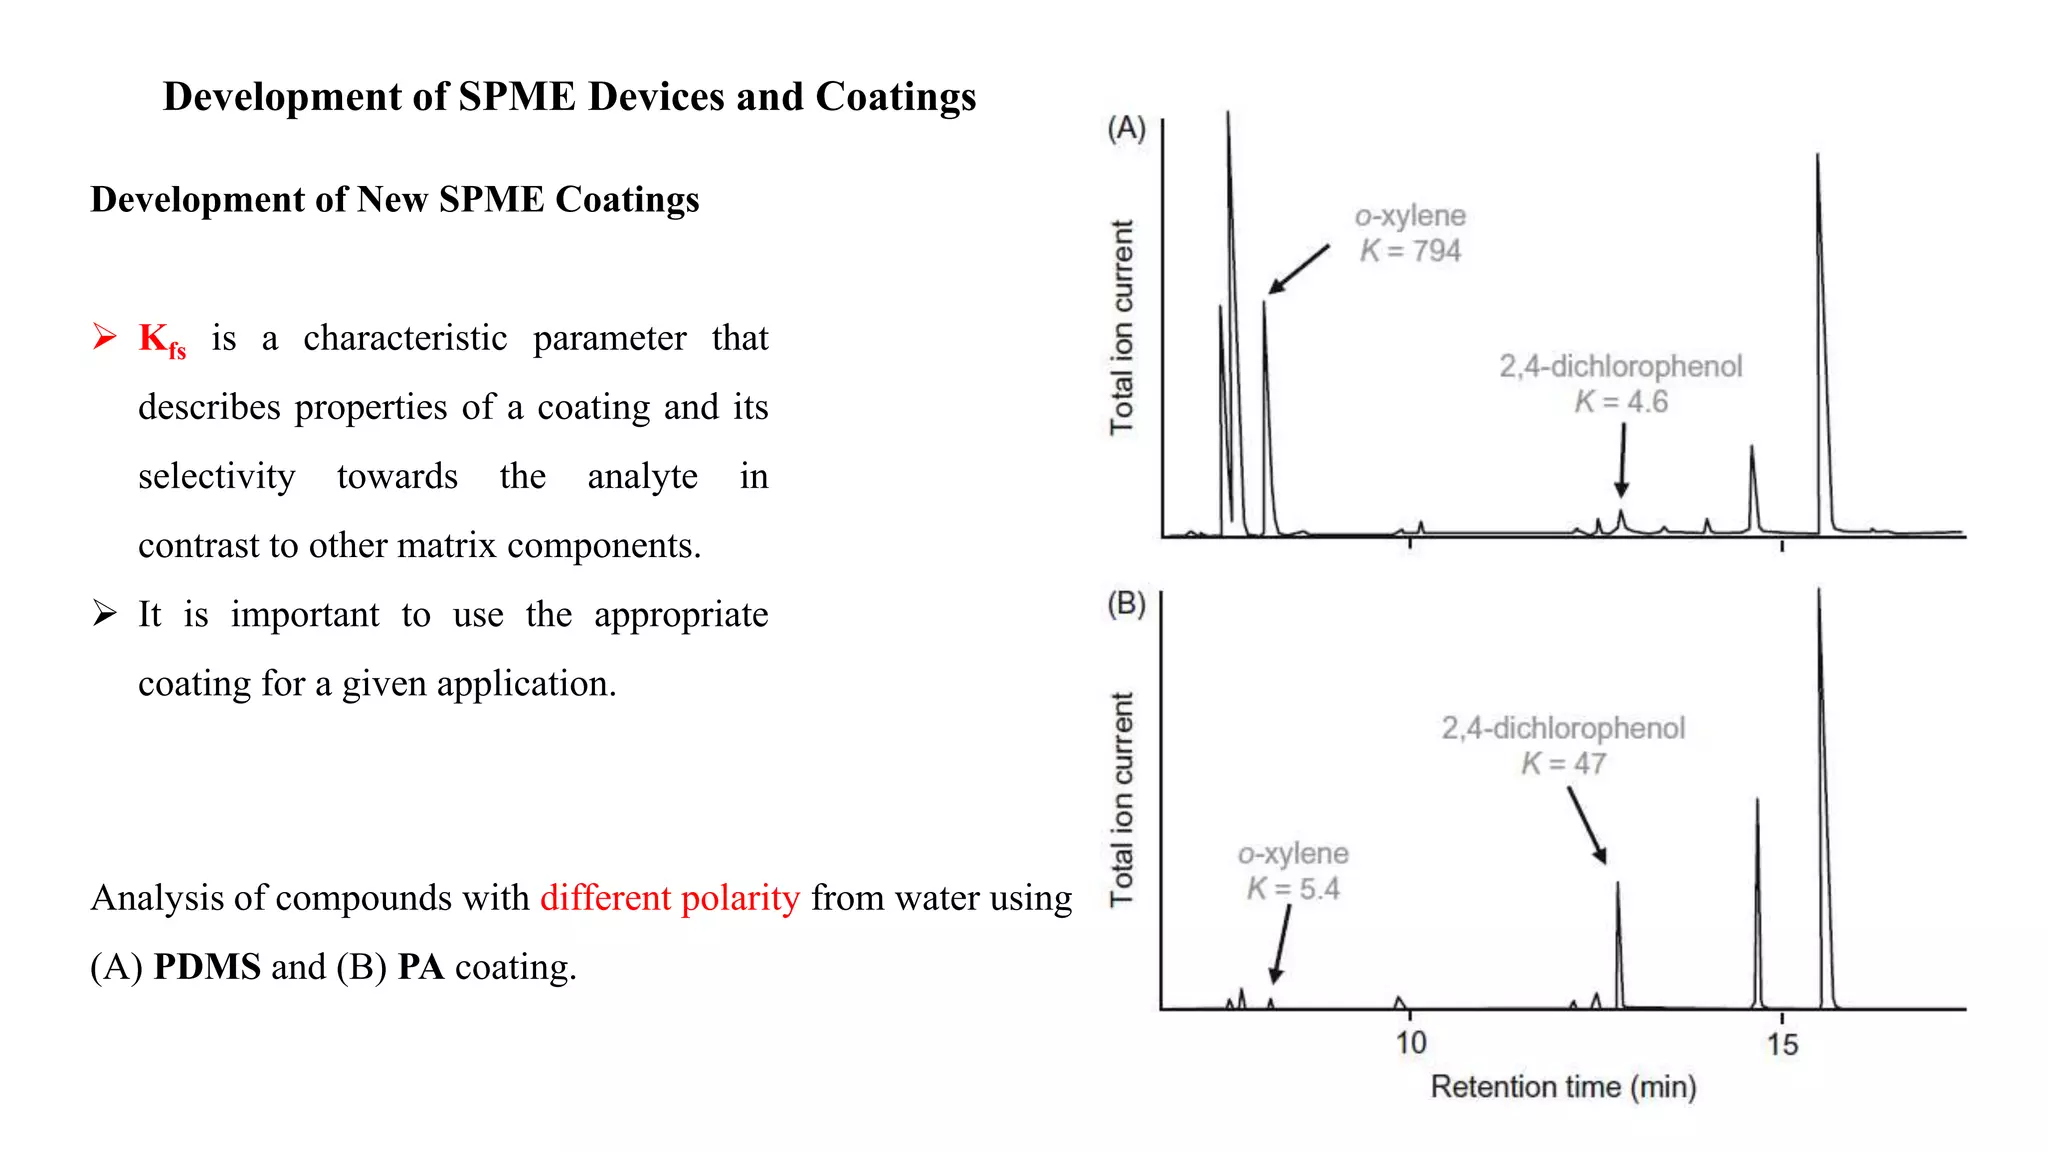


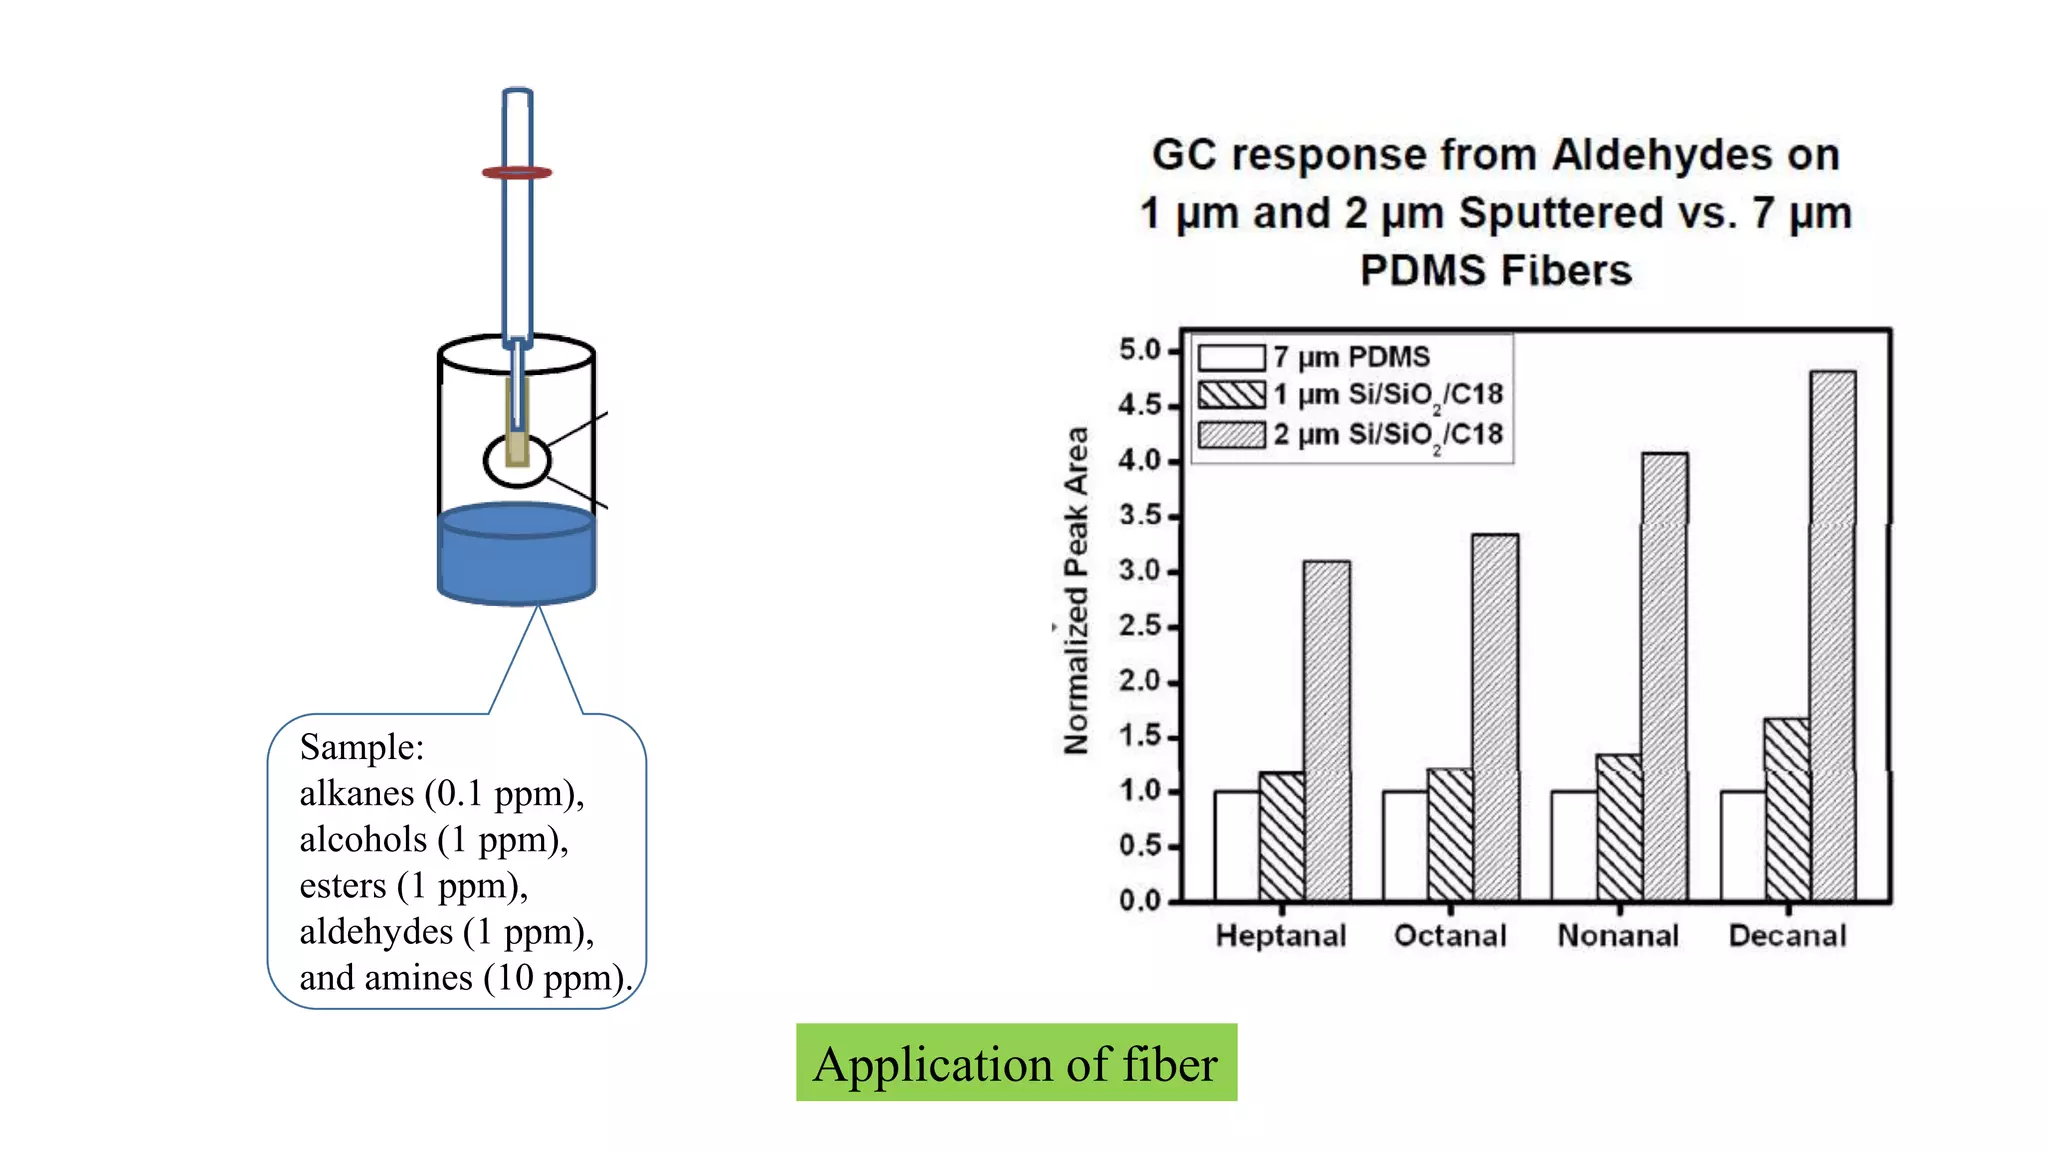
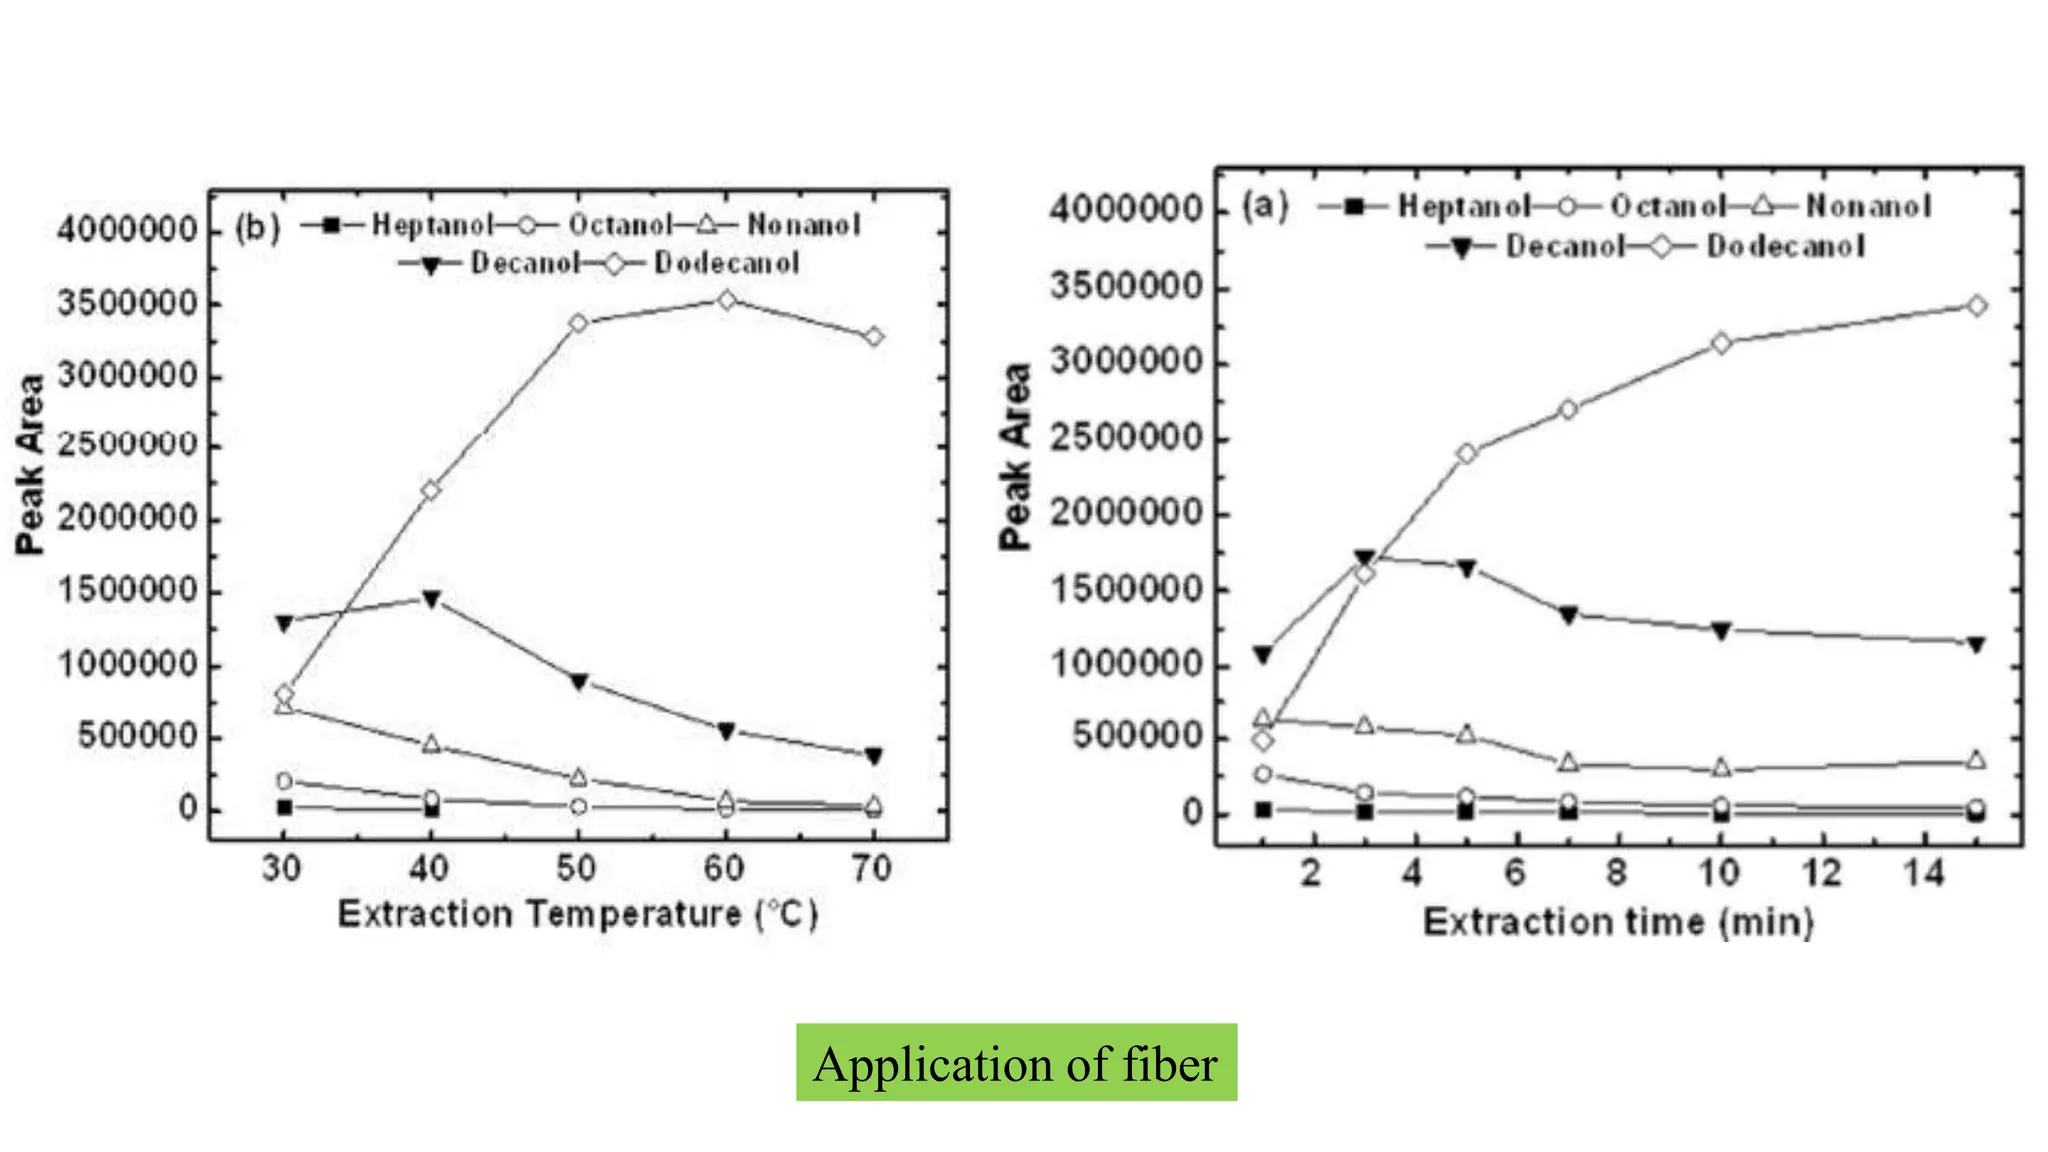
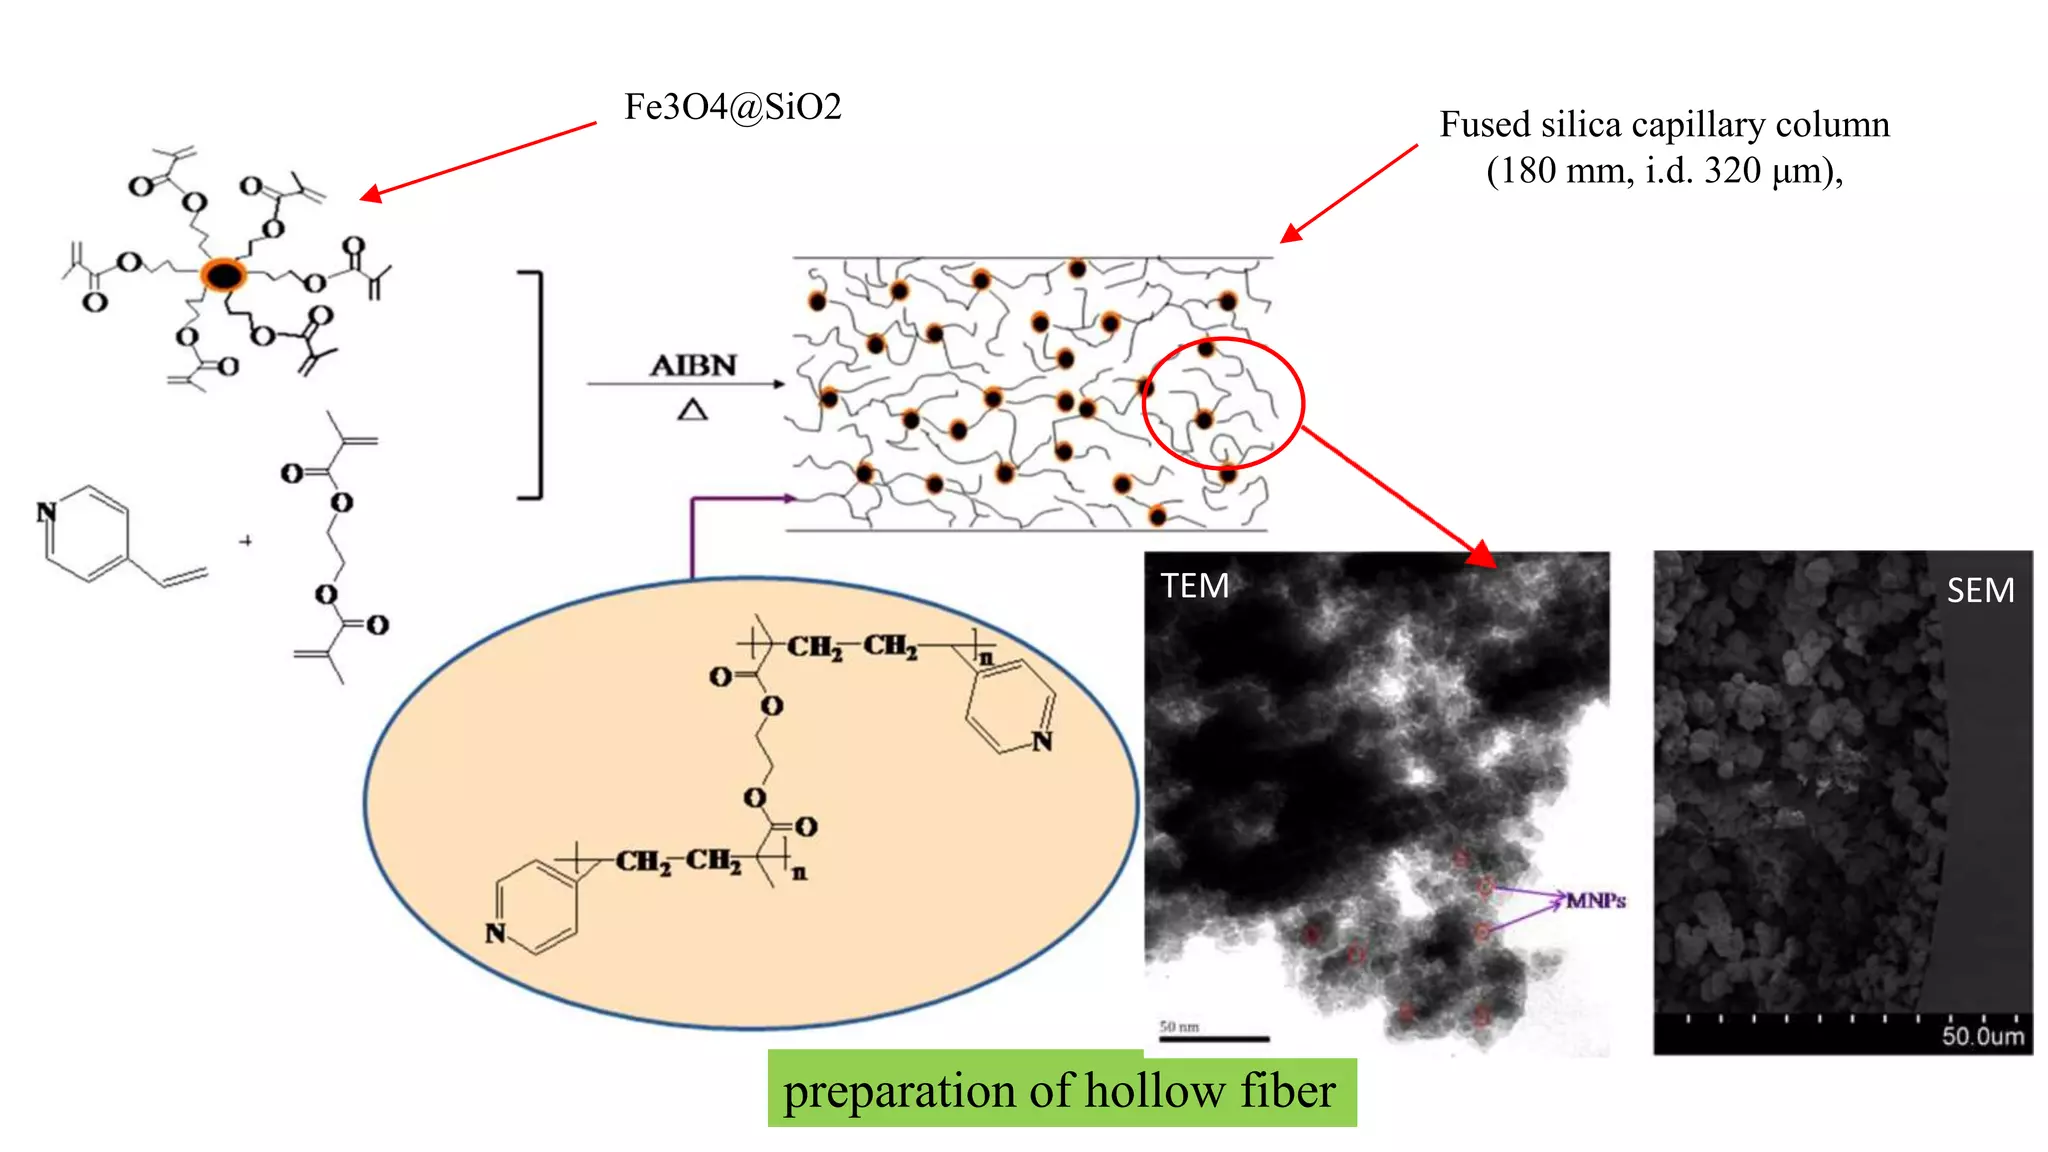


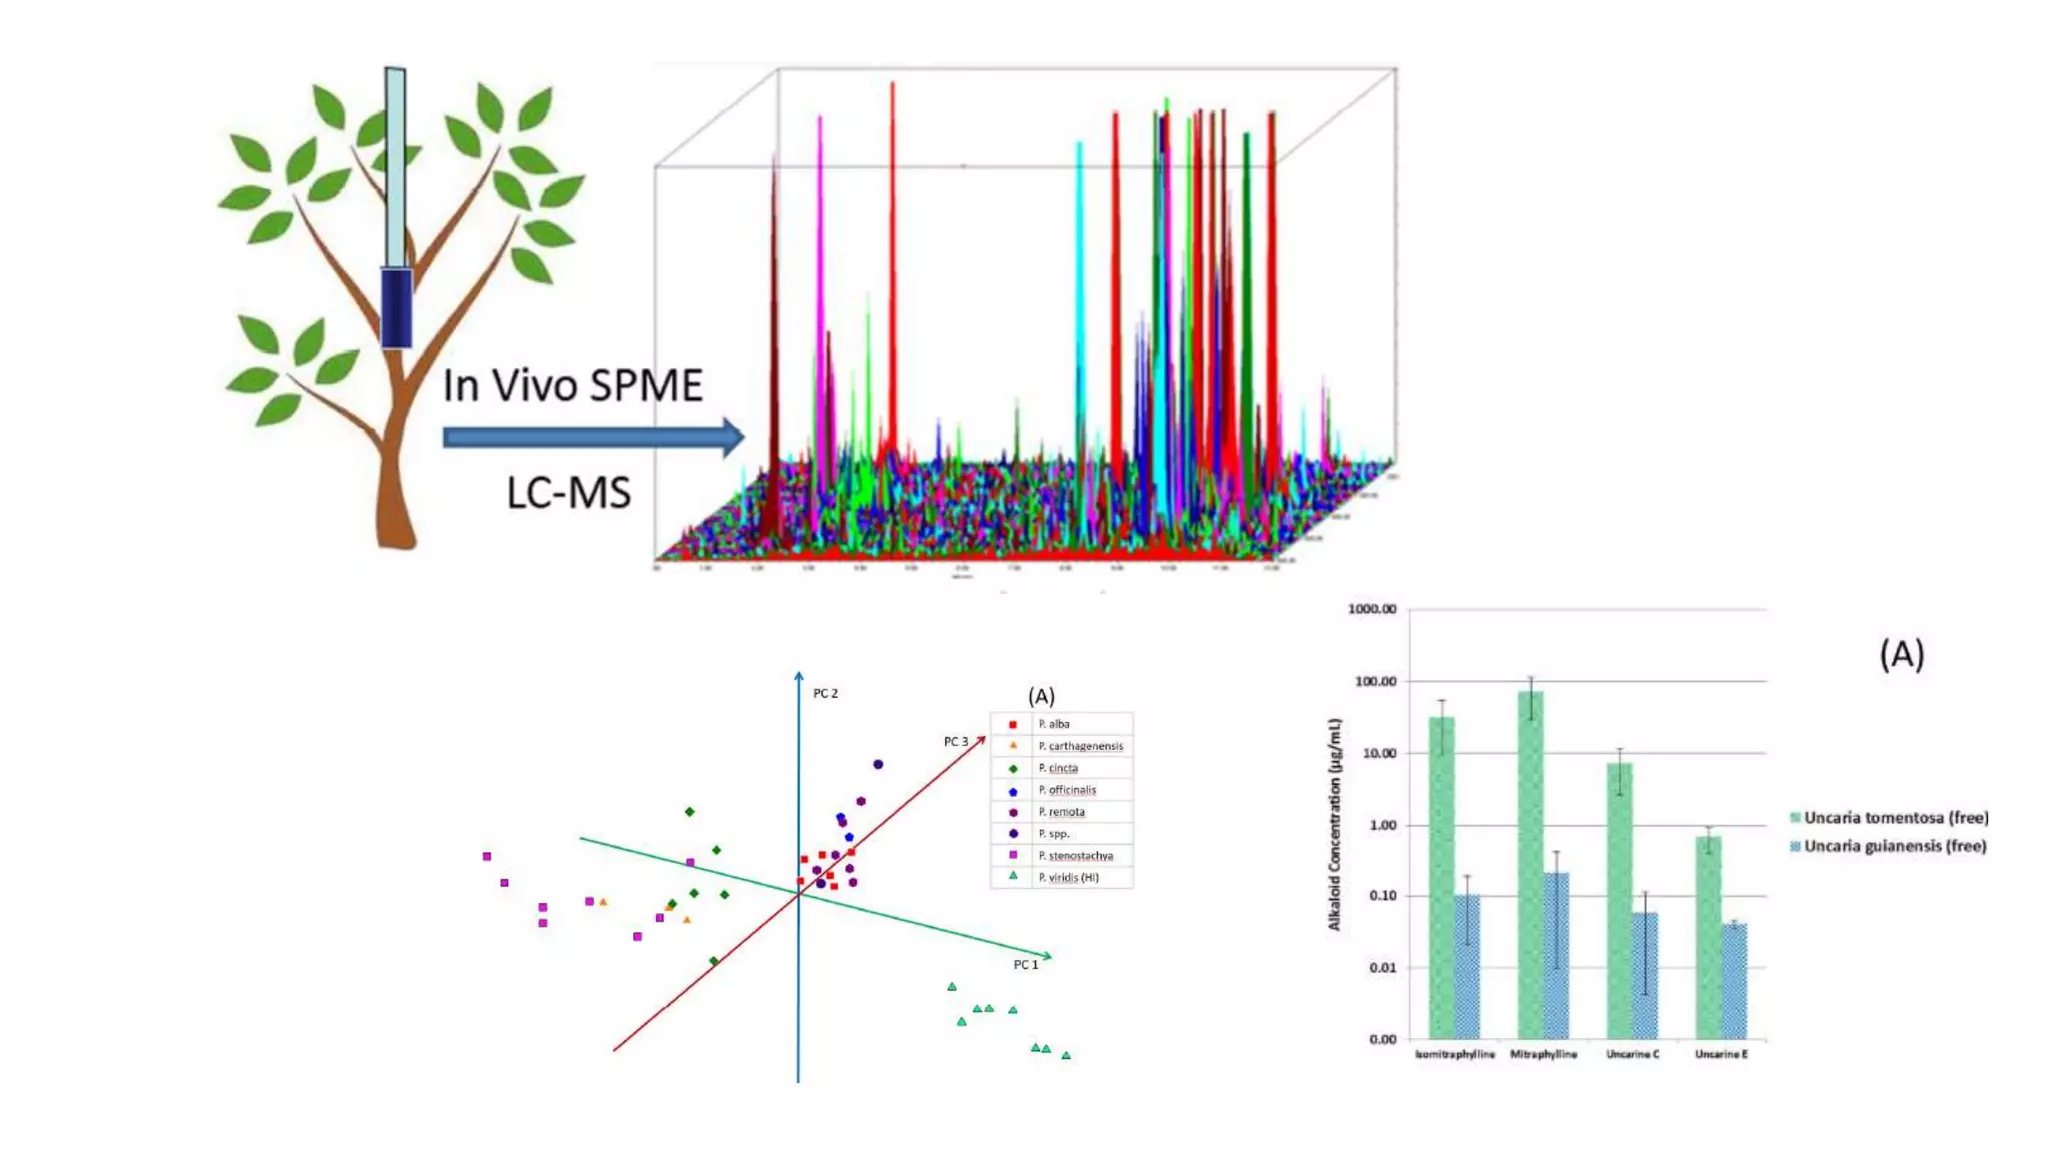


Solid phase microextraction (SPME) was invented in 1990. It is a non-exhaustive microextraction technique that involves the extraction of analytes from a sample onto a coated fused silica fiber. There are three main extraction modes: direct extraction, headspace extraction, and membrane-protected extraction. The amount of analyte extracted reaches equilibrium based on the distribution constant between the sample matrix and fiber coating. Various parameters can affect extraction, including temperature, pH, salinity, and polarity. SPME devices have been developed using coated fibers mounted on syringes or thin films for higher surface area. A variety of coatings have also been developed for different analyte classes and applications such as in vivo sampling.


![GAS CHROMATOGRAPHY-MASS SPECTROSCOPY [GC-MS]](https://cdn.slidesharecdn.com/ss_thumbnails/42-191218144856-thumbnail.jpg?width=640&height=640&fit=bounds)


