Downloaded 12 times


![Evolution of Practical LC and SPE
• Commercialization of LC efforts by J. Waters in the 1960s
• Led to pumps, injection systems, & silica sorbent particles in the 1970s
• Silica sorbent development led to SPE (syringe tube) in 1970s
• Development of HPLC closely followed teachings of van
Deemter* & Giddings** (1970s – 2000s)
• Development of HPLC closely followed teachings of van
Deemter* & Giddings** (1970s – 2000s) [accurate flow & small particles]
• SPE development did not follow these teachings since it is not
isocratic (Required assumption to derive chromatography equations)isocratic (Required assumption to derive chromatography equations)
• Later, van Deemter & Giddings teachings were applied to
gradient LC separations and shown to apply***gradient LC separations and shown to apply***
• Until now, single use SPE devices haven’t followed these
teachings, particularly importance of carefully controlled flow
*JJ van Deemter , FJ Zuiderweg, A Klinkenberg, Chem. Eng. Sc., 1956, 5, 271–289
**JC Giddings, Dynamics of Chromatography: Principles and Theory, CRC Press, 1965
*** UD Neue, HPLC Columns: Theory, Technology, and Practice, Wiley, 1997, p77](https://image.slidesharecdn.com/useofautomationtoachievehighperformancesolidphaseextraction-170209171158/85/Use-of-automation-to-achieve-high-performance-solid-phase-extraction-5-320.jpg)

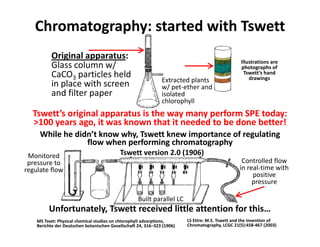
![How to plot a van Deemter curve for SPE
• Conventional measures of SPE (recovery) differ from conventional
measures of GC and LC (retention time & peak width [2σ])
• Yet the processes are same* & van Deemter equation is a• Yet the processes are same* & van Deemter equation is a
variance (σ2) equation
• Use of computerized chromatography data to evaluate separation
performance offers simple view of relative nature of σ & how toperformance offers simple view of relative nature of σ & how to
address SPE data**
• %Recovery measures deviation (σ) like LC peak width & thus,
(100% - measured %Recovery)2 is a measure of variance (σ2)(100% - measured %Recovery)2 is a measure of variance (σ2)
Hence, plotting (100% - measured %Recovery)2 vs. flow should
yield typical van Deemter curve shape if chromatographicyield typical van Deemter curve shape if chromatographic
processes govern dispersion of molecules in SPE
*Giddings, JC, Unified Separation Science, Wiley 1991, p 92-101 (diffusion, adsorption [or not], & desorption [or delayed]), the
random walk model applies)random walk model applies)
**Neue, UD, HPLC Columns: Theory, Technology, and Practice, Wiley, 1997, p12-13 (%RSD method for plate height calculation)](https://image.slidesharecdn.com/useofautomationtoachievehighperformancesolidphaseextraction-170209171158/85/Use-of-automation-to-achieve-high-performance-solid-phase-extraction-16-320.jpg)
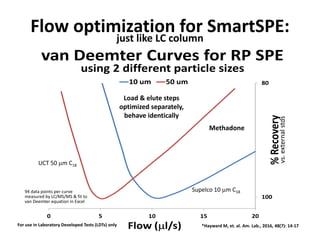
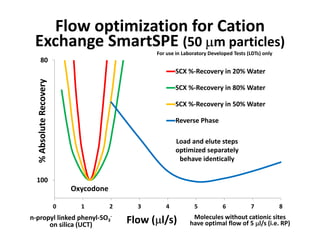
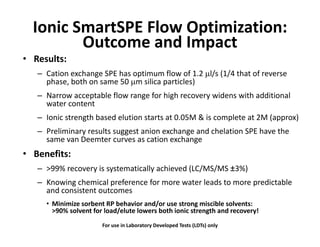
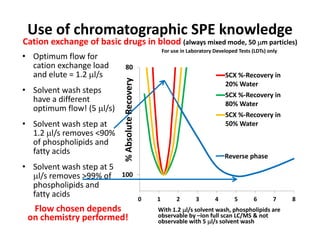


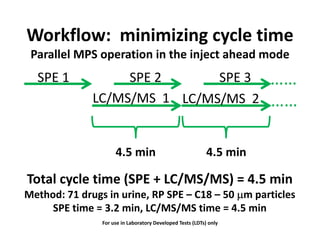
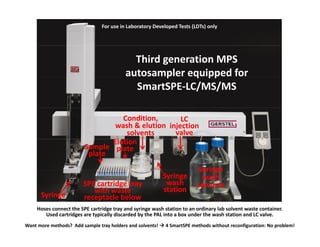
1) Automating solid phase extraction using a syringe pump to carefully control flow results in high performance SPE that behaves like liquid chromatography. 2) Testing showed that optimizing flow rate using packed sorbents in automated SPE cartridges produced van Deemter curves, demonstrating that SPE follows the same chromatographic principles as HPLC. 3) Carefully controlling flow led to over 99% absolute recovery for analytes, showing that automated SPE can achieve the same high performance as HPLC when following chromatographic fundamentals.


