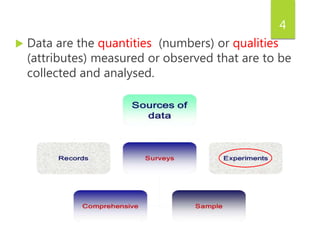
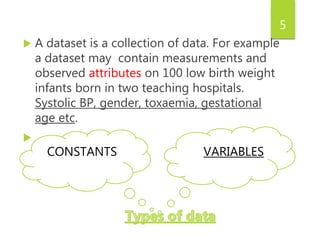
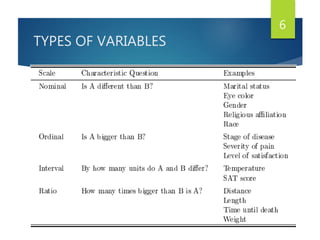
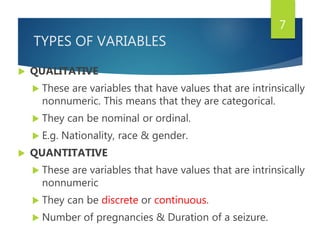
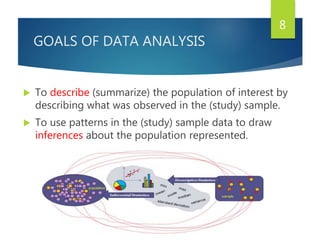
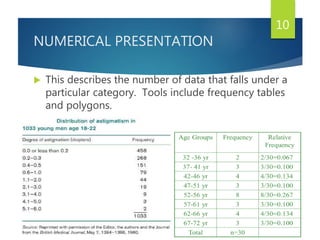
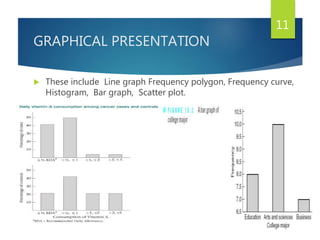
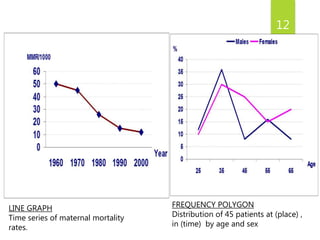
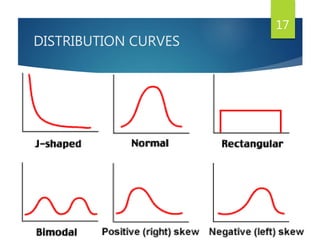
BIOSTATISTICS AND
DATA ANALYSIS
BY DAVID O. ENOMA.
1
DEFINITIONS
 Biostatistics is the branch of applied statistics
directed toward applications in the health
sciences and biology.
 Biostatistics is sometimes distinguished from the
field of biometry based up on whether
applications are in the health sciences (bio
statistics) or in broader biology (biometry) e.g
agriculture, ecology, wildlife biology.
2
FUNDAMENTAL TOOLS OF THE
SCIENTIFIC METHOD
 Hypothesis Formulation
 Experimental design and observational
studies
 Data gathering
 Data summarization/representation
 Drawing inferences
3
4
 Data are the quantities (numbers) or qualities
(attributes) measured or observed that are to be
collected and analysed.
5
 A dataset is a collection of data. For example
a dataset may contain measurements and
observed attributes on 100 low birth weight
infants born in two teaching hospitals.
Systolic BP, gender, toxaemia, gestational
age etc.

CONSTANTS VARIABLES
TYPES OF VARIABLES
6
TYPES OF VARIABLES
 QUALITATIVE
 These are variables that have values that are intrinsically
nonnumeric. This means that they are categorical.
 They can be nominal or ordinal.
 E.g. Nationality, race & gender.
 QUANTITATIVE
 These are variables that have values that are intrinsically
nonnumeric
 They can be discrete or continuous.
 Number of pregnancies & Duration of a seizure.
7
GOALS OF DATA ANALYSIS
 To describe (summarize) the population of interest by
describing what was observed in the (study) sample.
 To use patterns in the (study) sample data to draw
inferences about the population represented.
8
DESCRIPTIVE STATISTICS
 Descriptive statistics are concerned with the
presentation, organization and summarization
of data.(Norman & Streiner, 2008)
 In simple terms, describing data.
Numerical presentation
Graphical presentation
Mathematical presentation
9
NUMERICAL PRESENTATION
 This describes the number of data that falls under a
particular category. Tools include frequency tables
and polygons.
10
GRAPHICAL PRESENTATION
 These include Line graph Frequency polygon, Frequency curve,
Histogram, Bar graph, Scatter plot.
11
12
LINE GRAPH
Time series of maternal mortality
rates.
FREQUENCY POLYGON
Distribution of 45 patients at (place) ,
in (time) by age and sex
MATHEMATICAL PRESENTATION
 Mathematical presentation is also referred to as summary statistics.
 MEASURE OF LOCATION
 This type of measure is useful for summarizing date and it defines
the centre or middle of the sample values. (Rosner, 2010).
 Mean, Median and Mode. (central tendency).
 Quartiles and percentiles. (no central tendency).
 MEASURES OF SPREAD
 This measures the degree of variability in the data.
 Variance, Standard Deviation, Standard Error of the mean .
13
14
2 i=1
n
i
2
s =
(x - x)
n -1

15
S = standard deviation (square root of variance)
Empirical Rule
 For a Normal distribution approximately,
 68% of the measurements fall within one standard
deviation around the mean
 95% of the measurements fall within two standard
deviations around the mean
 99.7% of the measurements fall within three
standard deviations around the mean
16
DISTRIBUTION CURVES
17
INFERENTIAL STATISTICS
 Inferential statistics allow us to generalize from our
sample of data to a larger group of subjects.
 Accuracy of inference depends on
representativeness of sample from population
 Inferential Statistics uses sample data to evaluate
the credibility of a hypothesis about a population
 Calculation of mean difference.
18
STEPS IN INFERENTIAL
STATISTICS
 State Hypothesis
Ho: No difference between 2 means; any
difference found is due to sampling error
 Level of Significance
level of probability or level of confidence
Probability that sample means are different
enough to reject Ho (.05 or .01)
19
 Computing calculated value used for testing for mean differences.
20
THANK YOU.
21
REFERENCES
 Norman, G. R., & Streiner, D. L. (2008). Biostatistics: The
Bare Essentials: B.C. Decker.
 Rosner, B. (2010). Fundamentals of Biostatistics: Cengage
Learning.
22

Biostatistics and data analysis

  • 1.
  • 2.
    DEFINITIONS  Biostatistics isthe branch of applied statistics directed toward applications in the health sciences and biology.  Biostatistics is sometimes distinguished from the field of biometry based up on whether applications are in the health sciences (bio statistics) or in broader biology (biometry) e.g agriculture, ecology, wildlife biology. 2
  • 3.
    FUNDAMENTAL TOOLS OFTHE SCIENTIFIC METHOD  Hypothesis Formulation  Experimental design and observational studies  Data gathering  Data summarization/representation  Drawing inferences 3
  • 4.
    4  Data arethe quantities (numbers) or qualities (attributes) measured or observed that are to be collected and analysed.
  • 5.
    5  A datasetis a collection of data. For example a dataset may contain measurements and observed attributes on 100 low birth weight infants born in two teaching hospitals. Systolic BP, gender, toxaemia, gestational age etc.  CONSTANTS VARIABLES
  • 6.
  • 7.
    TYPES OF VARIABLES QUALITATIVE  These are variables that have values that are intrinsically nonnumeric. This means that they are categorical.  They can be nominal or ordinal.  E.g. Nationality, race & gender.  QUANTITATIVE  These are variables that have values that are intrinsically nonnumeric  They can be discrete or continuous.  Number of pregnancies & Duration of a seizure. 7
  • 8.
    GOALS OF DATAANALYSIS  To describe (summarize) the population of interest by describing what was observed in the (study) sample.  To use patterns in the (study) sample data to draw inferences about the population represented. 8
  • 9.
    DESCRIPTIVE STATISTICS  Descriptivestatistics are concerned with the presentation, organization and summarization of data.(Norman & Streiner, 2008)  In simple terms, describing data. Numerical presentation Graphical presentation Mathematical presentation 9
  • 10.
    NUMERICAL PRESENTATION  Thisdescribes the number of data that falls under a particular category. Tools include frequency tables and polygons. 10
  • 11.
    GRAPHICAL PRESENTATION  Theseinclude Line graph Frequency polygon, Frequency curve, Histogram, Bar graph, Scatter plot. 11
  • 12.
    12 LINE GRAPH Time seriesof maternal mortality rates. FREQUENCY POLYGON Distribution of 45 patients at (place) , in (time) by age and sex
  • 13.
    MATHEMATICAL PRESENTATION  Mathematicalpresentation is also referred to as summary statistics.  MEASURE OF LOCATION  This type of measure is useful for summarizing date and it defines the centre or middle of the sample values. (Rosner, 2010).  Mean, Median and Mode. (central tendency).  Quartiles and percentiles. (no central tendency).  MEASURES OF SPREAD  This measures the degree of variability in the data.  Variance, Standard Deviation, Standard Error of the mean . 13
  • 14.
  • 15.
    2 i=1 n i 2 s = (x- x) n -1  15 S = standard deviation (square root of variance)
  • 16.
    Empirical Rule  Fora Normal distribution approximately,  68% of the measurements fall within one standard deviation around the mean  95% of the measurements fall within two standard deviations around the mean  99.7% of the measurements fall within three standard deviations around the mean 16
  • 17.
  • 18.
    INFERENTIAL STATISTICS  Inferentialstatistics allow us to generalize from our sample of data to a larger group of subjects.  Accuracy of inference depends on representativeness of sample from population  Inferential Statistics uses sample data to evaluate the credibility of a hypothesis about a population  Calculation of mean difference. 18
  • 19.
    STEPS IN INFERENTIAL STATISTICS State Hypothesis Ho: No difference between 2 means; any difference found is due to sampling error  Level of Significance level of probability or level of confidence Probability that sample means are different enough to reject Ho (.05 or .01) 19
  • 20.
     Computing calculatedvalue used for testing for mean differences. 20
  • 21.
  • 22.
    REFERENCES  Norman, G.R., & Streiner, D. L. (2008). Biostatistics: The Bare Essentials: B.C. Decker.  Rosner, B. (2010). Fundamentals of Biostatistics: Cengage Learning. 22