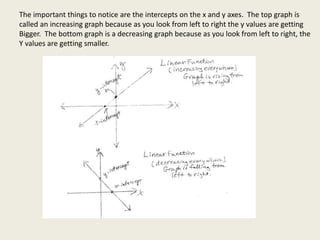
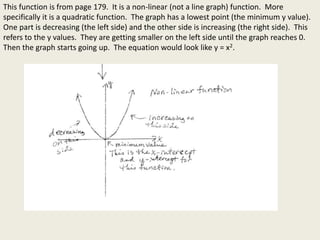
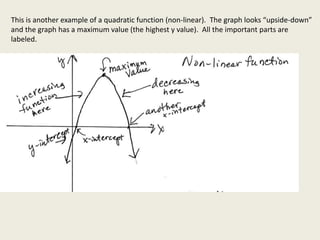
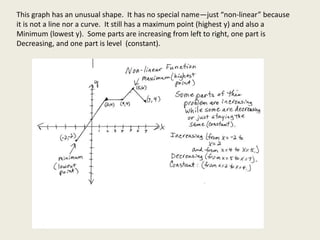
Skill 34 Features of Linear and Quadratic Functions Use Pages 179, 180
in your book.
In this lesson, we will look at features of linear and quadratic functions and also
some functions that are just connected pieces.
Linear Functions and features These are the y = mx + b forms. The x is raised just
to the first power (no squares). See the next slide for a look at the features of the
Functions.
Quadratic Functions –These are the y =ax2+ b x + c type where there is a
squared term. These functions have either a minimum point or a maximum point.
Other “non-linear” functions have graphs that are just connected points or curves
that pass the vertical line test to be a function. They may also have maximum or
minimum points. They can have parts that are increasing or decreasing or
constant (not changing) when looking at the y values.
The important things to notice are the intercepts on the x and y axes. The top graph is
called an increasing graph because as you look from left to right the y values are getting
Bigger. The bottom graph is a decreasing graph because as you look from left to right, the
Y values are getting smaller.
This function is from page 179. It is a non-linear (not a line graph) function. More
specifically it is a quadratic function. The graph has a lowest point (the minimum y value).
One part is decreasing (the left side) and the other side is increasing (the right side). This
refers to the y values. They are getting smaller on the left side until the graph reaches 0.
Then the graph starts going up. The equation would look like y = x2.
This is another example of a quadratic function (non-linear). The graph looks “upside-down”
and the graph has a maximum value (the highest y value). All the important parts are
labeled.
This graph has an unusual shape. It has no special name—just “non-linear” because
it is not a line nor a curve. It still has a maximum point (highest y) and also a
Minimum (lowest y). Some parts are increasing from left to right, one part is
Decreasing, and one part is level (constant).
Skill34 linear quadratic multiple representation of functions

Skill34 linear quadratic multiple representation of functions

  • 1.
    Skill 34 Featuresof Linear and Quadratic Functions Use Pages 179, 180 in your book. In this lesson, we will look at features of linear and quadratic functions and also some functions that are just connected pieces. Linear Functions and features These are the y = mx + b forms. The x is raised just to the first power (no squares). See the next slide for a look at the features of the Functions. Quadratic Functions –These are the y =ax2+ b x + c type where there is a squared term. These functions have either a minimum point or a maximum point. Other “non-linear” functions have graphs that are just connected points or curves that pass the vertical line test to be a function. They may also have maximum or minimum points. They can have parts that are increasing or decreasing or constant (not changing) when looking at the y values.
  • 2.
    The important thingsto notice are the intercepts on the x and y axes. The top graph is called an increasing graph because as you look from left to right the y values are getting Bigger. The bottom graph is a decreasing graph because as you look from left to right, the Y values are getting smaller.
  • 3.
    This function isfrom page 179. It is a non-linear (not a line graph) function. More specifically it is a quadratic function. The graph has a lowest point (the minimum y value). One part is decreasing (the left side) and the other side is increasing (the right side). This refers to the y values. They are getting smaller on the left side until the graph reaches 0. Then the graph starts going up. The equation would look like y = x2.
  • 4.
    This is anotherexample of a quadratic function (non-linear). The graph looks “upside-down” and the graph has a maximum value (the highest y value). All the important parts are labeled.
  • 5.
    This graph hasan unusual shape. It has no special name—just “non-linear” because it is not a line nor a curve. It still has a maximum point (highest y) and also a Minimum (lowest y). Some parts are increasing from left to right, one part is Decreasing, and one part is level (constant).