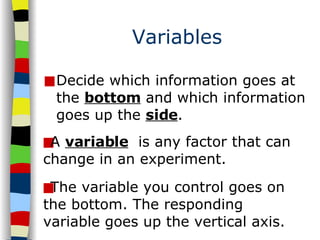
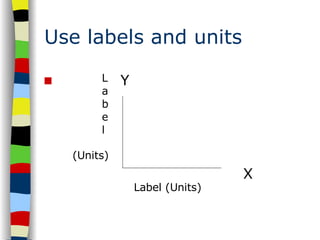
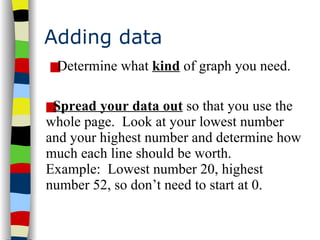
Rules for Graphing Use graph paper and indent each axis. Work in  pencil  and use a  ruler . Title the graph .
Variables Decide which information goes at the  bottom  and which information goes up the  side .  A  variable   is any factor that can change in an experiment. The variable you control goes on the bottom. The responding variable goes up the vertical axis.
The X and Y axis .The one you control is called the  independent variable  and the one that responds is called the  dependent  variable. Label the Y-axis , the vertical axis, (up and down) and place the  proper units  in parenthesis. Label the X-axis , the horizontal axis, and place the  proper units  in parenthesis.
Use labels and units The one you control is called the  independent variable  and the one that responds is called the  dependent  variable. Label the X-axis , the horizontal axis, and place the  proper units  in parenthesis. Label the Y-axis , the vertical axis, (up and down) and place the  proper units  in parenthesis.
Use labels and units X Label (Units) L a b e l (Units) Y
Adding data Spread your data out  so that you use the whole page.  Look at your lowest number and your highest number and determine how much each line should be worth.  Example:  Lowest number 20, highest number 52, so don’t need to start at 0. Determine what  kind  of graph you need.
Plotting your data Use a different color for  multiple line graphs. Make a key  to show what each colored line represents. Plot your data points  and connect your data points if using a line graph.

Graphing

  • 1.
    Rules for GraphingUse graph paper and indent each axis. Work in pencil and use a ruler . Title the graph .
  • 2.
    Variables Decide whichinformation goes at the bottom and which information goes up the side . A variable is any factor that can change in an experiment. The variable you control goes on the bottom. The responding variable goes up the vertical axis.
  • 3.
    The X andY axis .The one you control is called the independent variable and the one that responds is called the dependent variable. Label the Y-axis , the vertical axis, (up and down) and place the proper units in parenthesis. Label the X-axis , the horizontal axis, and place the proper units in parenthesis.
  • 4.
    Use labels andunits The one you control is called the independent variable and the one that responds is called the dependent variable. Label the X-axis , the horizontal axis, and place the proper units in parenthesis. Label the Y-axis , the vertical axis, (up and down) and place the proper units in parenthesis.
  • 5.
    Use labels andunits X Label (Units) L a b e l (Units) Y
  • 6.
    Adding data Spreadyour data out so that you use the whole page. Look at your lowest number and your highest number and determine how much each line should be worth. Example: Lowest number 20, highest number 52, so don’t need to start at 0. Determine what kind of graph you need.
  • 7.
    Plotting your dataUse a different color for multiple line graphs. Make a key to show what each colored line represents. Plot your data points and connect your data points if using a line graph.