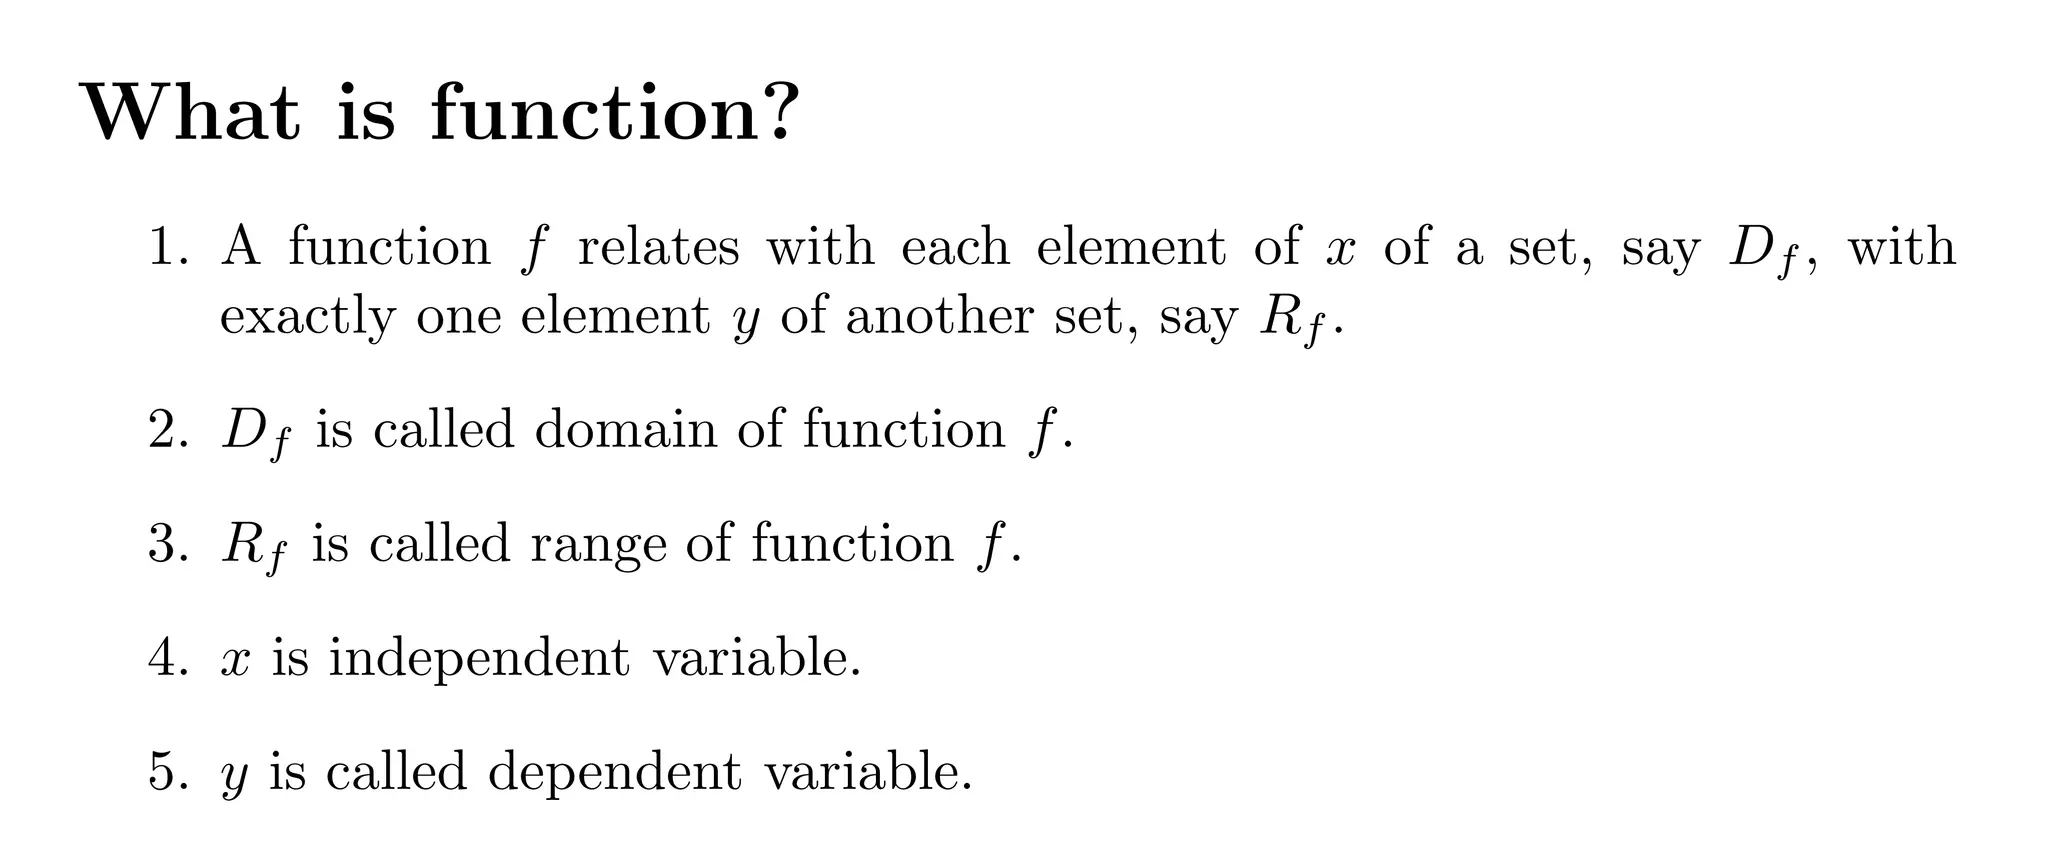
1. The document defines functions and their domains and ranges. It discusses increasing and decreasing functions, where an increasing function's values continuously rise with x and a decreasing function's values continuously fall with x.
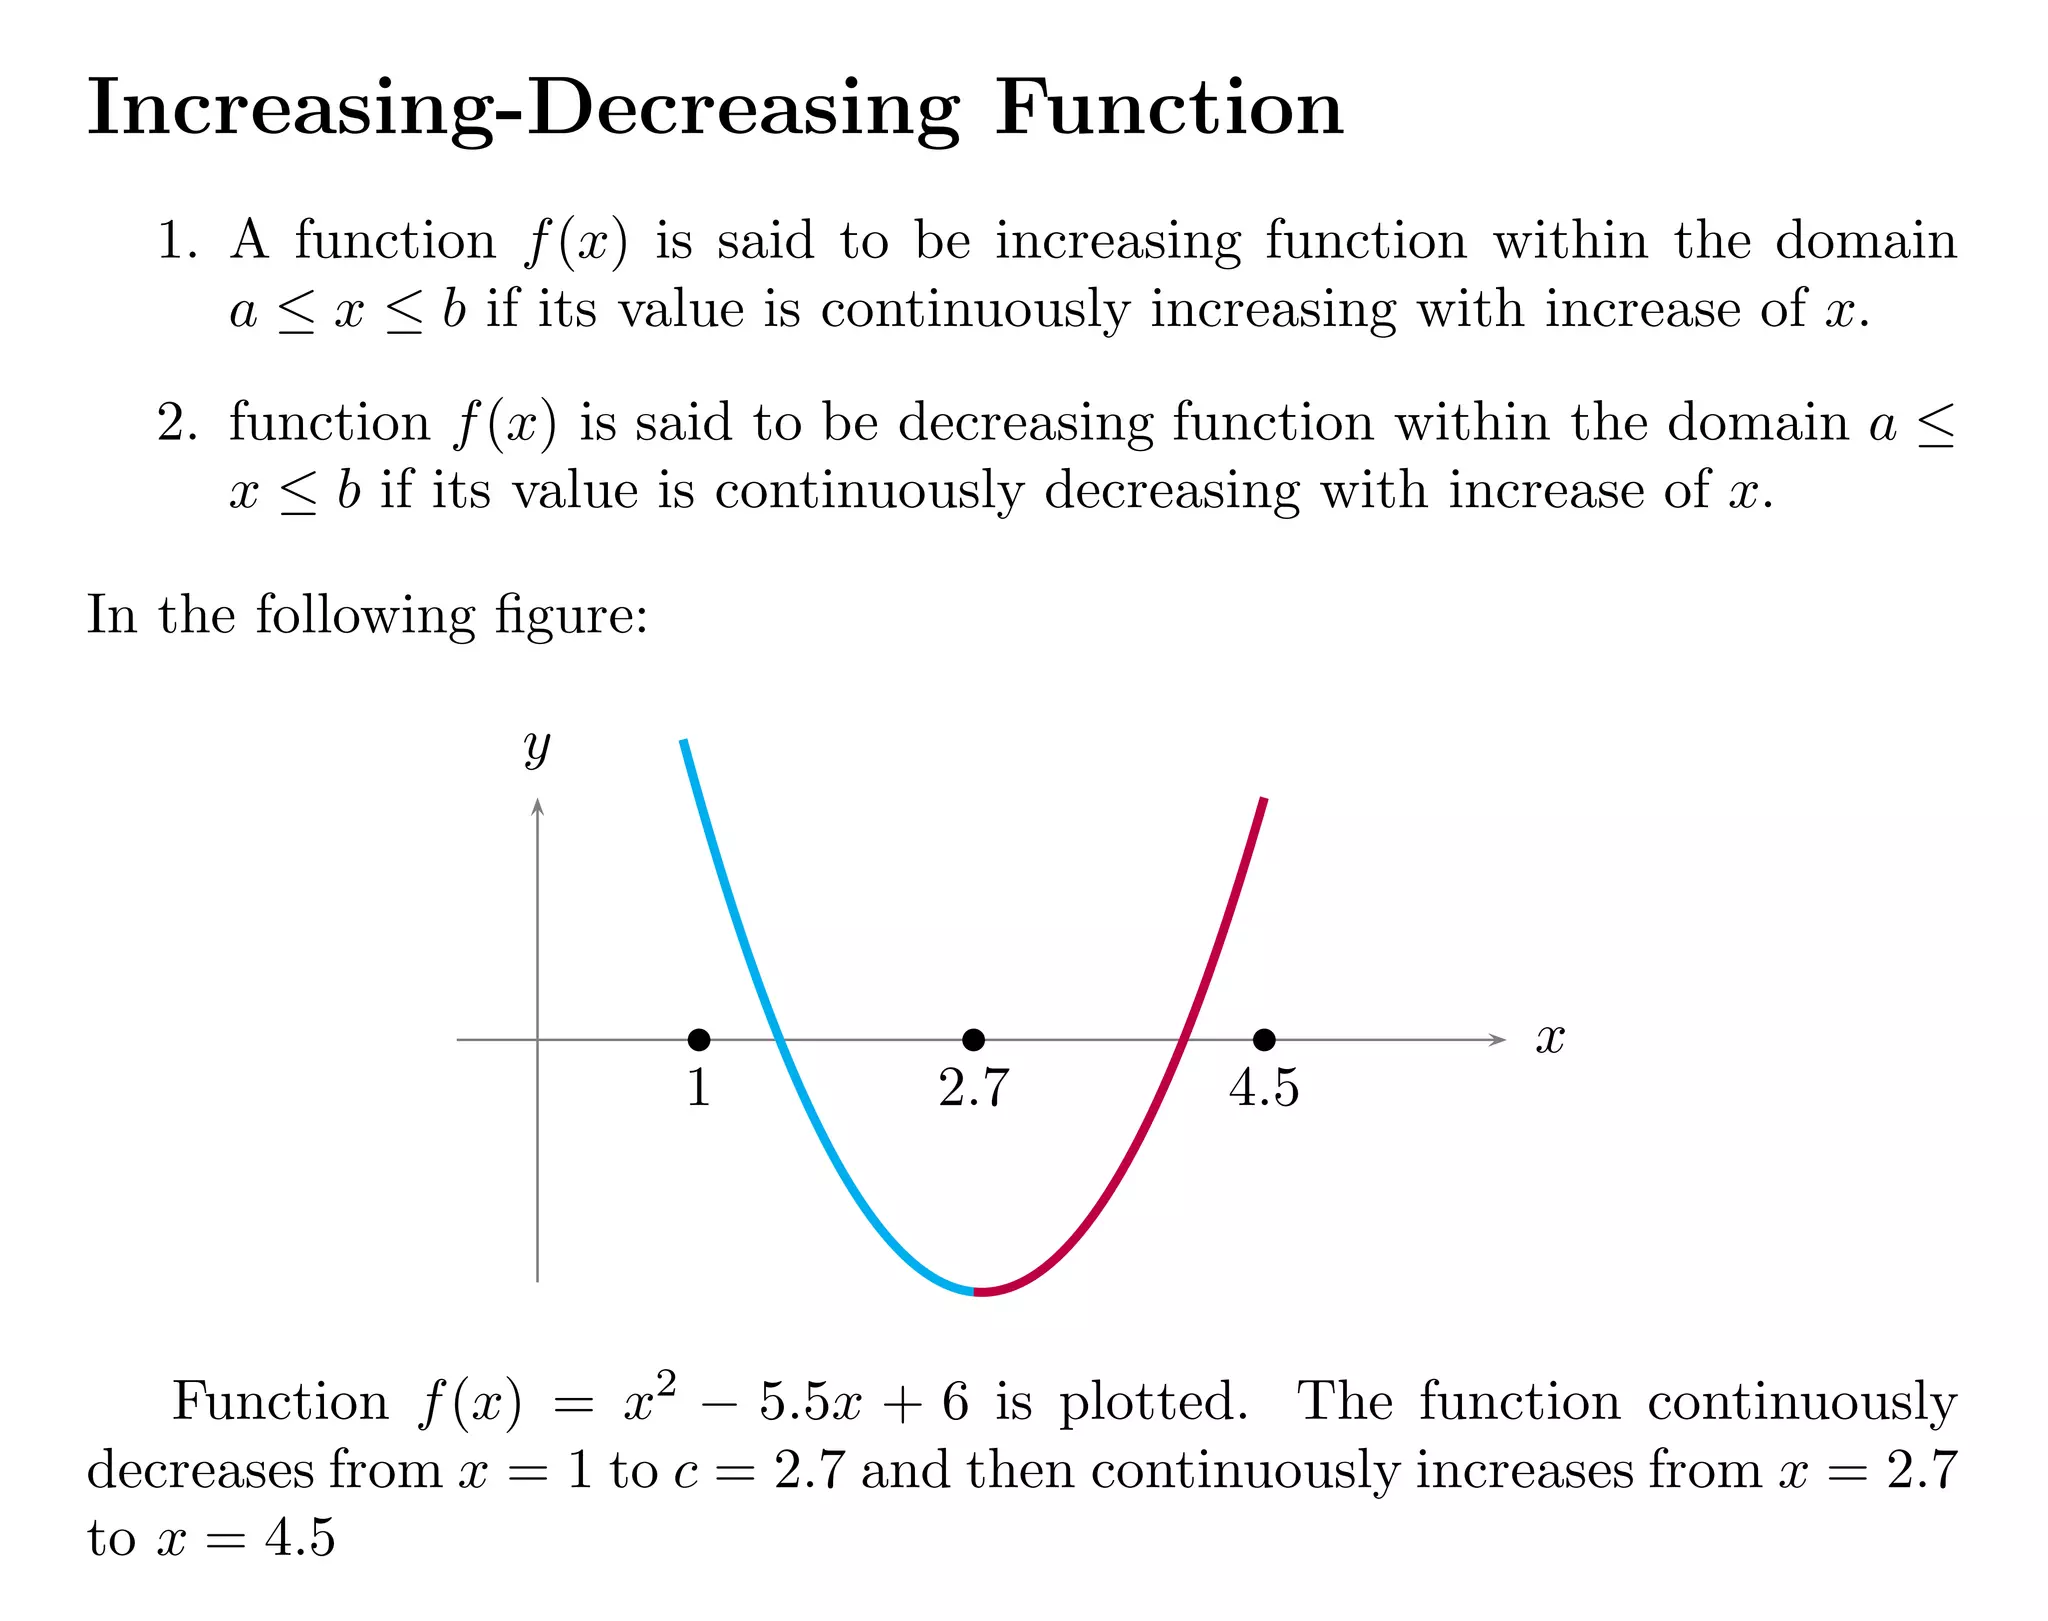
2. It provides an example of a function f(x) = x^2 - 5.5x + 6 that decreases from x = 1 to 2.7 and then increases from 2.7 to 4.5.
3. To determine if a function is increasing or decreasing over a domain, one calculates the first order differences between adjacent y-values and checks if the differences are positive or negative.


![6
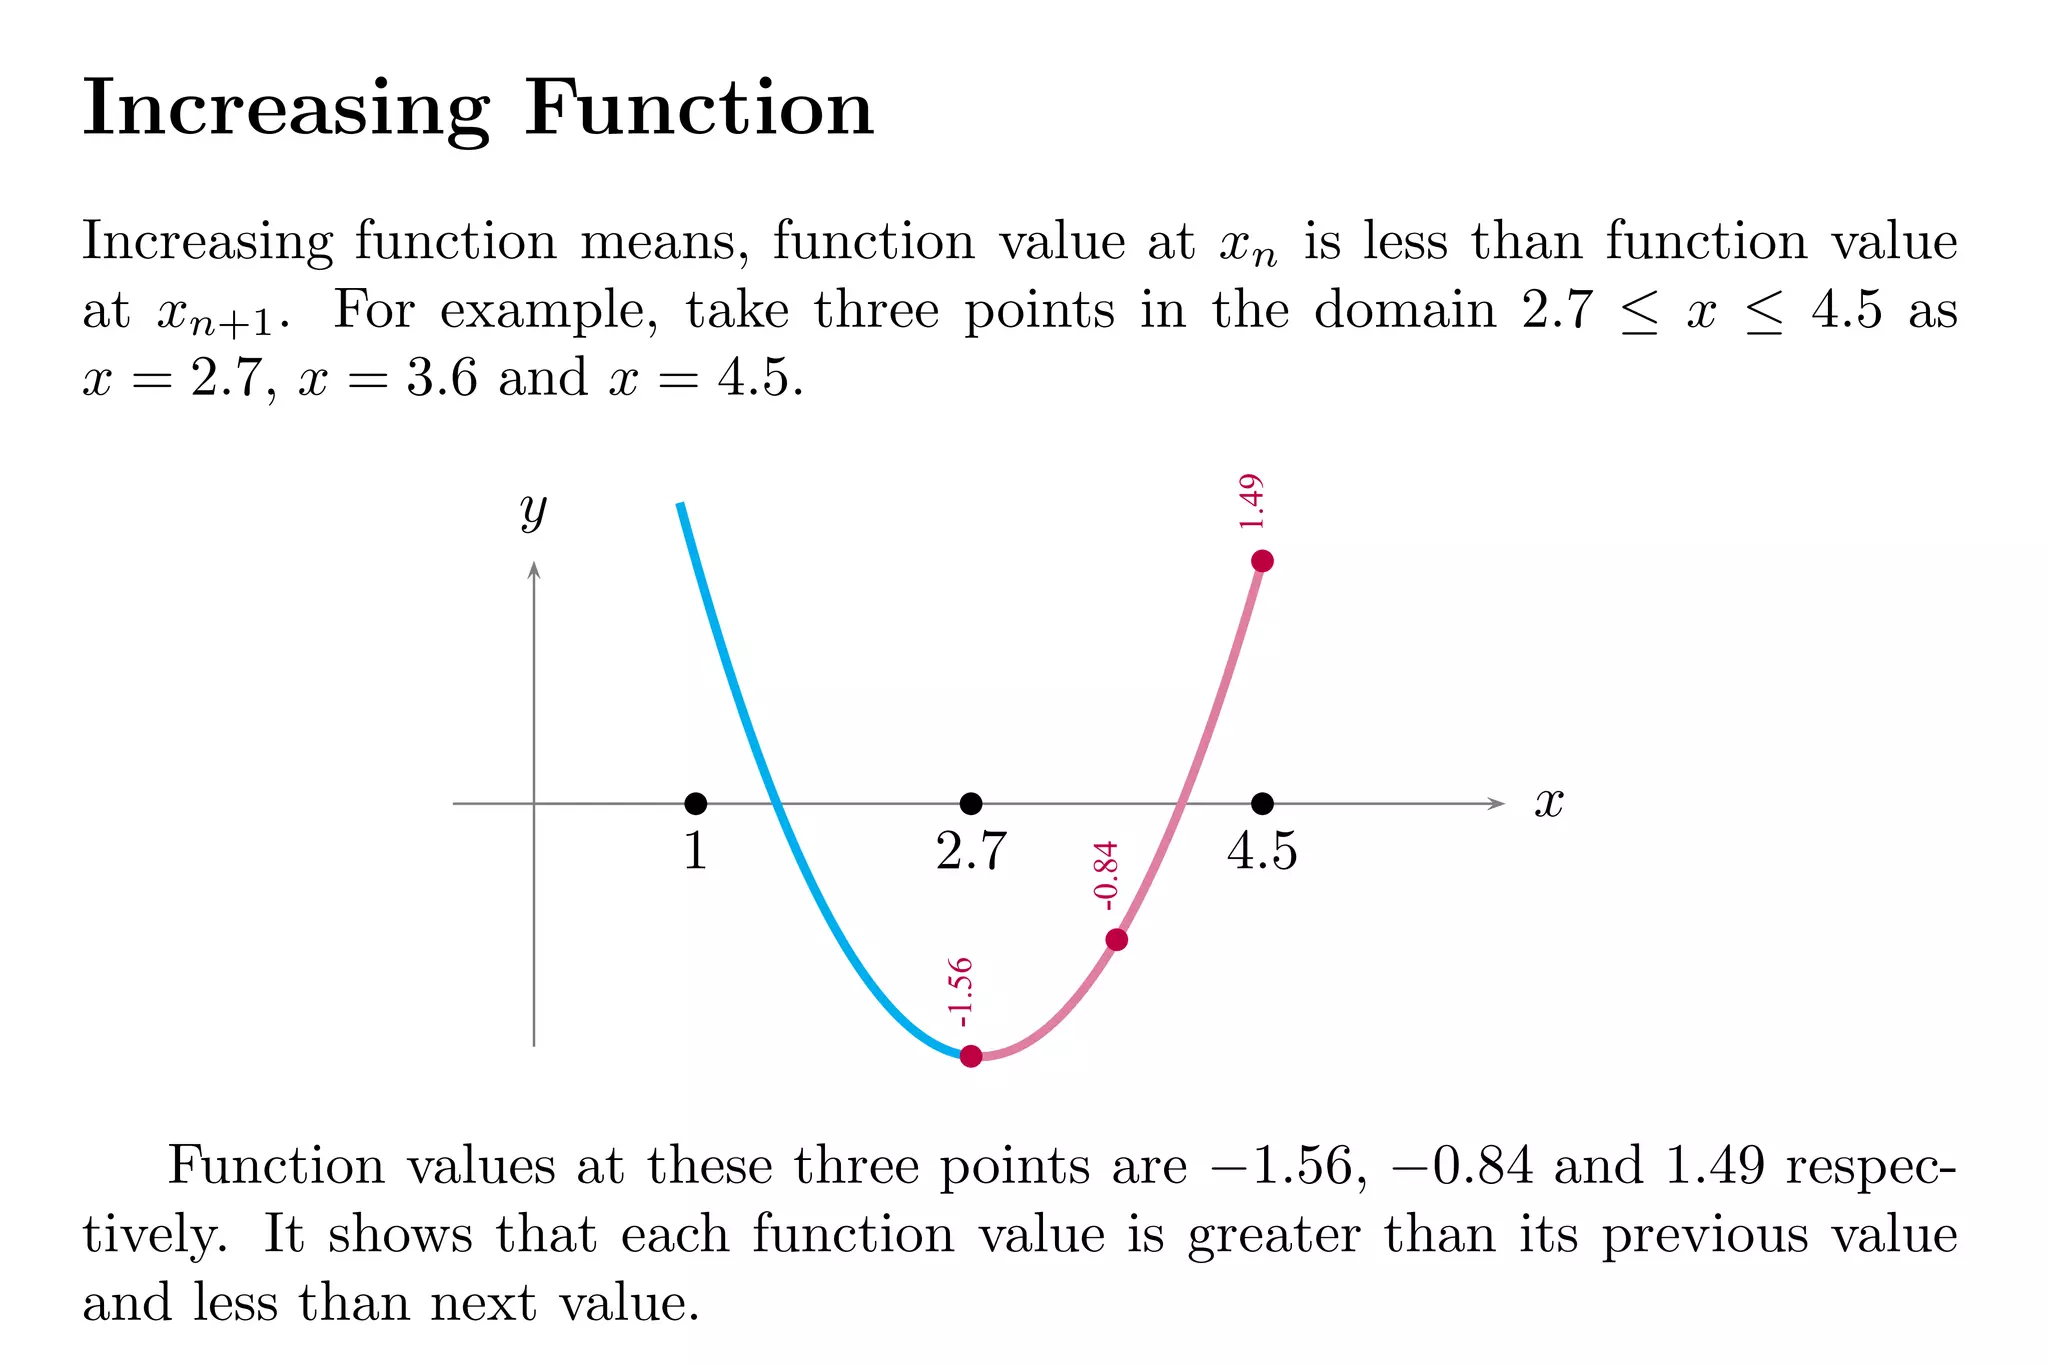
First Order Difference
First order difference is the difference of function value at poitn xn from
function value xn+1. It is represented by
∆f[xn] = f[xn+1] − f[xn]
x
y b
b
b
1.86
-0.65
-1.56
b
1
b
2.7
b
4.5
First order difference of the function values in function plot within the
domain 1 ≤ x ≤ 2.7 are −0.65 − 1.86 = −2.51 and −1.56 − (−0.65) = −0.91
respectively. These differences have “negative sign” (do not compare the
magnitude). So, function is decreasing function.
x
y
b
b
b
-1.56
-0.84
1.49
b
1
b
2.7
b
4.5
First order difference of the function values in function plot in the domain
2.7 ≤ x ≤ 4.5 are −0.84 − (−1.56) = 0.72 and 1.49 − (−0.84) = 2.33
respectively. These differences have “positive sign” (do not compare the
magnitude). So, function is increasing function.](https://image.slidesharecdn.com/decreasingincreasingfunctionsbyarunumrao-211013171202-211017115936/75/Decreasing-increasing-functions-by-arun-umrao-6-2048.jpg)
![7
Difference Table
Consider a function f(x) = x2
− 5.5x + 6. We have to check, where function
is increasing and decreasing. Take two arbitrary limits, say x = 0 to x =
3. Take 30 points within this limits. The points xn are 0, 0.1, . . ., 3.0.
The function values at these points are computed using Excel software and
relation
∆f[xn] = f[xn+1] − f[xn]
x f(x) ∆f(x) x f(x) ∆f(x)
0.00 6.00 -0.54 1.60 -0.24 -0.22
0.10 5.46 -0.52 1.70 -0.46 -0.20
0.20 4.94 -0.50 1.80 -0.66 -0.18
0.30 4.44 -0.48 1.90 -0.84 -0.16
0.40 3.96 -0.46 2.00 -1.00 -0.14
0.50 3.50 -0.44 2.10 -1.14 -0.12
0.60 3.06 -0.42 2.20 -1.26 -0.10
0.70 2.64 -0.40 2.30 -1.36 -0.08
0.80 2.24 -0.38 2.40 -1.44 -0.06
0.90 1.86 -0.36 2.50 -1.50 -0.04
1.00 1.50 -0.34 2.60 -1.54 -0.02
1.10 1.16 -0.32 2.70 -1.56 0.00
1.20 0.84 -0.30 2.80 -1.56 0.02
1.30 0.54 -0.28 2.90 -1.54 0.04
1.40 0.26 -0.26 3.00 -1.50 0.06
1.50 0.00 -0.24 3.10 -1.44
To check the curve of function f(x) that, where it is increasing and where
it is decreasing, we observe the “sign” of ∆f(x), i.e. “sing” of first order
difference. The domain of x for which “sign” of ∆f(x) is “negative”, function
is continuously decreasing there. Similarly, the domain of x for which “sign”
of ∆f(x) is “positive”, function is continuous increasing there.](https://image.slidesharecdn.com/decreasingincreasingfunctionsbyarunumrao-211013171202-211017115936/75/Decreasing-increasing-functions-by-arun-umrao-7-2048.jpg)