i. The document defines and explains the properties of constant, linear, quadratic, and piecewise functions through examples and formulas.
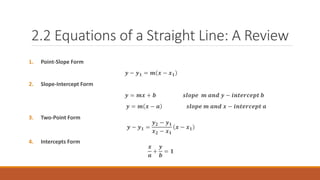
ii. Constant functions have a horizontal line graph. Linear functions have a straight line graph described by the slope-intercept form y=mx+b.
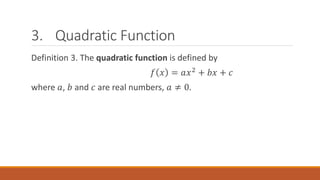
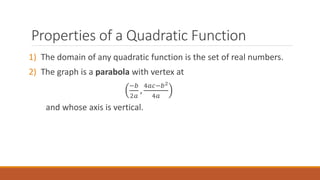
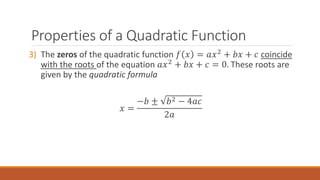
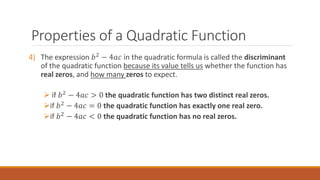
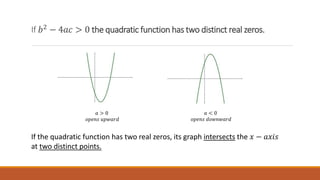
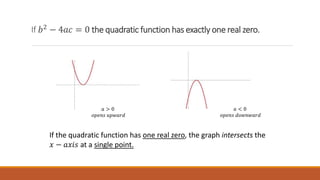
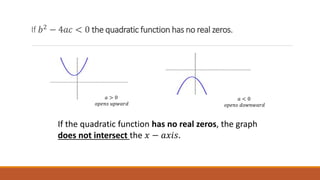
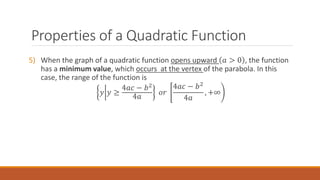
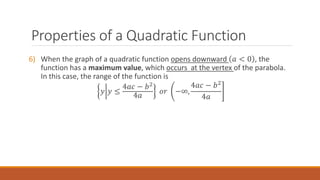
iii. Quadratic functions have a parabolic graph that opens up or down, with properties determined by the discriminant. Piecewise functions use different expressions over parts of the domain.