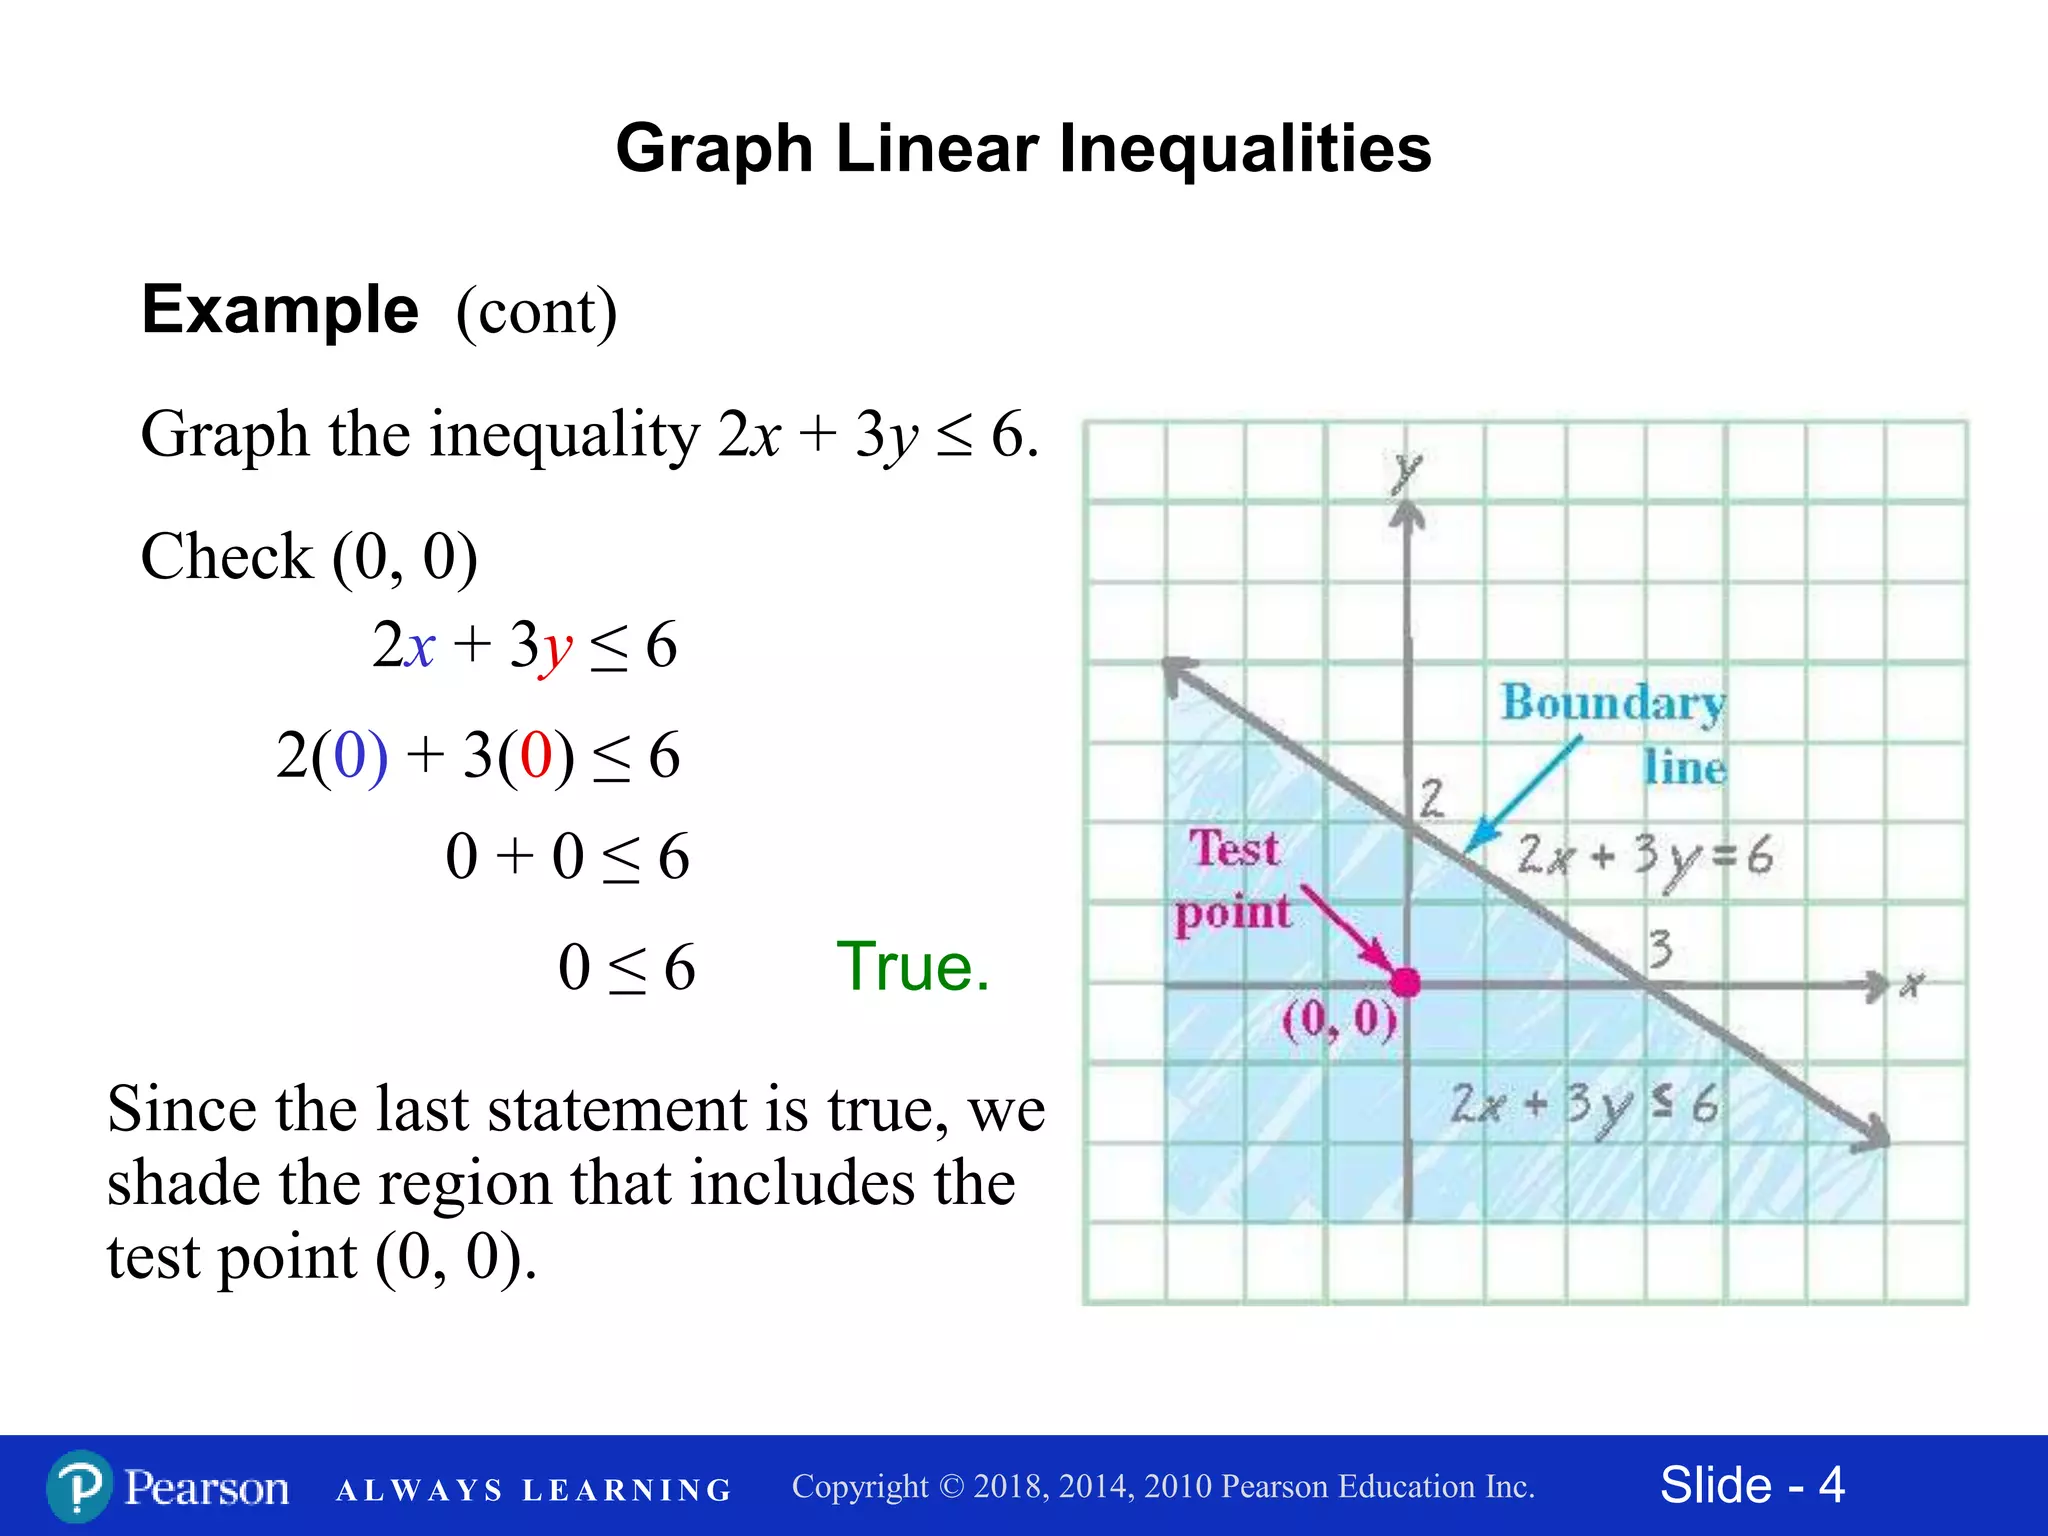
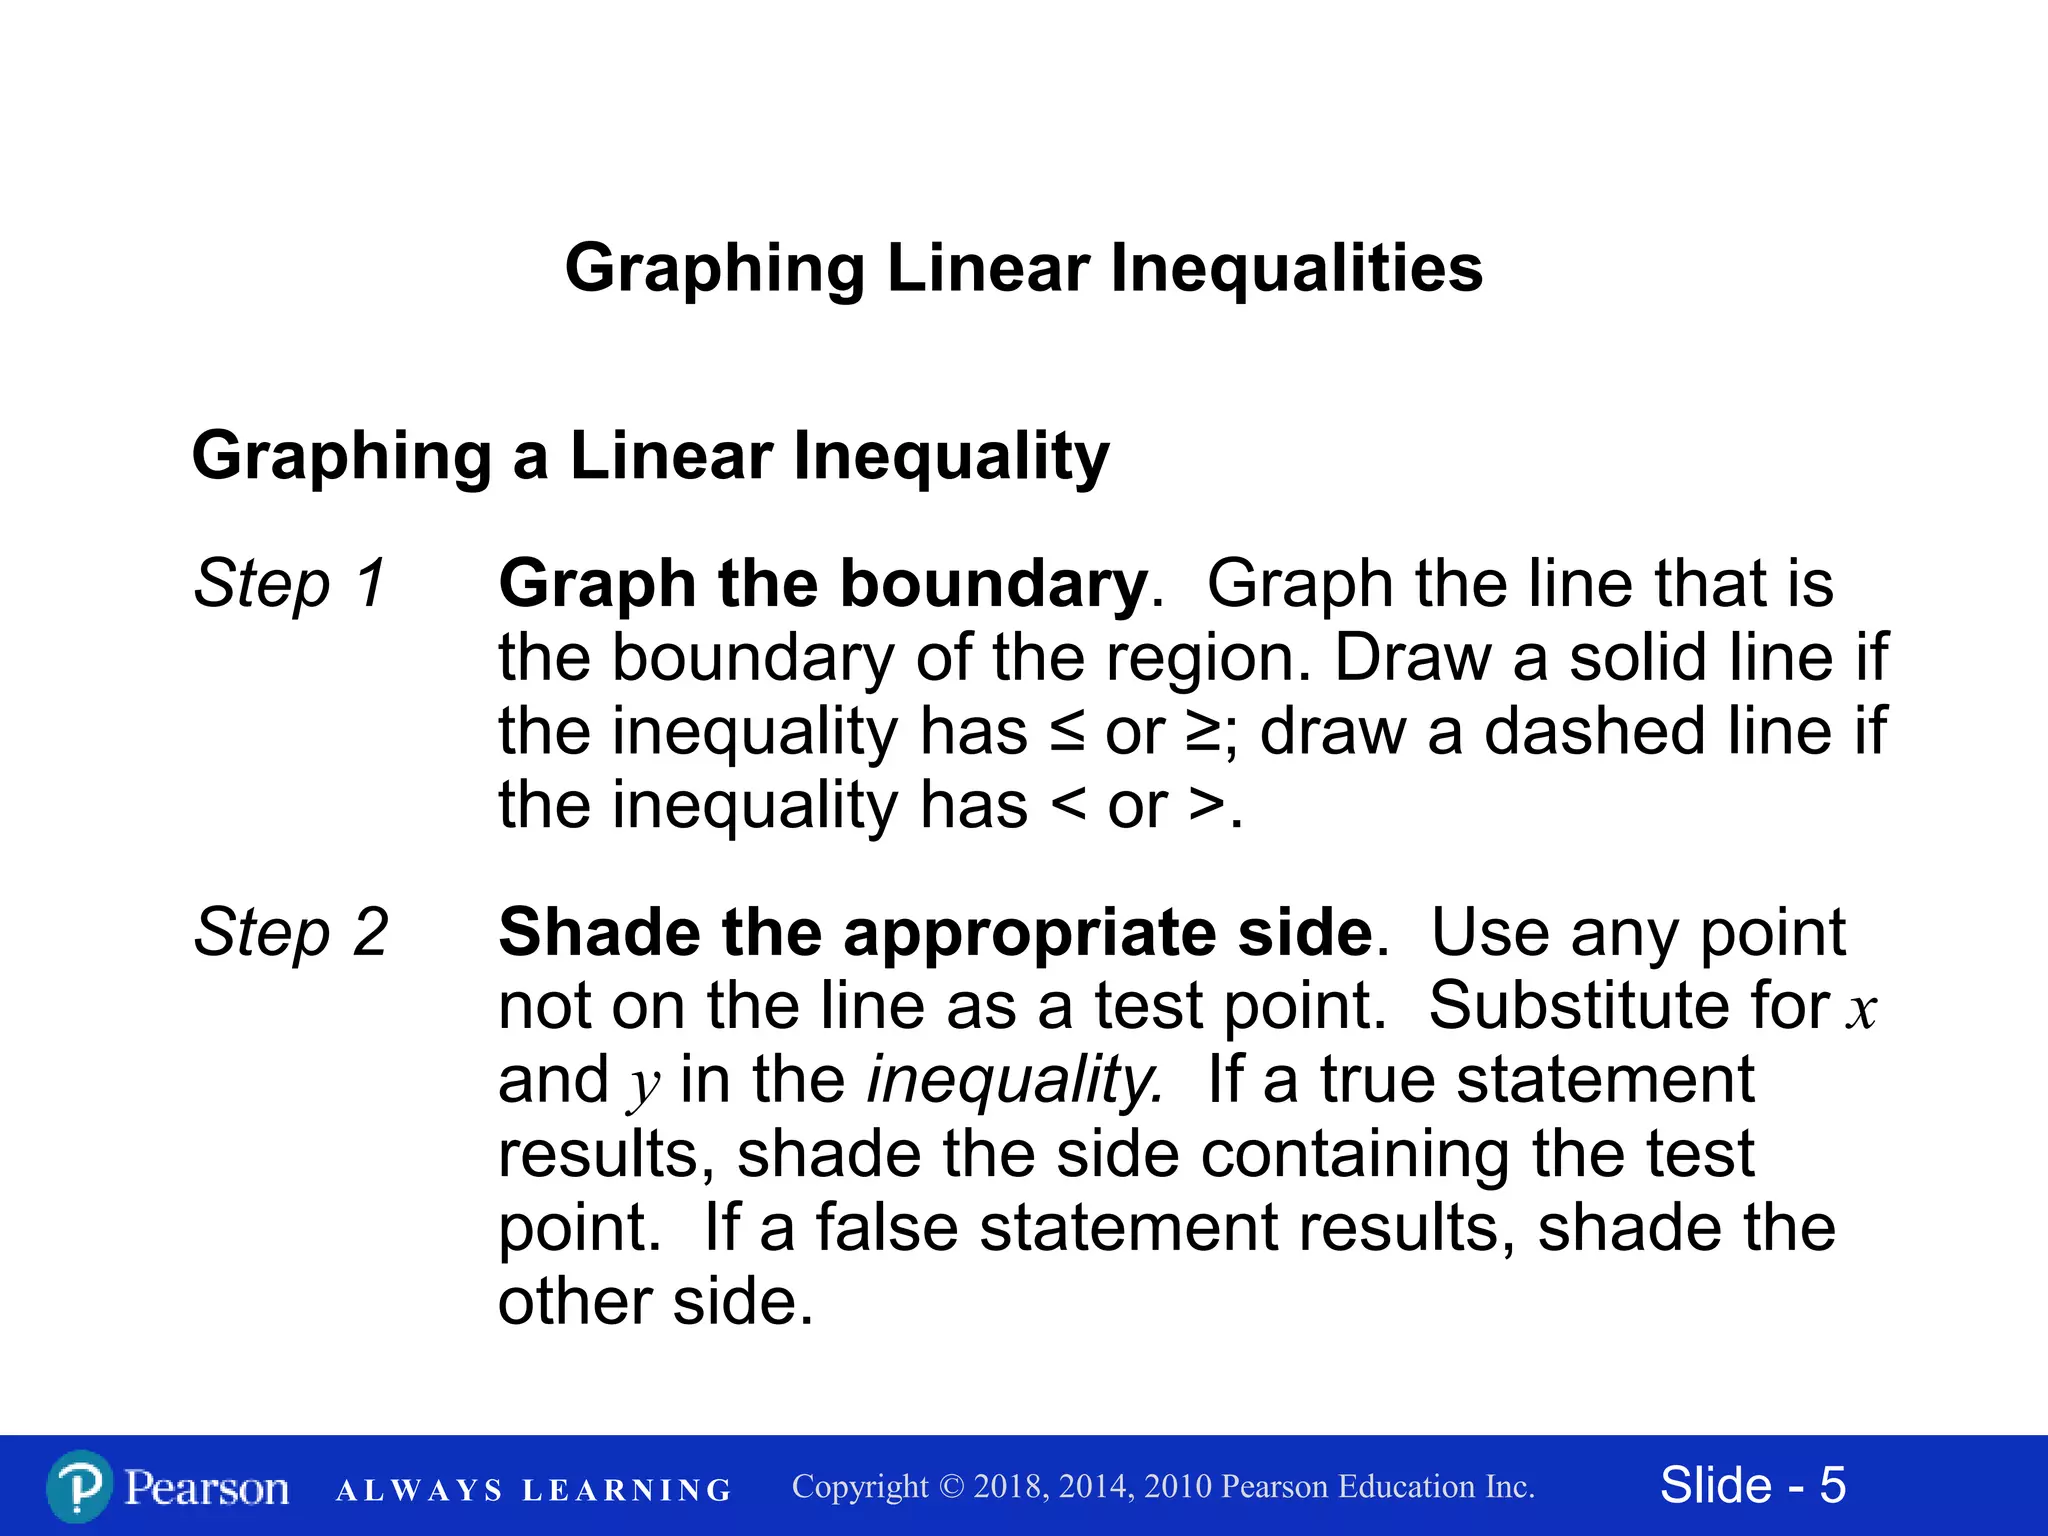
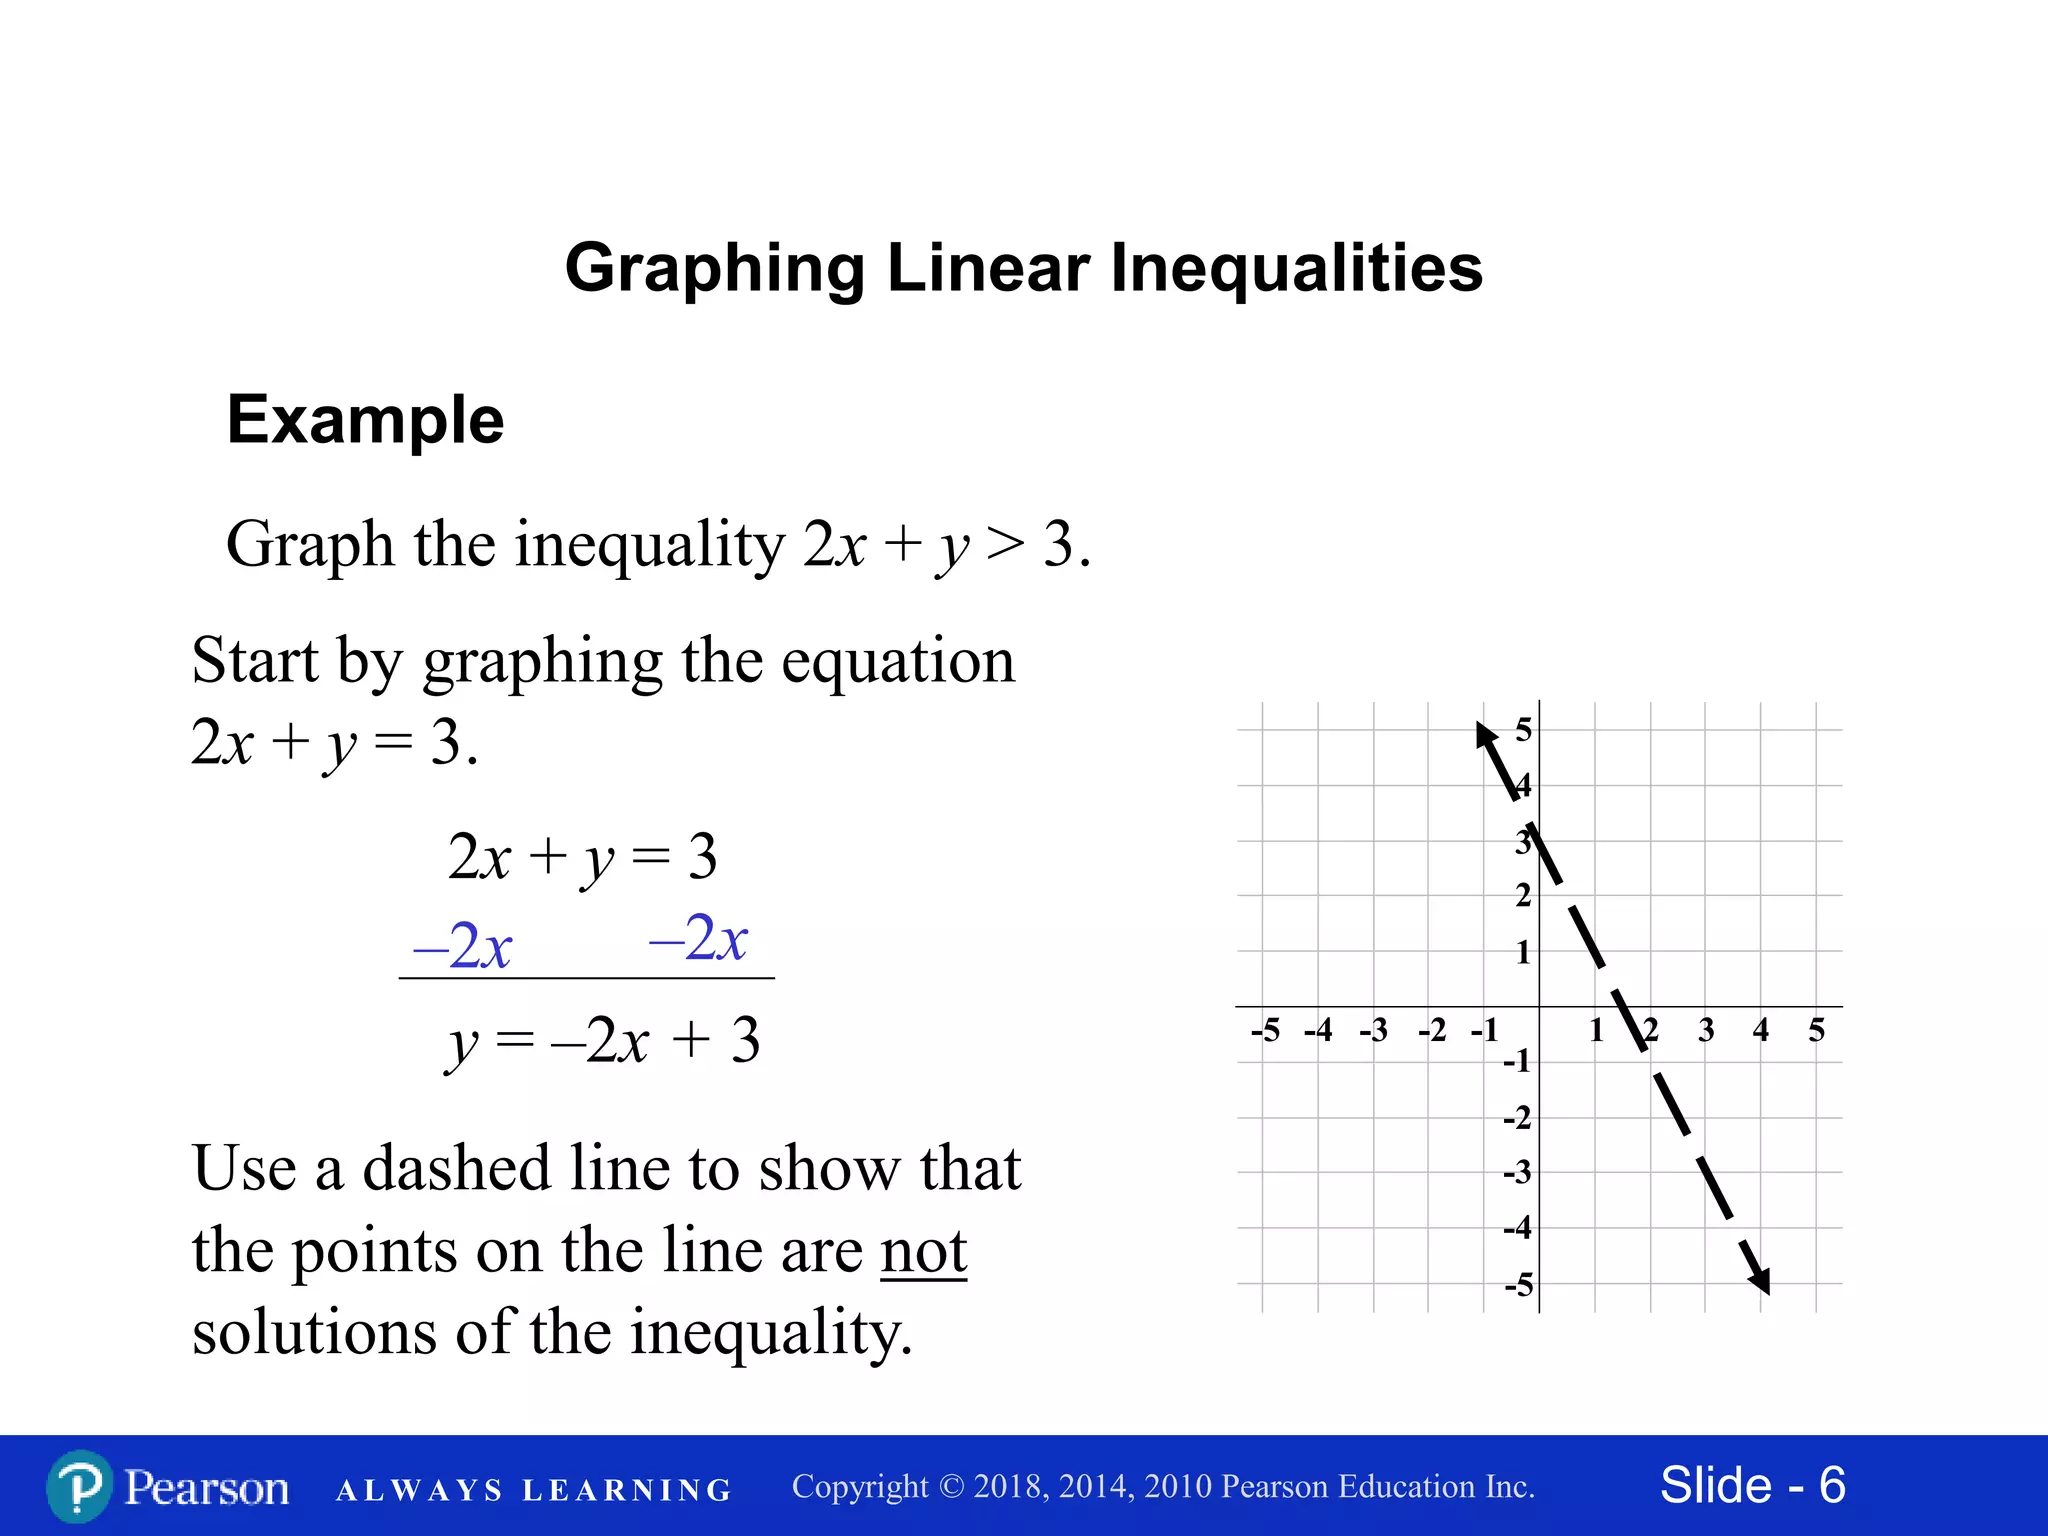
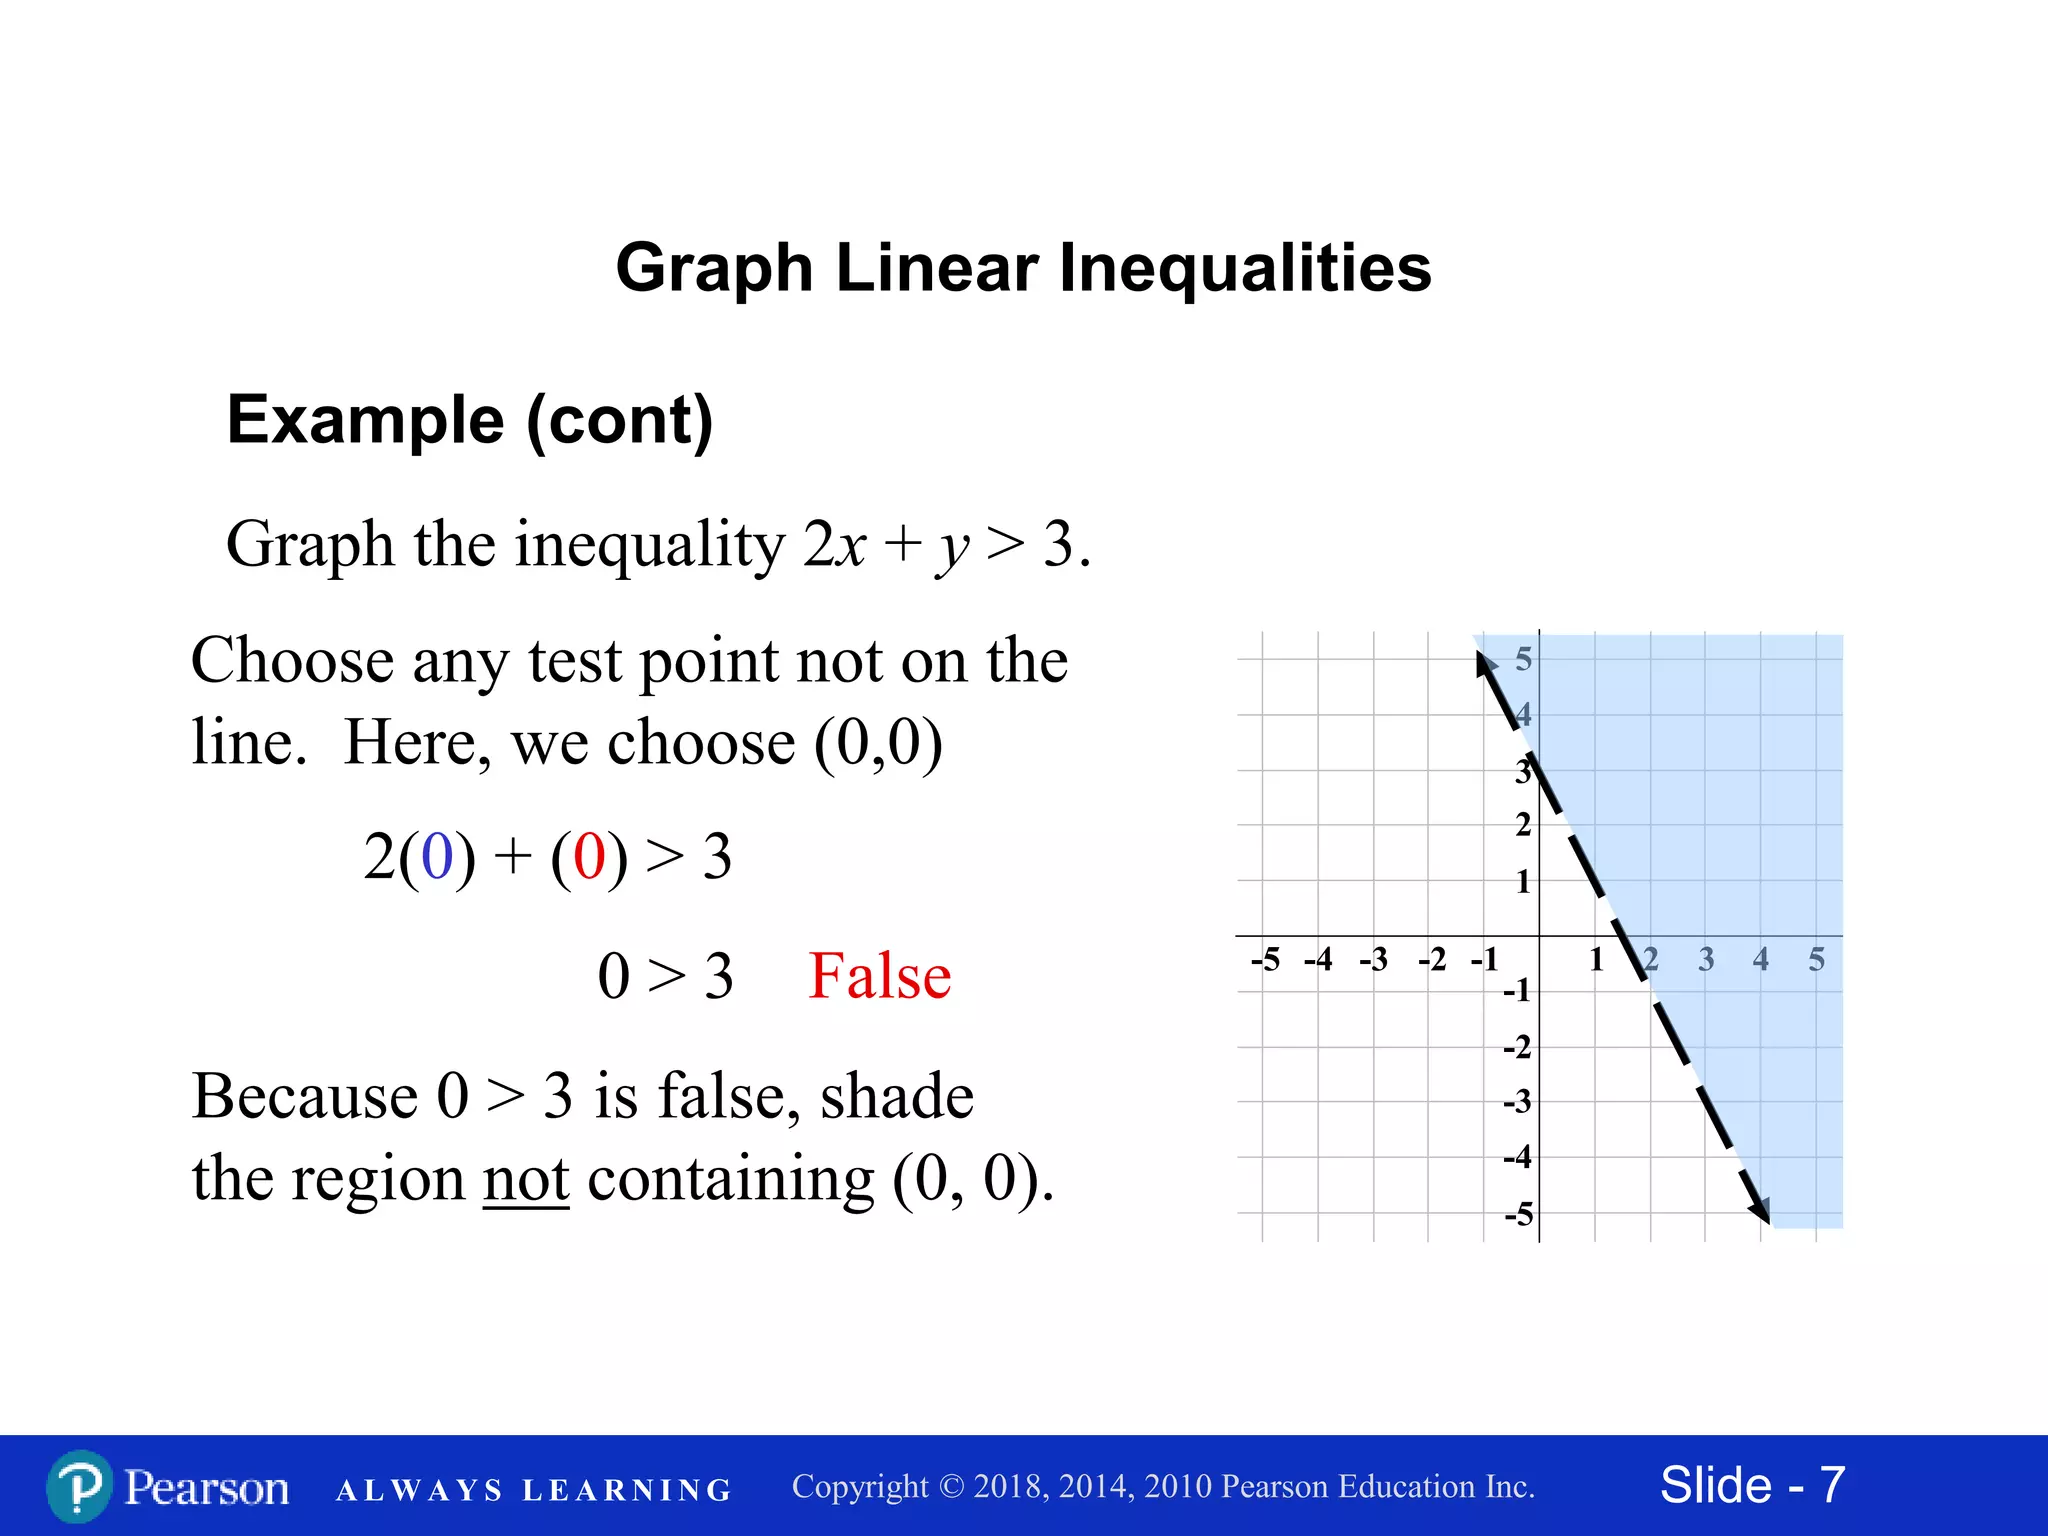
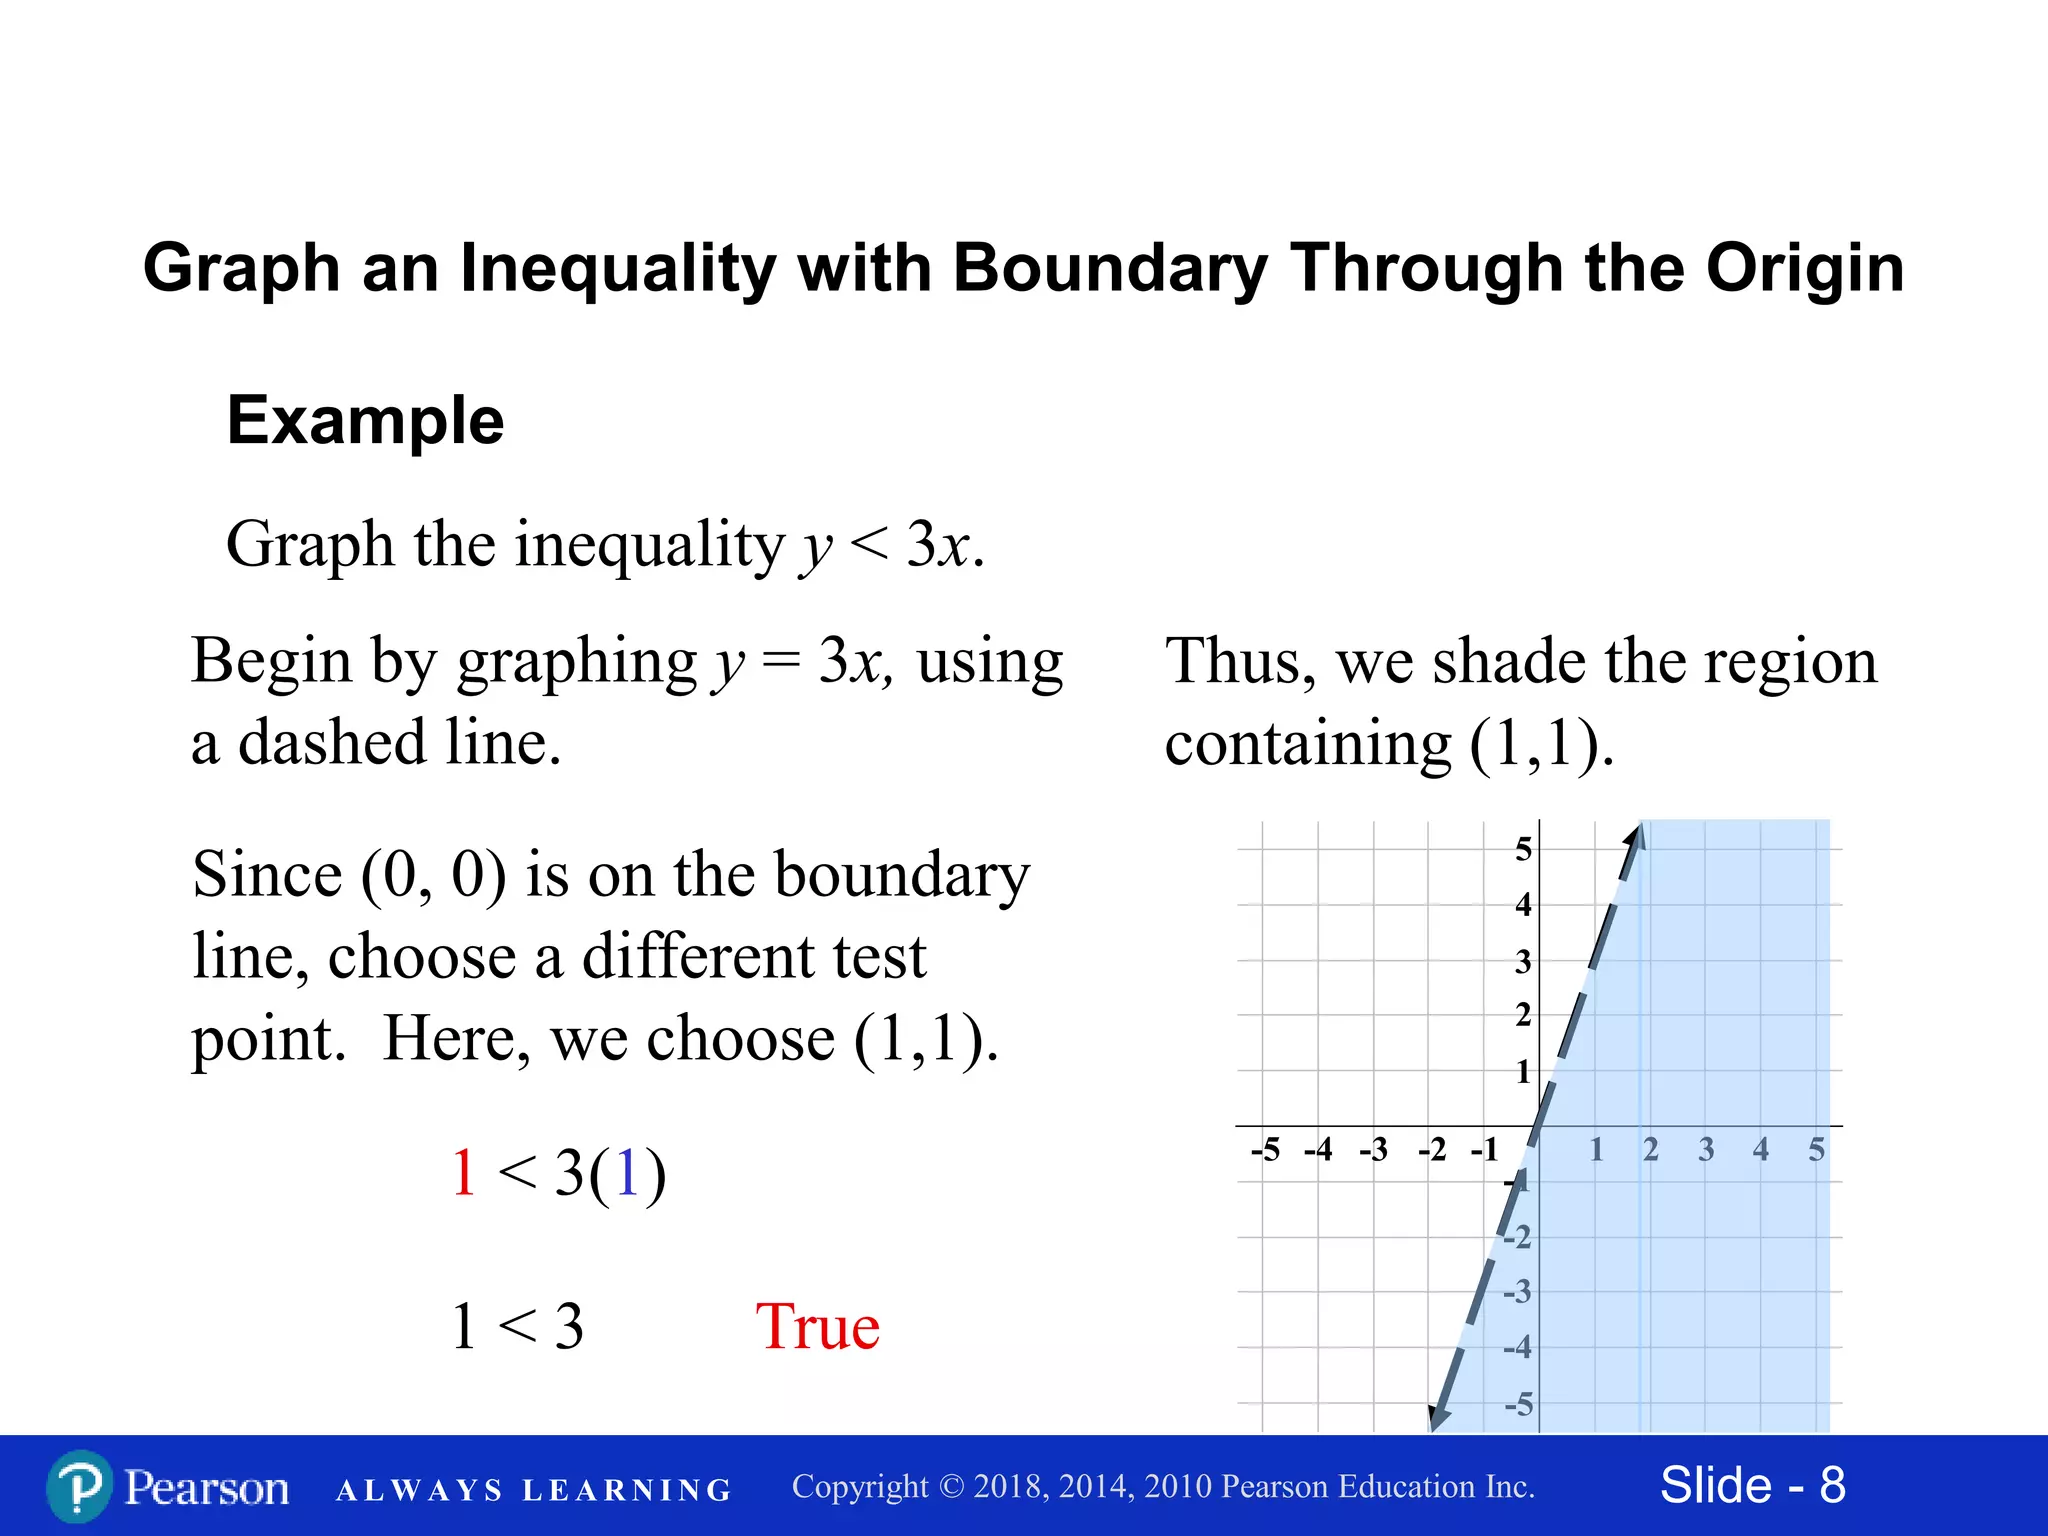
This document discusses how to graph linear inequalities in two variables. It provides examples of graphing various inequalities, including 2x + 3y ≤ 6, 2x + y > 3, and y < 3x. The process involves graphing the boundary line defined by the equal case of the inequality and then shading the appropriate region based on checking if a test point satisfies the inequality. Key steps are to draw the boundary line as solid or dashed based on the symbols (< or > versus ≤ or ≥) and then shade the region containing points that satisfy the inequality.