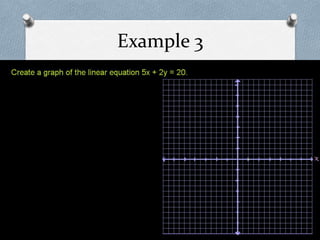
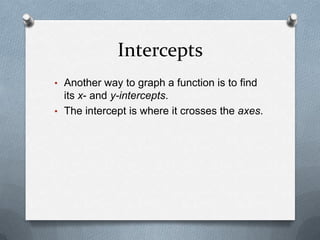
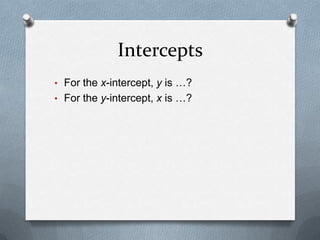
Linear FunctionsAlgebra 2
RelationsA relation is a pairing of input and output values.RelationsA relation is a pairing of input and output values.
Can be represented graphically by a set of ordered pairs (x, y).FunctionsA relation is a function when each input value has one and only one output value. Example 1DomainRangeVertical Line Test
Linear FunctionsA linear function makes a line on a graph.Linear FunctionsA linear function makes a line on a graph.
A solution to a linear function is a point on the line.Example 2
GraphingThe graph of a function is the set of ALL the points (x, y) that satisfy the equation.GraphingThe graph of a function is the set of ALL the points (x, y) that satisfy the equation.
For a linear function, all these points together create a line.GraphingOne way to graph a linear function is to create a table of values.GraphingOne way to graph a linear function is to create a table of values.Solve the equation for y.
GraphingOne way to graph a linear function is to create a table of values.Solve the equation for y.Choose a few x-values to plug in and find the corresponding y-values.
GraphingOne way to graph a linear function is to create a table of values.Solve the equation for y.Choose a few x-values to plug in and find the corresponding y-values.Plot these points.
GraphingOne way to graph a linear function is to create a table of values.Solve the equation for y.Choose a few x-values to plug in and find the corresponding y-values.Plot these points.Connect with a straight line.
Example 3
InterceptsAnother way to graph a function is to find its x- and y-intercepts.
The intercept is where it crosses the axes.InterceptsFor the x-intercept, y is …?
For the y-intercept, xis …?
A2 1 linear fxns
A2 1 linear fxns
A2 1 linear fxns
A2 1 linear fxns

A2 1 linear fxns

  • 1.
  • 2.
    RelationsA relation isa pairing of input and output values.RelationsA relation is a pairing of input and output values.
  • 3.
    Can be representedgraphically by a set of ordered pairs (x, y).FunctionsA relation is a function when each input value has one and only one output value. Example 1DomainRangeVertical Line Test
  • 4.
    Linear FunctionsA linearfunction makes a line on a graph.Linear FunctionsA linear function makes a line on a graph.
  • 5.
    A solution toa linear function is a point on the line.Example 2
  • 6.
    GraphingThe graph ofa function is the set of ALL the points (x, y) that satisfy the equation.GraphingThe graph of a function is the set of ALL the points (x, y) that satisfy the equation.
  • 7.
    For a linearfunction, all these points together create a line.GraphingOne way to graph a linear function is to create a table of values.GraphingOne way to graph a linear function is to create a table of values.Solve the equation for y.
  • 8.
    GraphingOne way tograph a linear function is to create a table of values.Solve the equation for y.Choose a few x-values to plug in and find the corresponding y-values.
  • 9.
    GraphingOne way tograph a linear function is to create a table of values.Solve the equation for y.Choose a few x-values to plug in and find the corresponding y-values.Plot these points.
  • 10.
    GraphingOne way tograph a linear function is to create a table of values.Solve the equation for y.Choose a few x-values to plug in and find the corresponding y-values.Plot these points.Connect with a straight line.
  • 11.
  • 12.
    InterceptsAnother way tograph a function is to find its x- and y-intercepts.
  • 13.
    The intercept iswhere it crosses the axes.InterceptsFor the x-intercept, y is …?
  • 14.