Downloaded 123 times
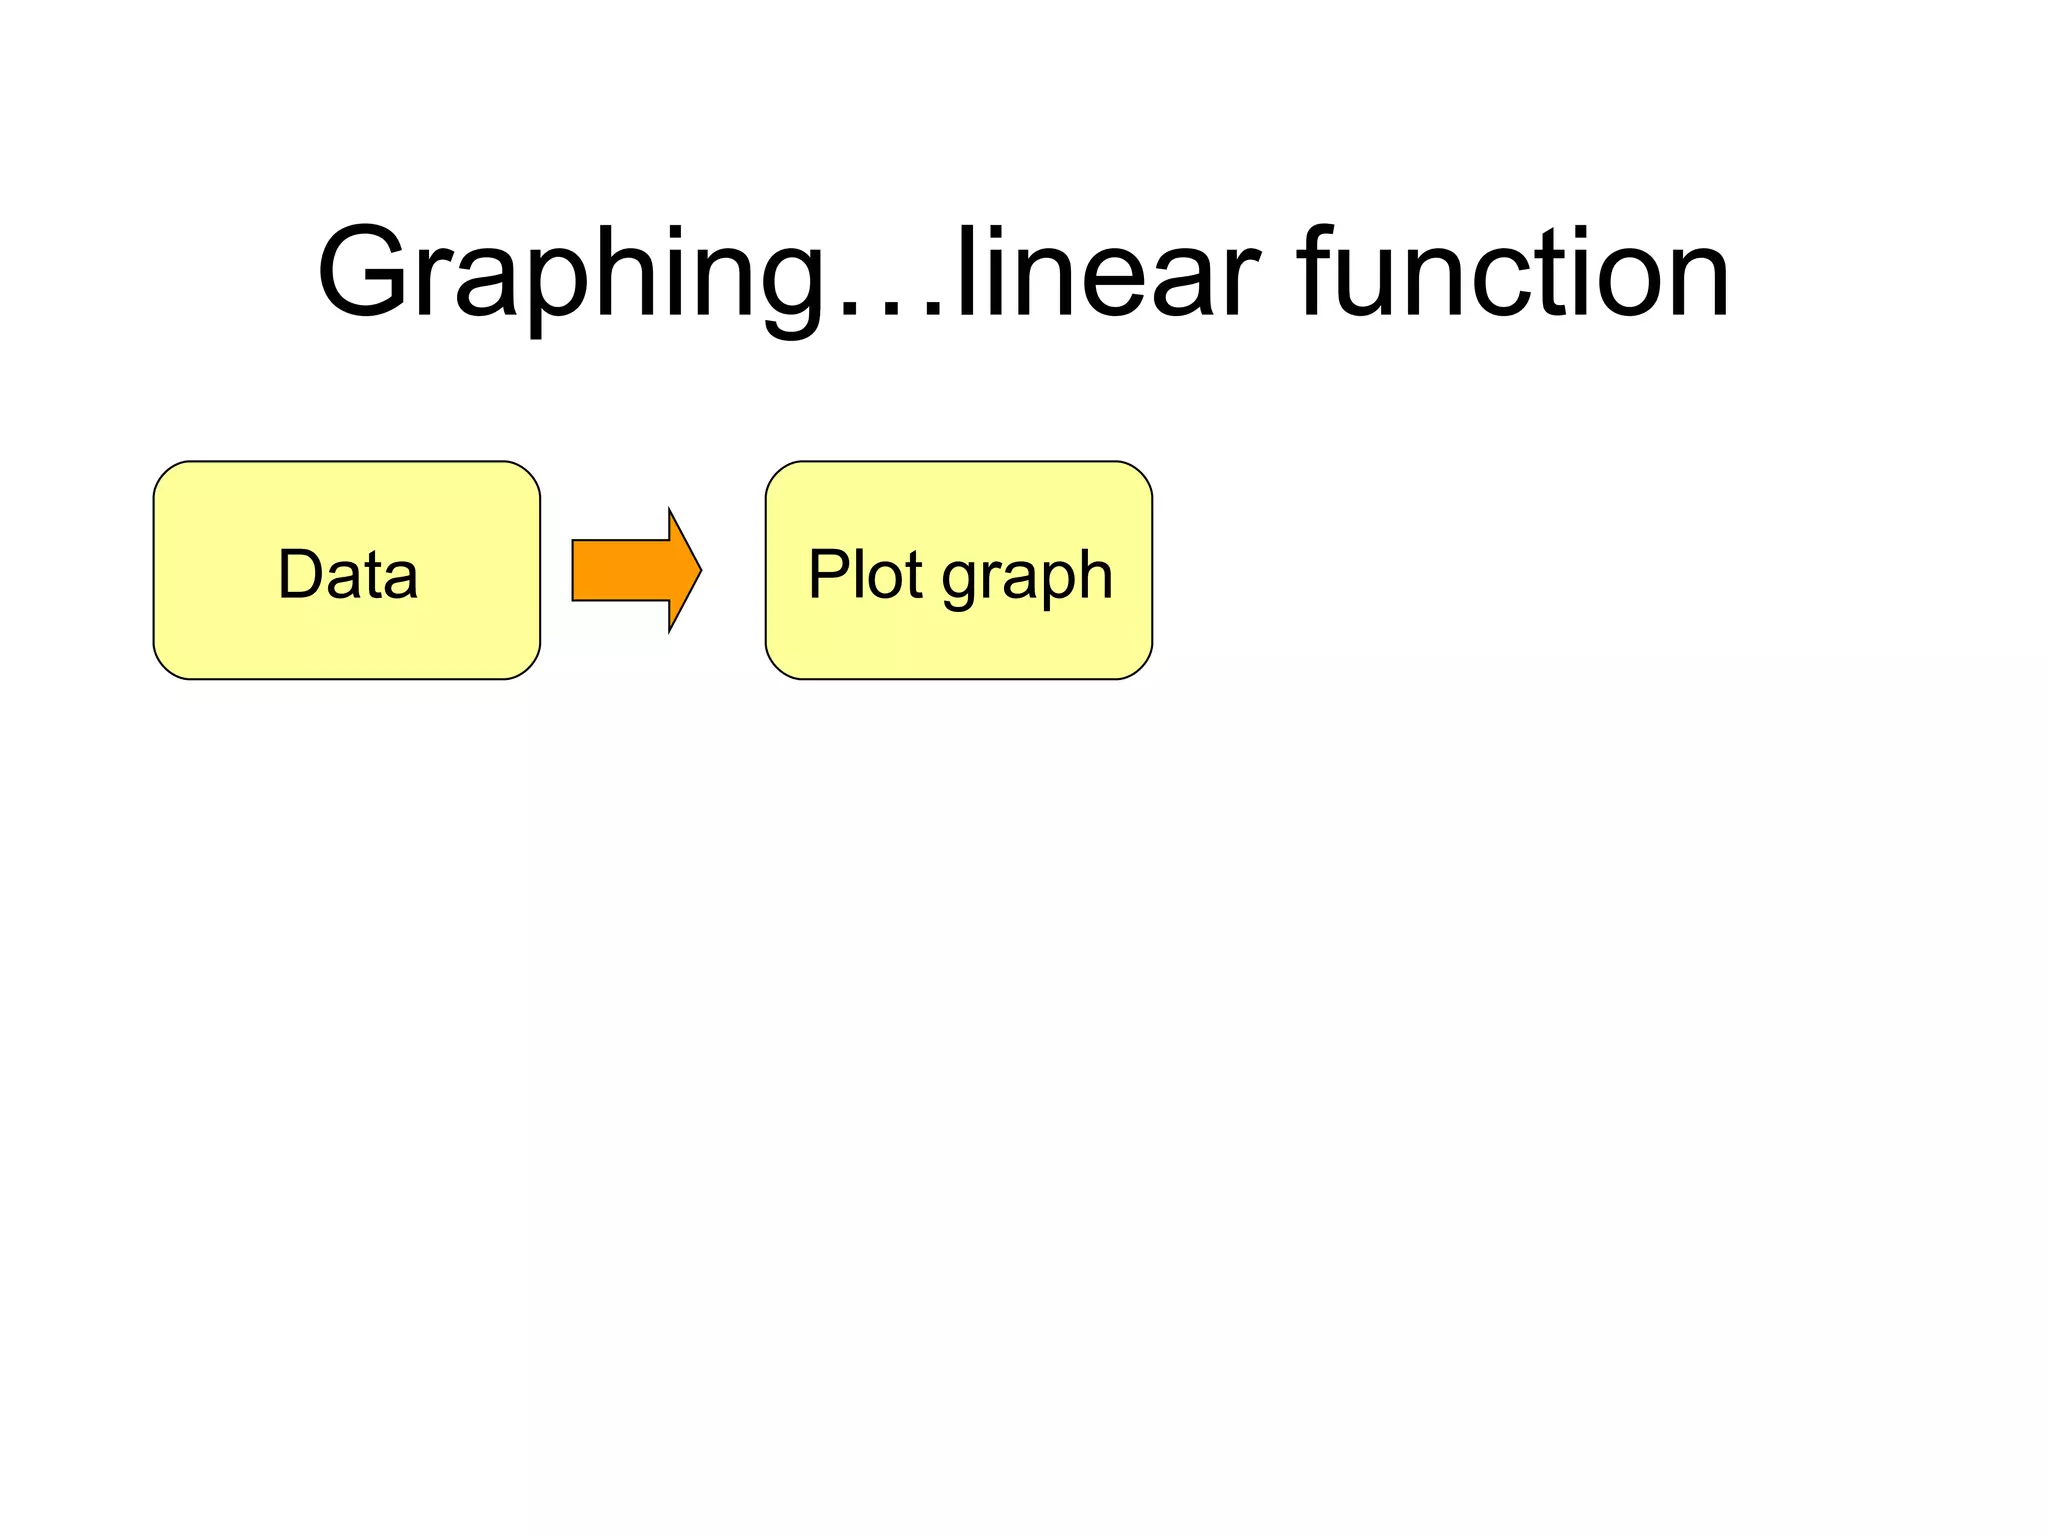
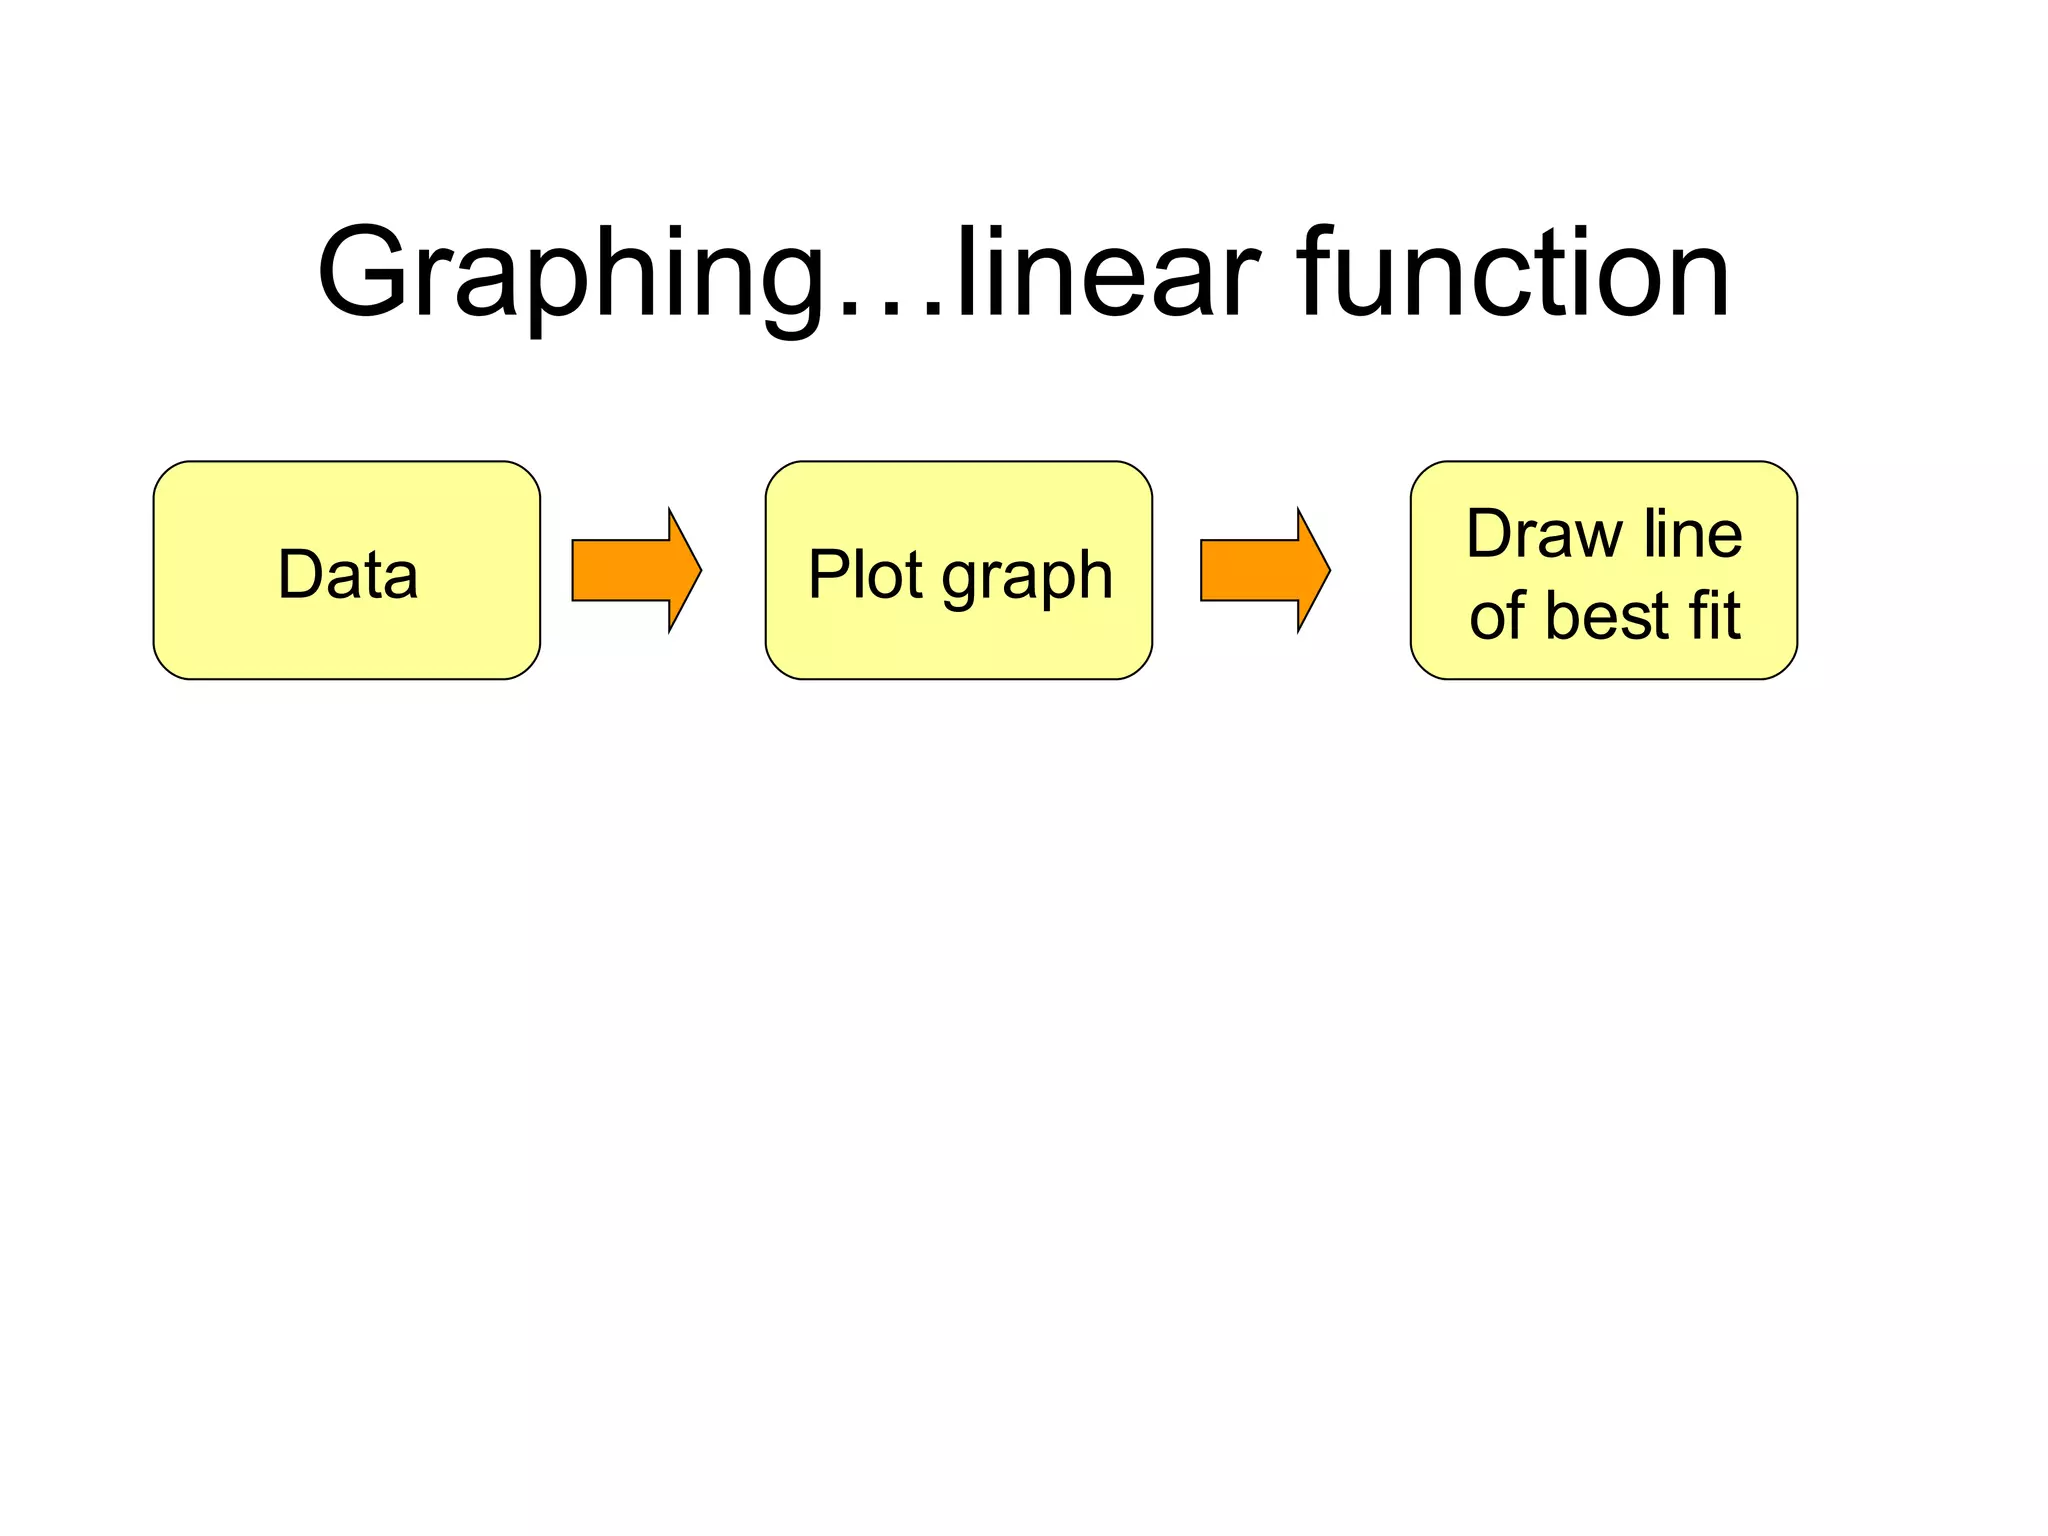
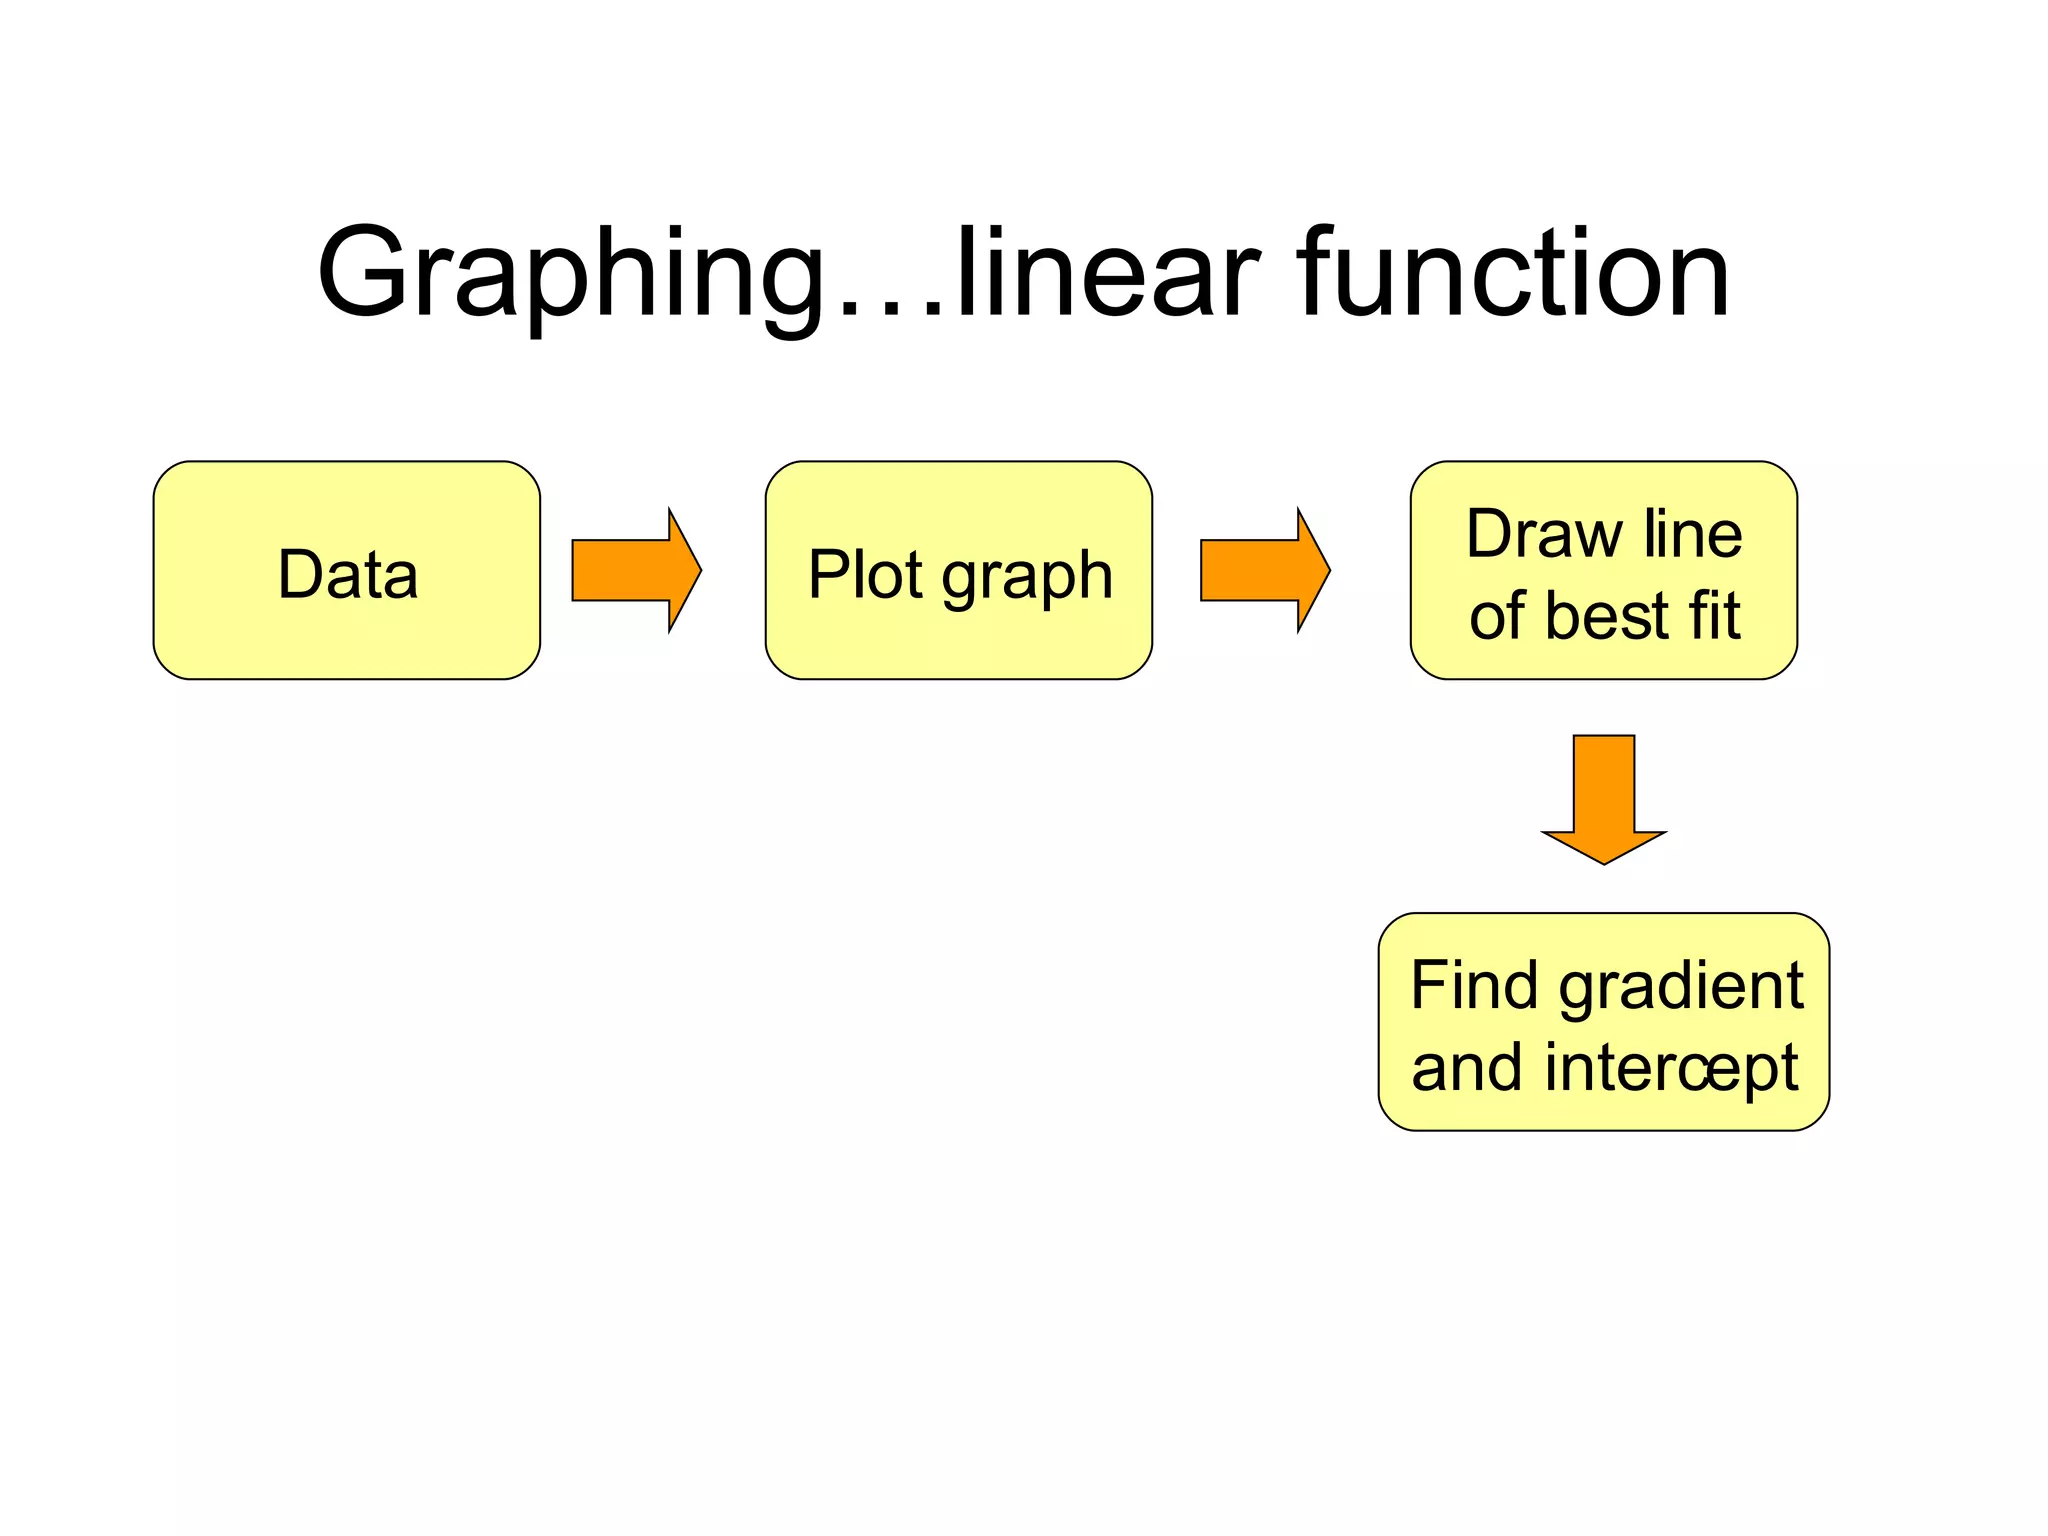
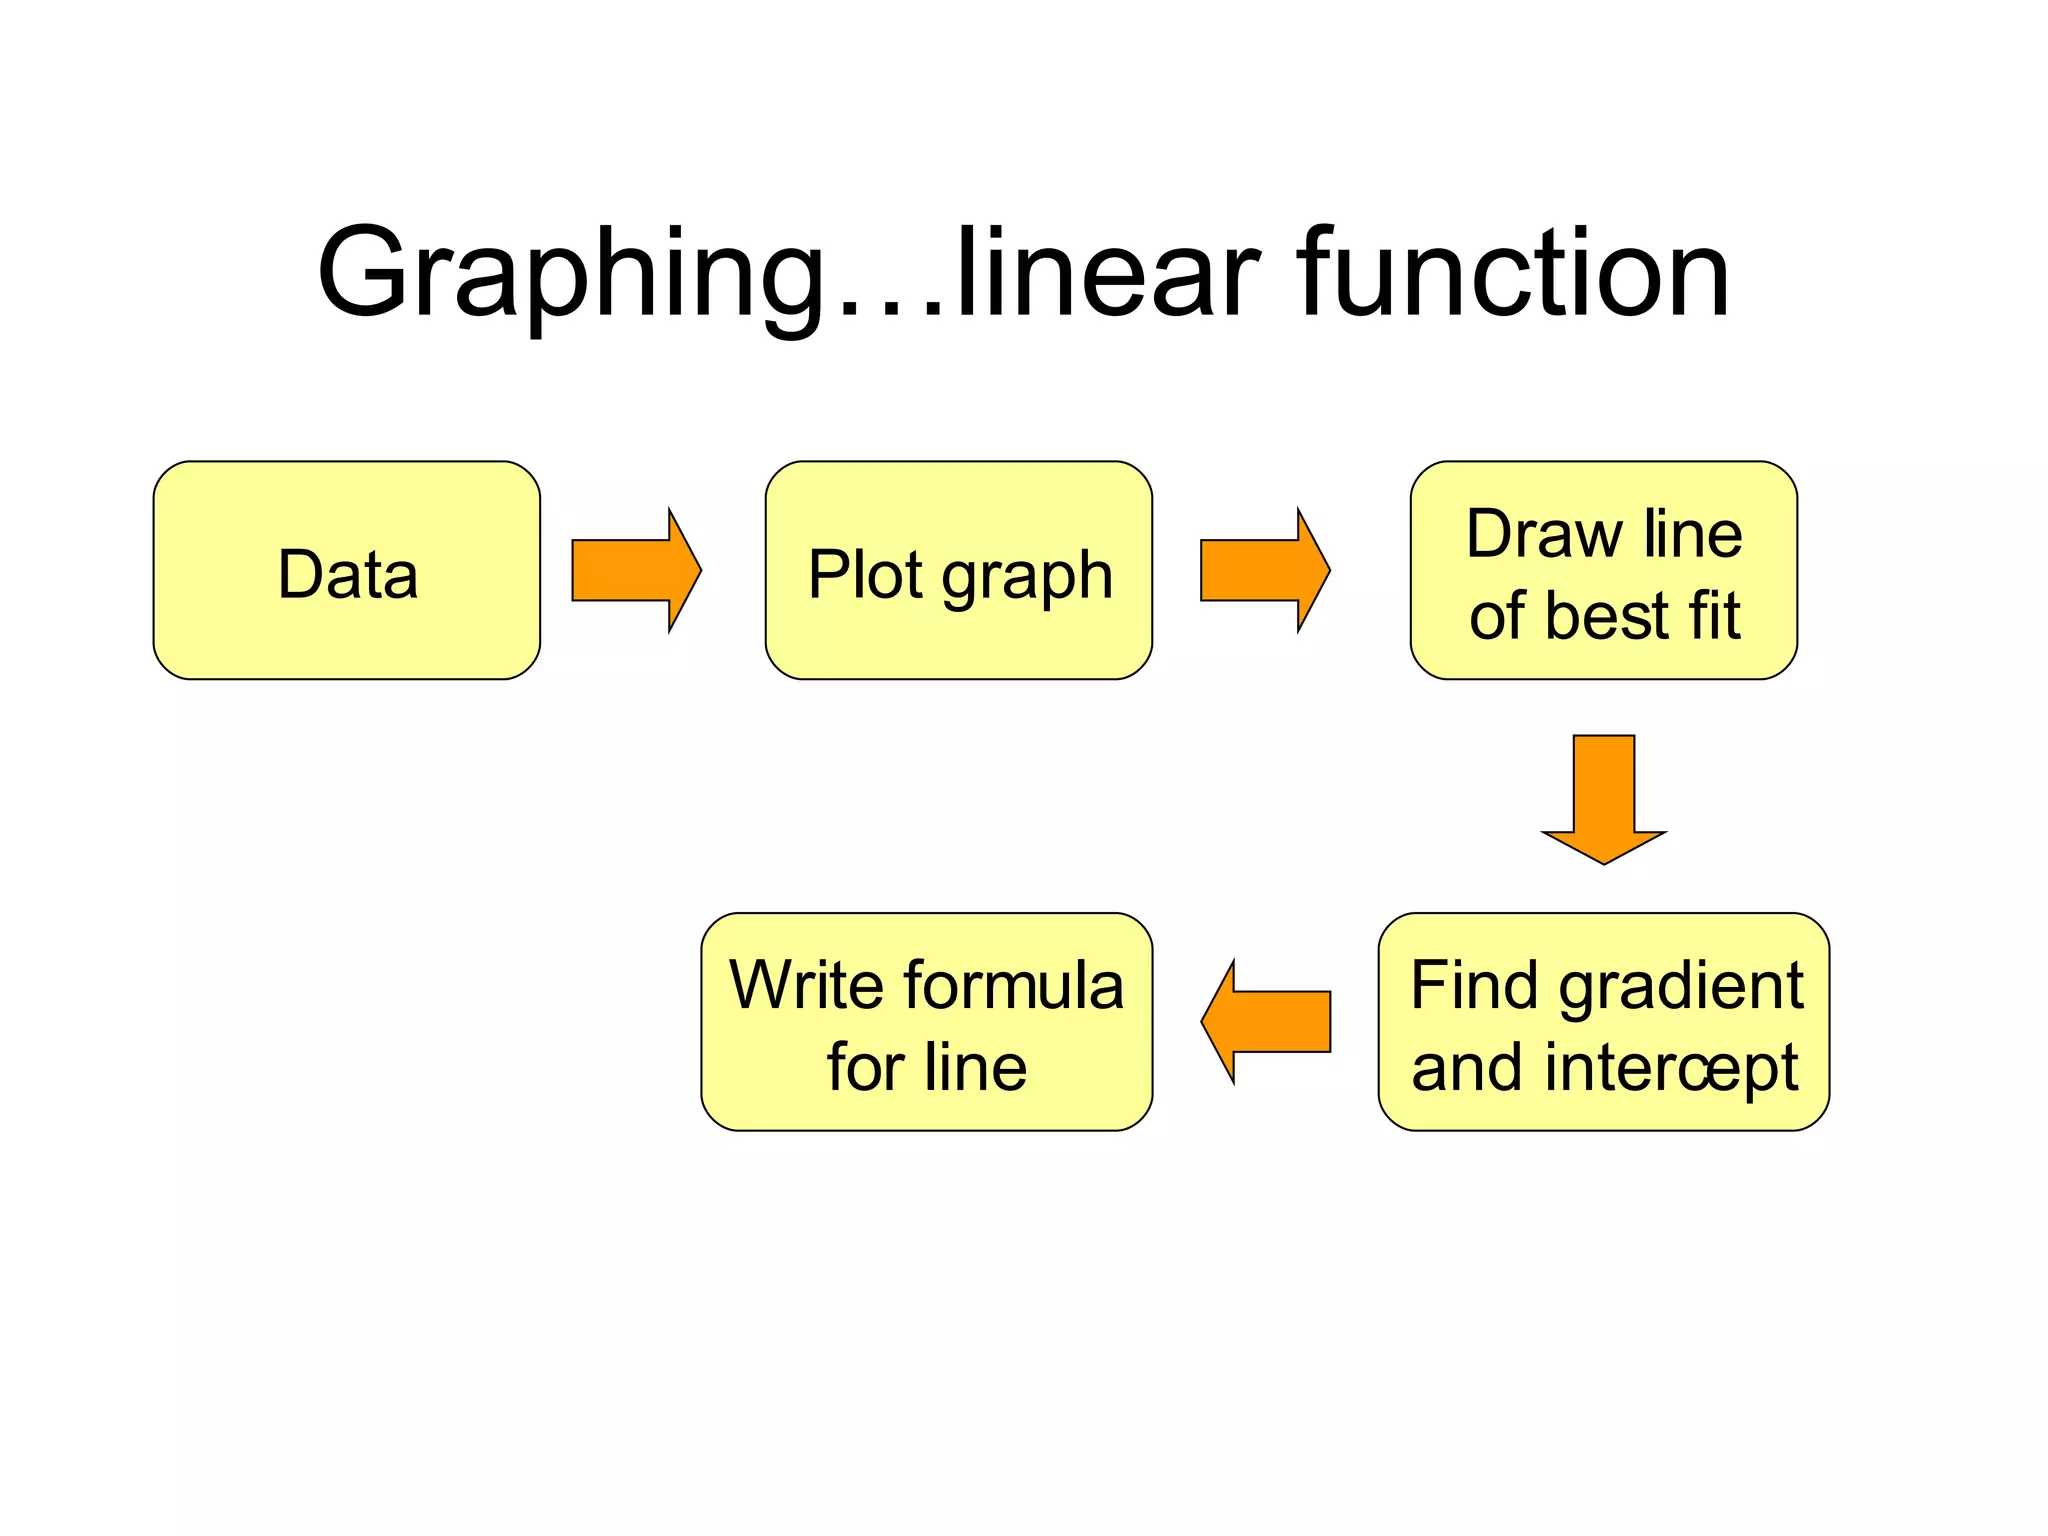
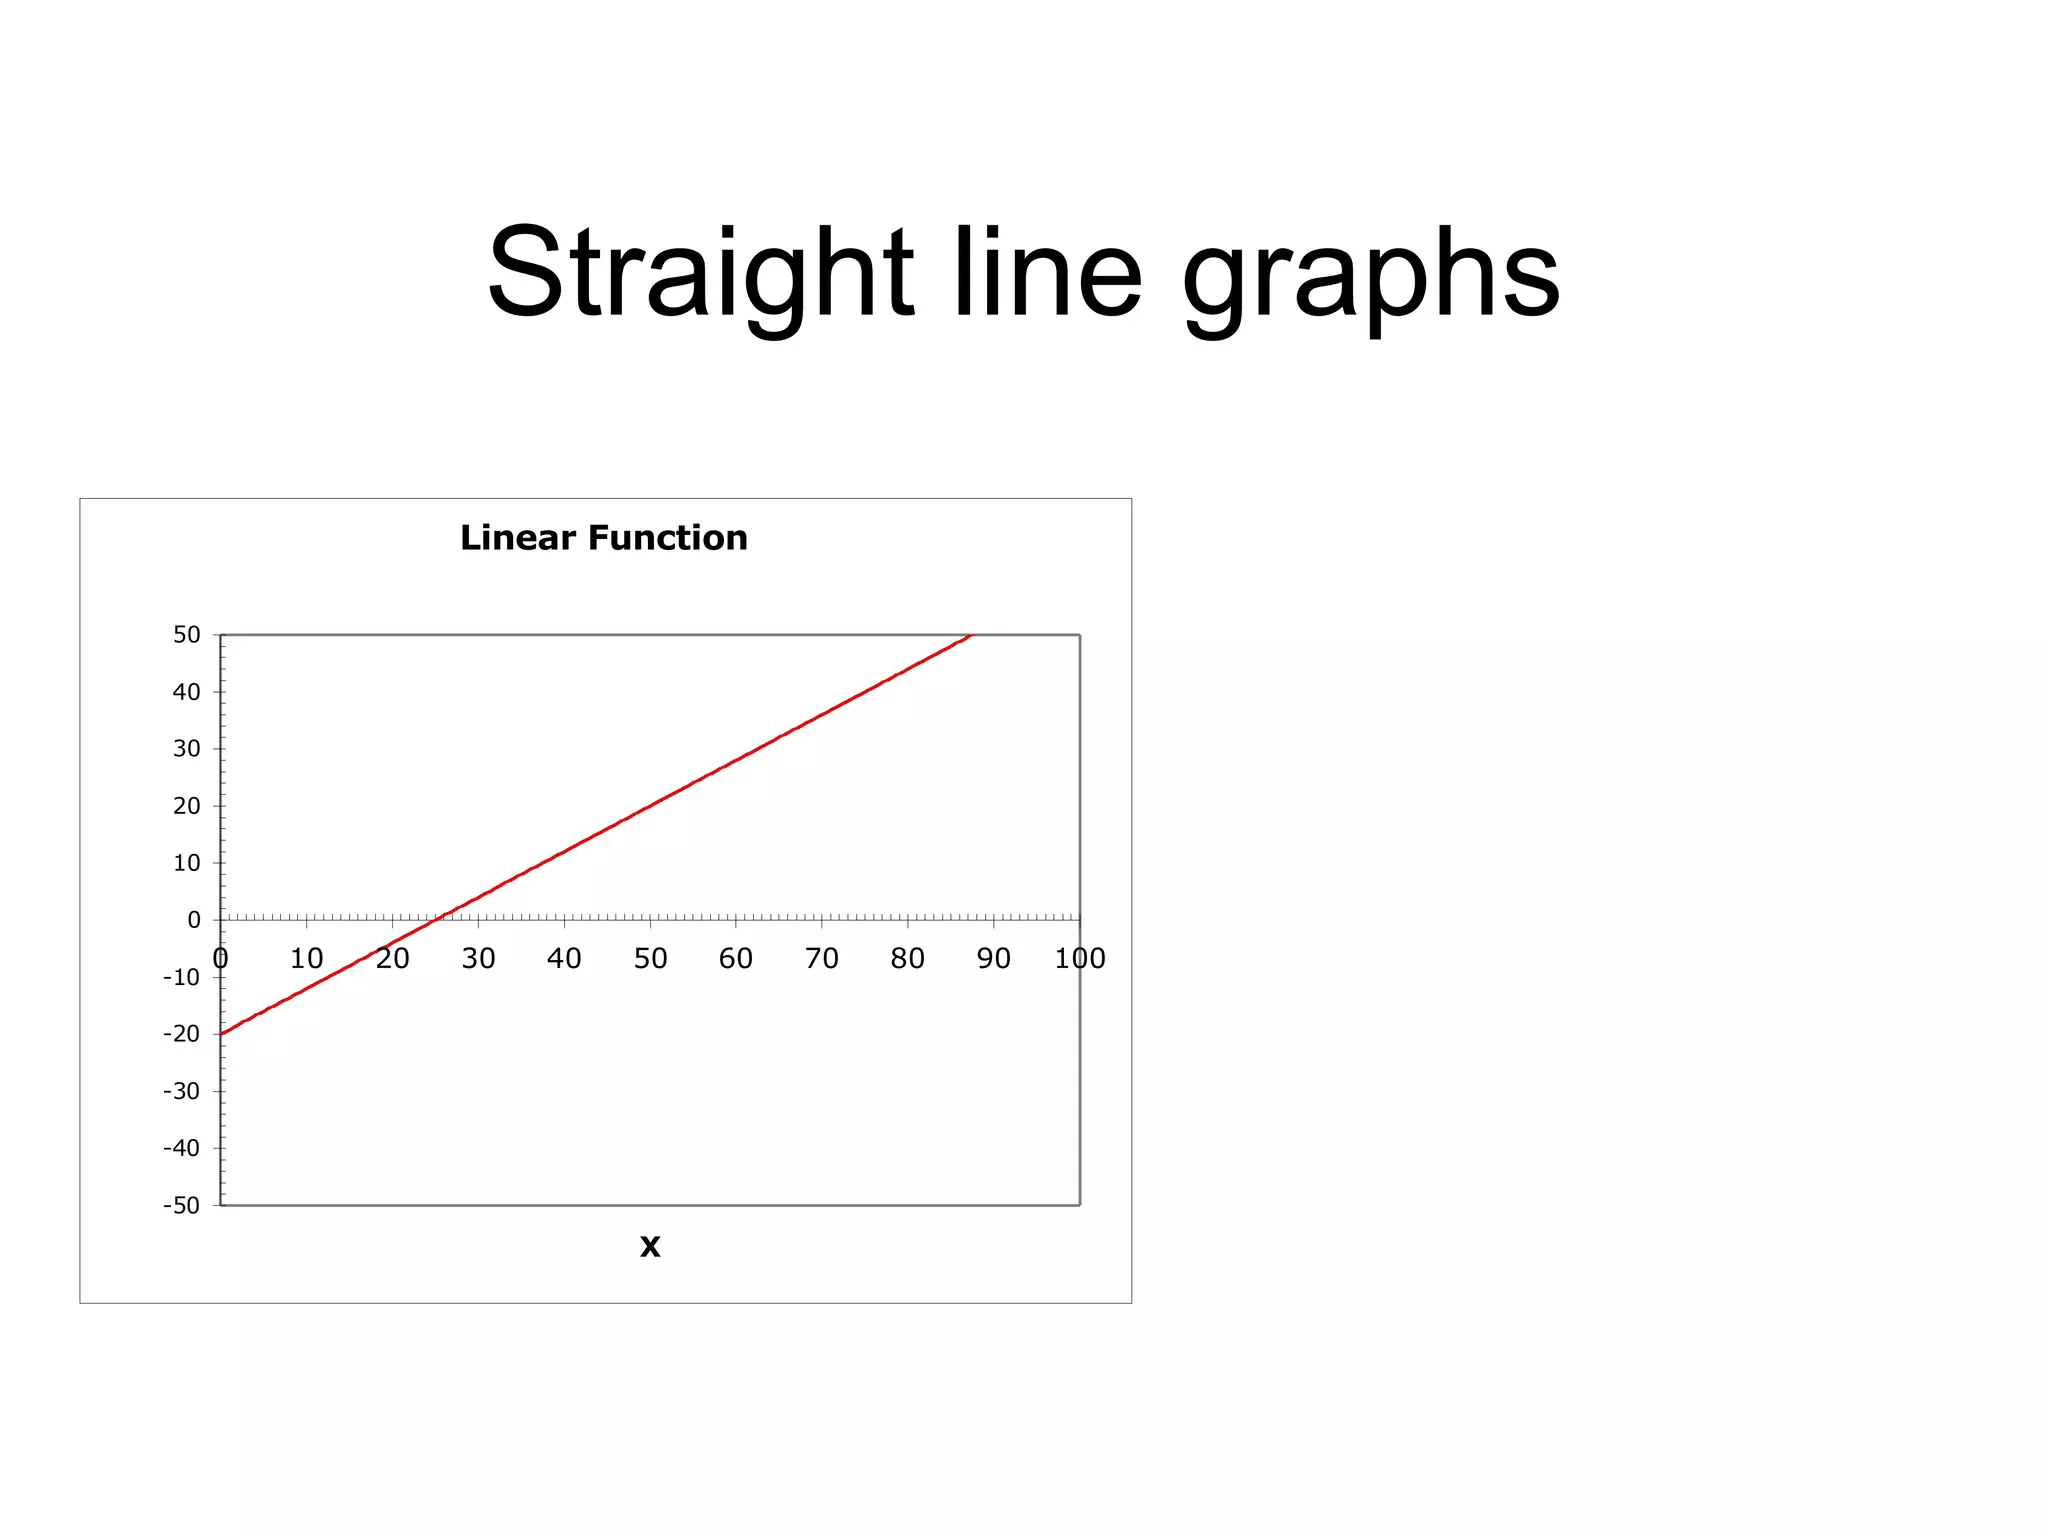
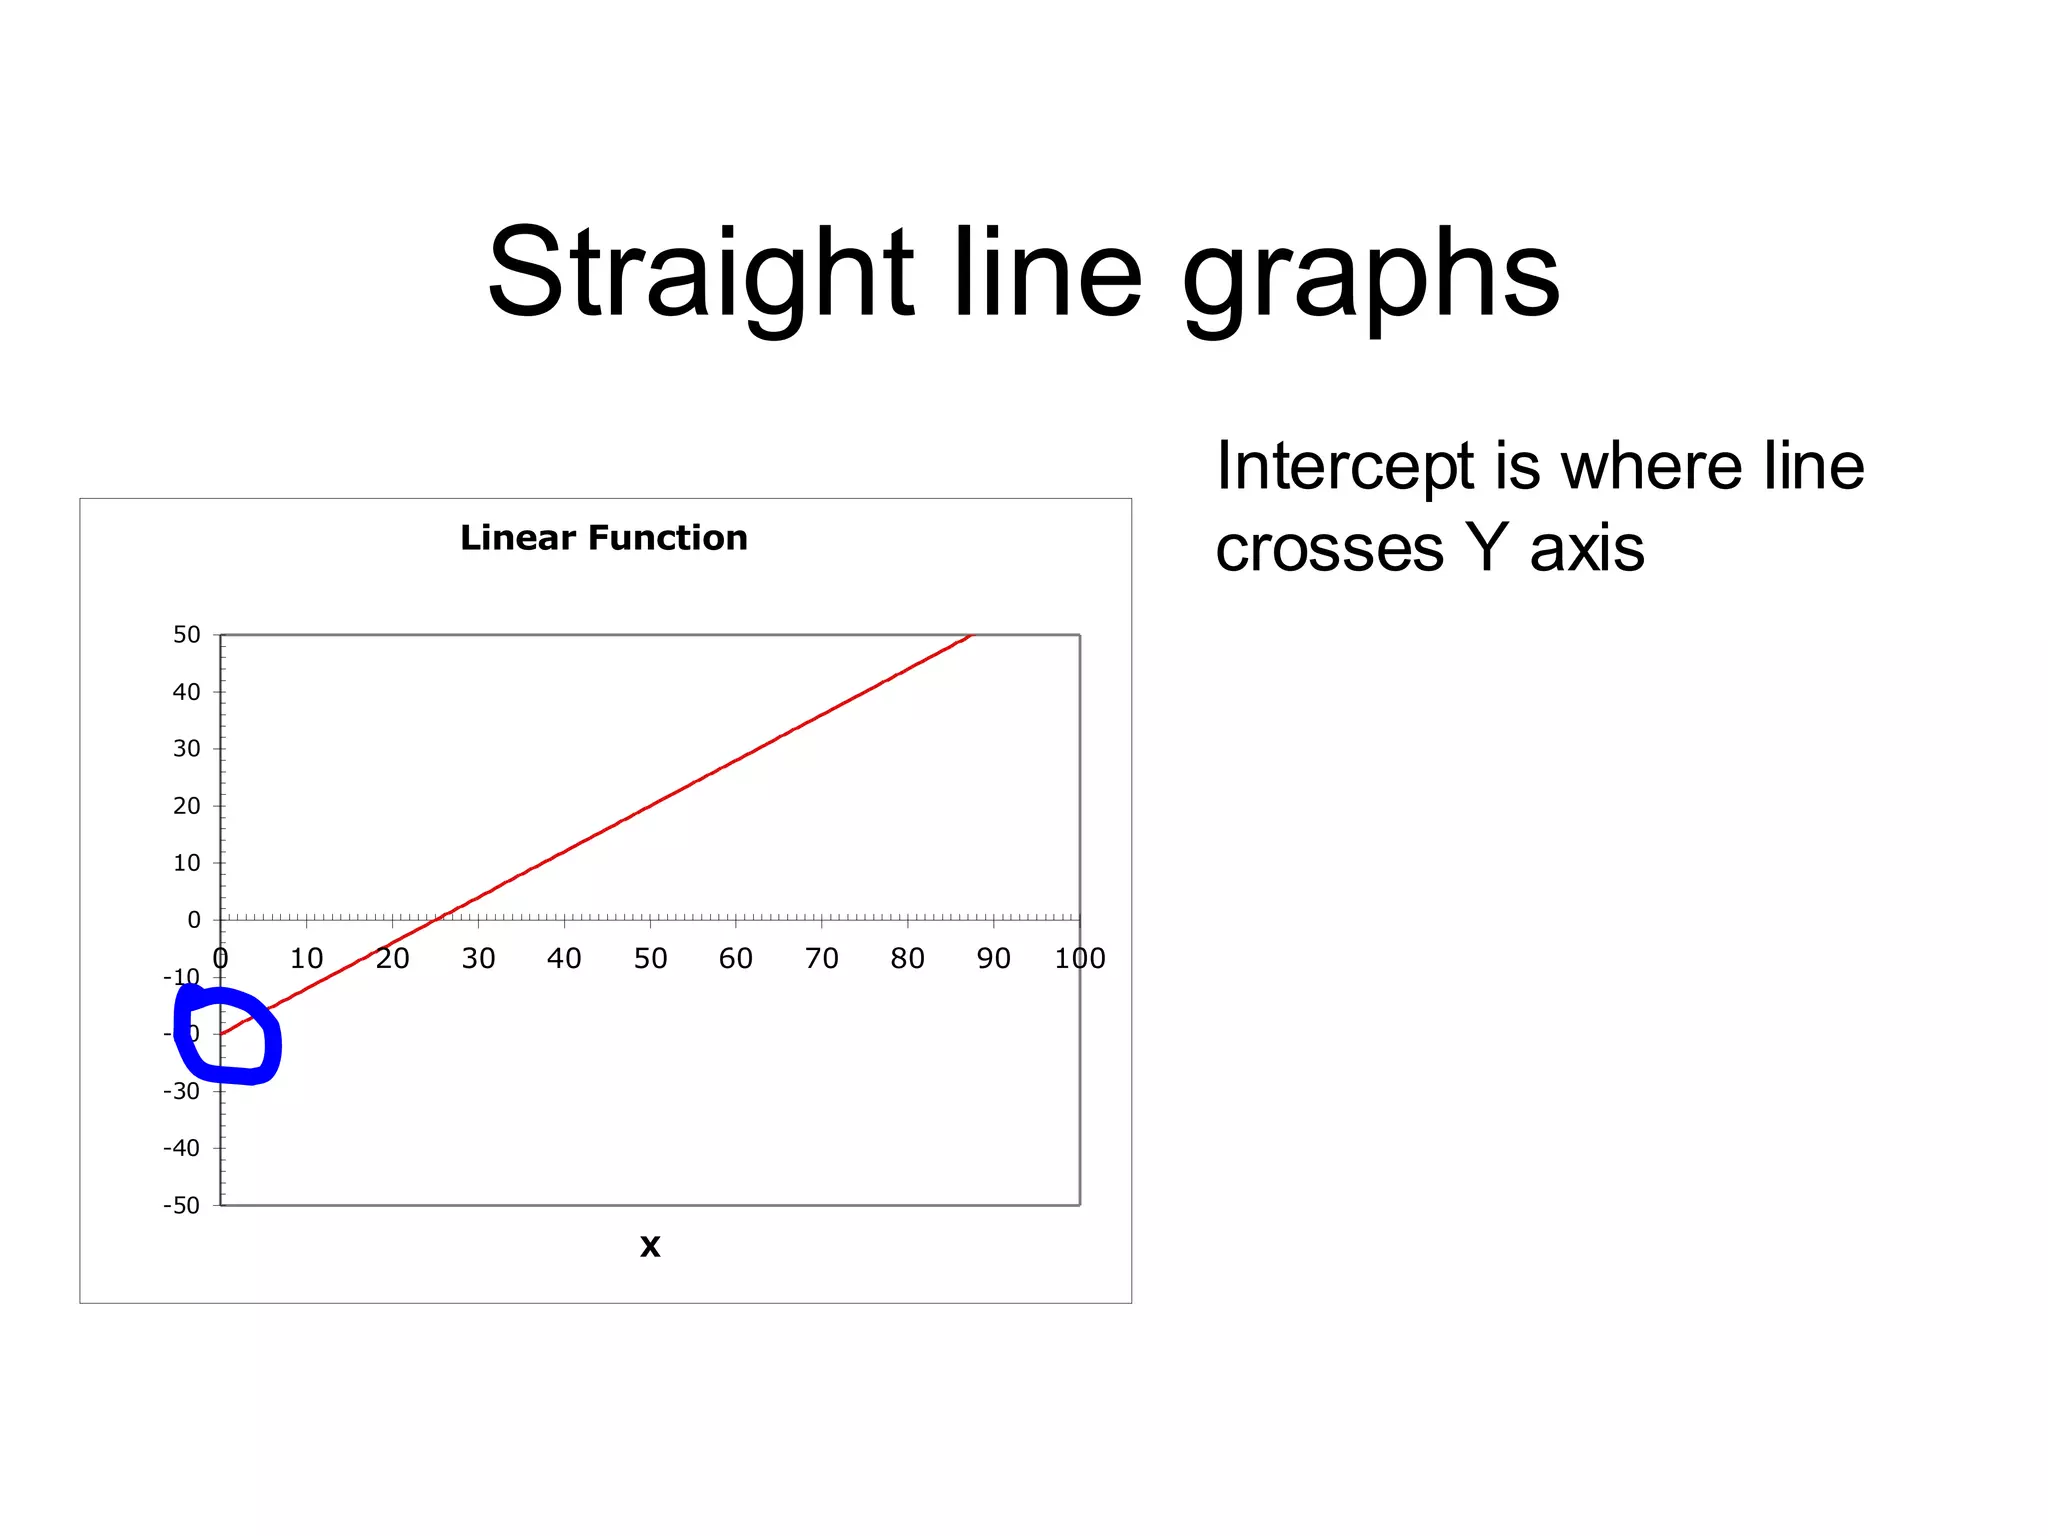
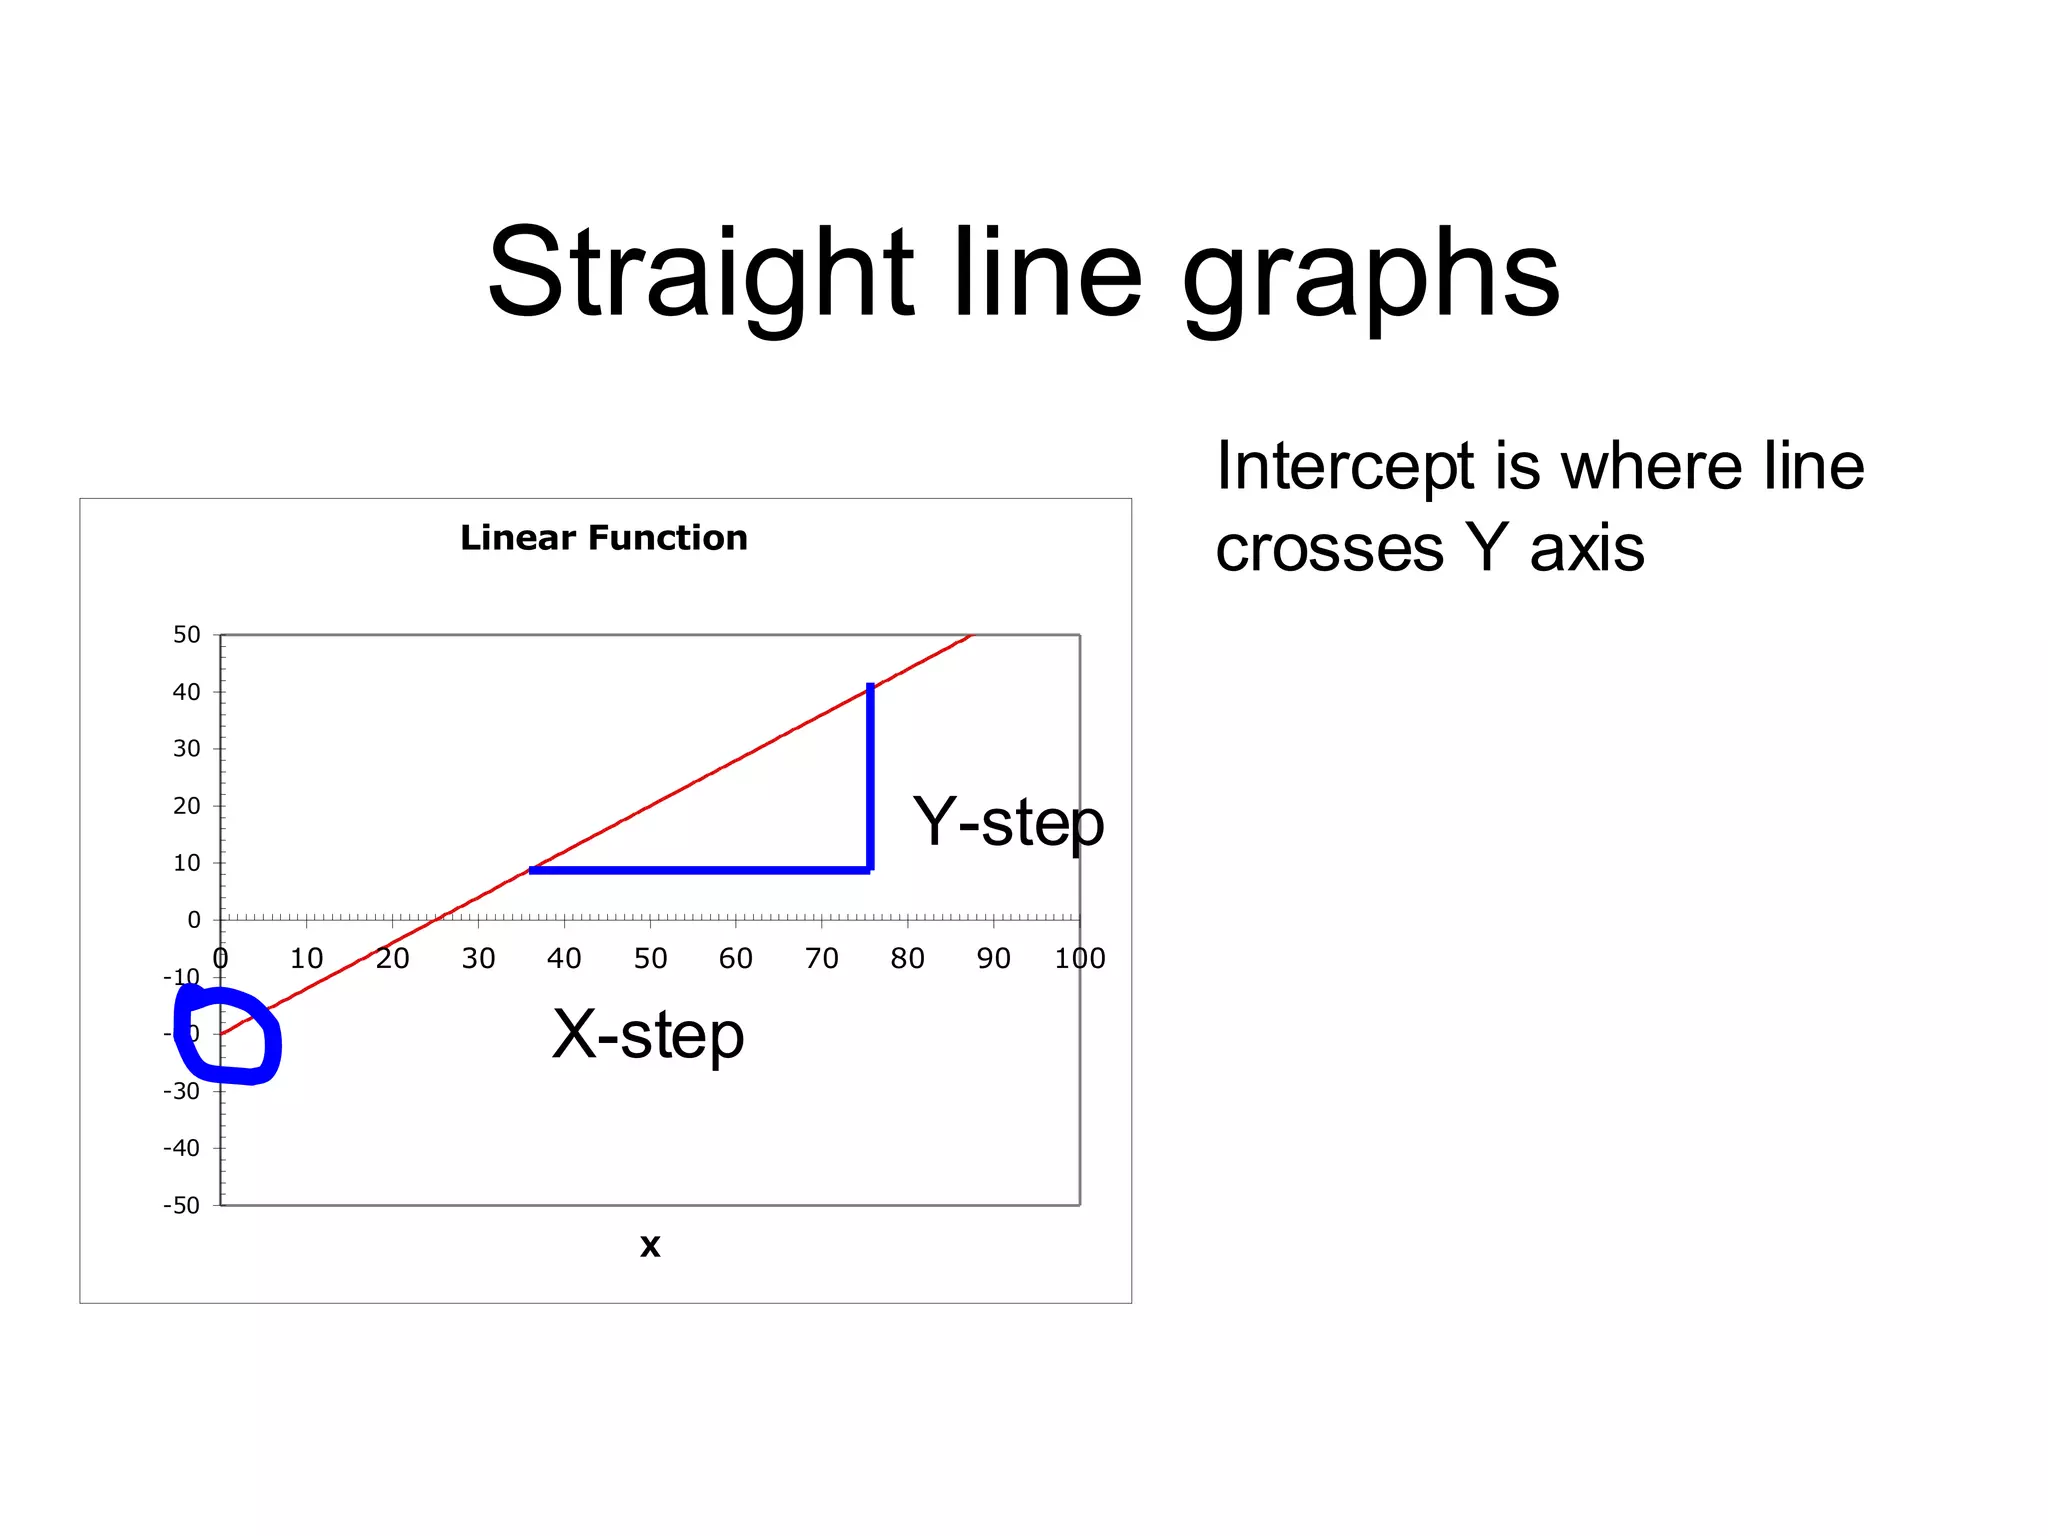
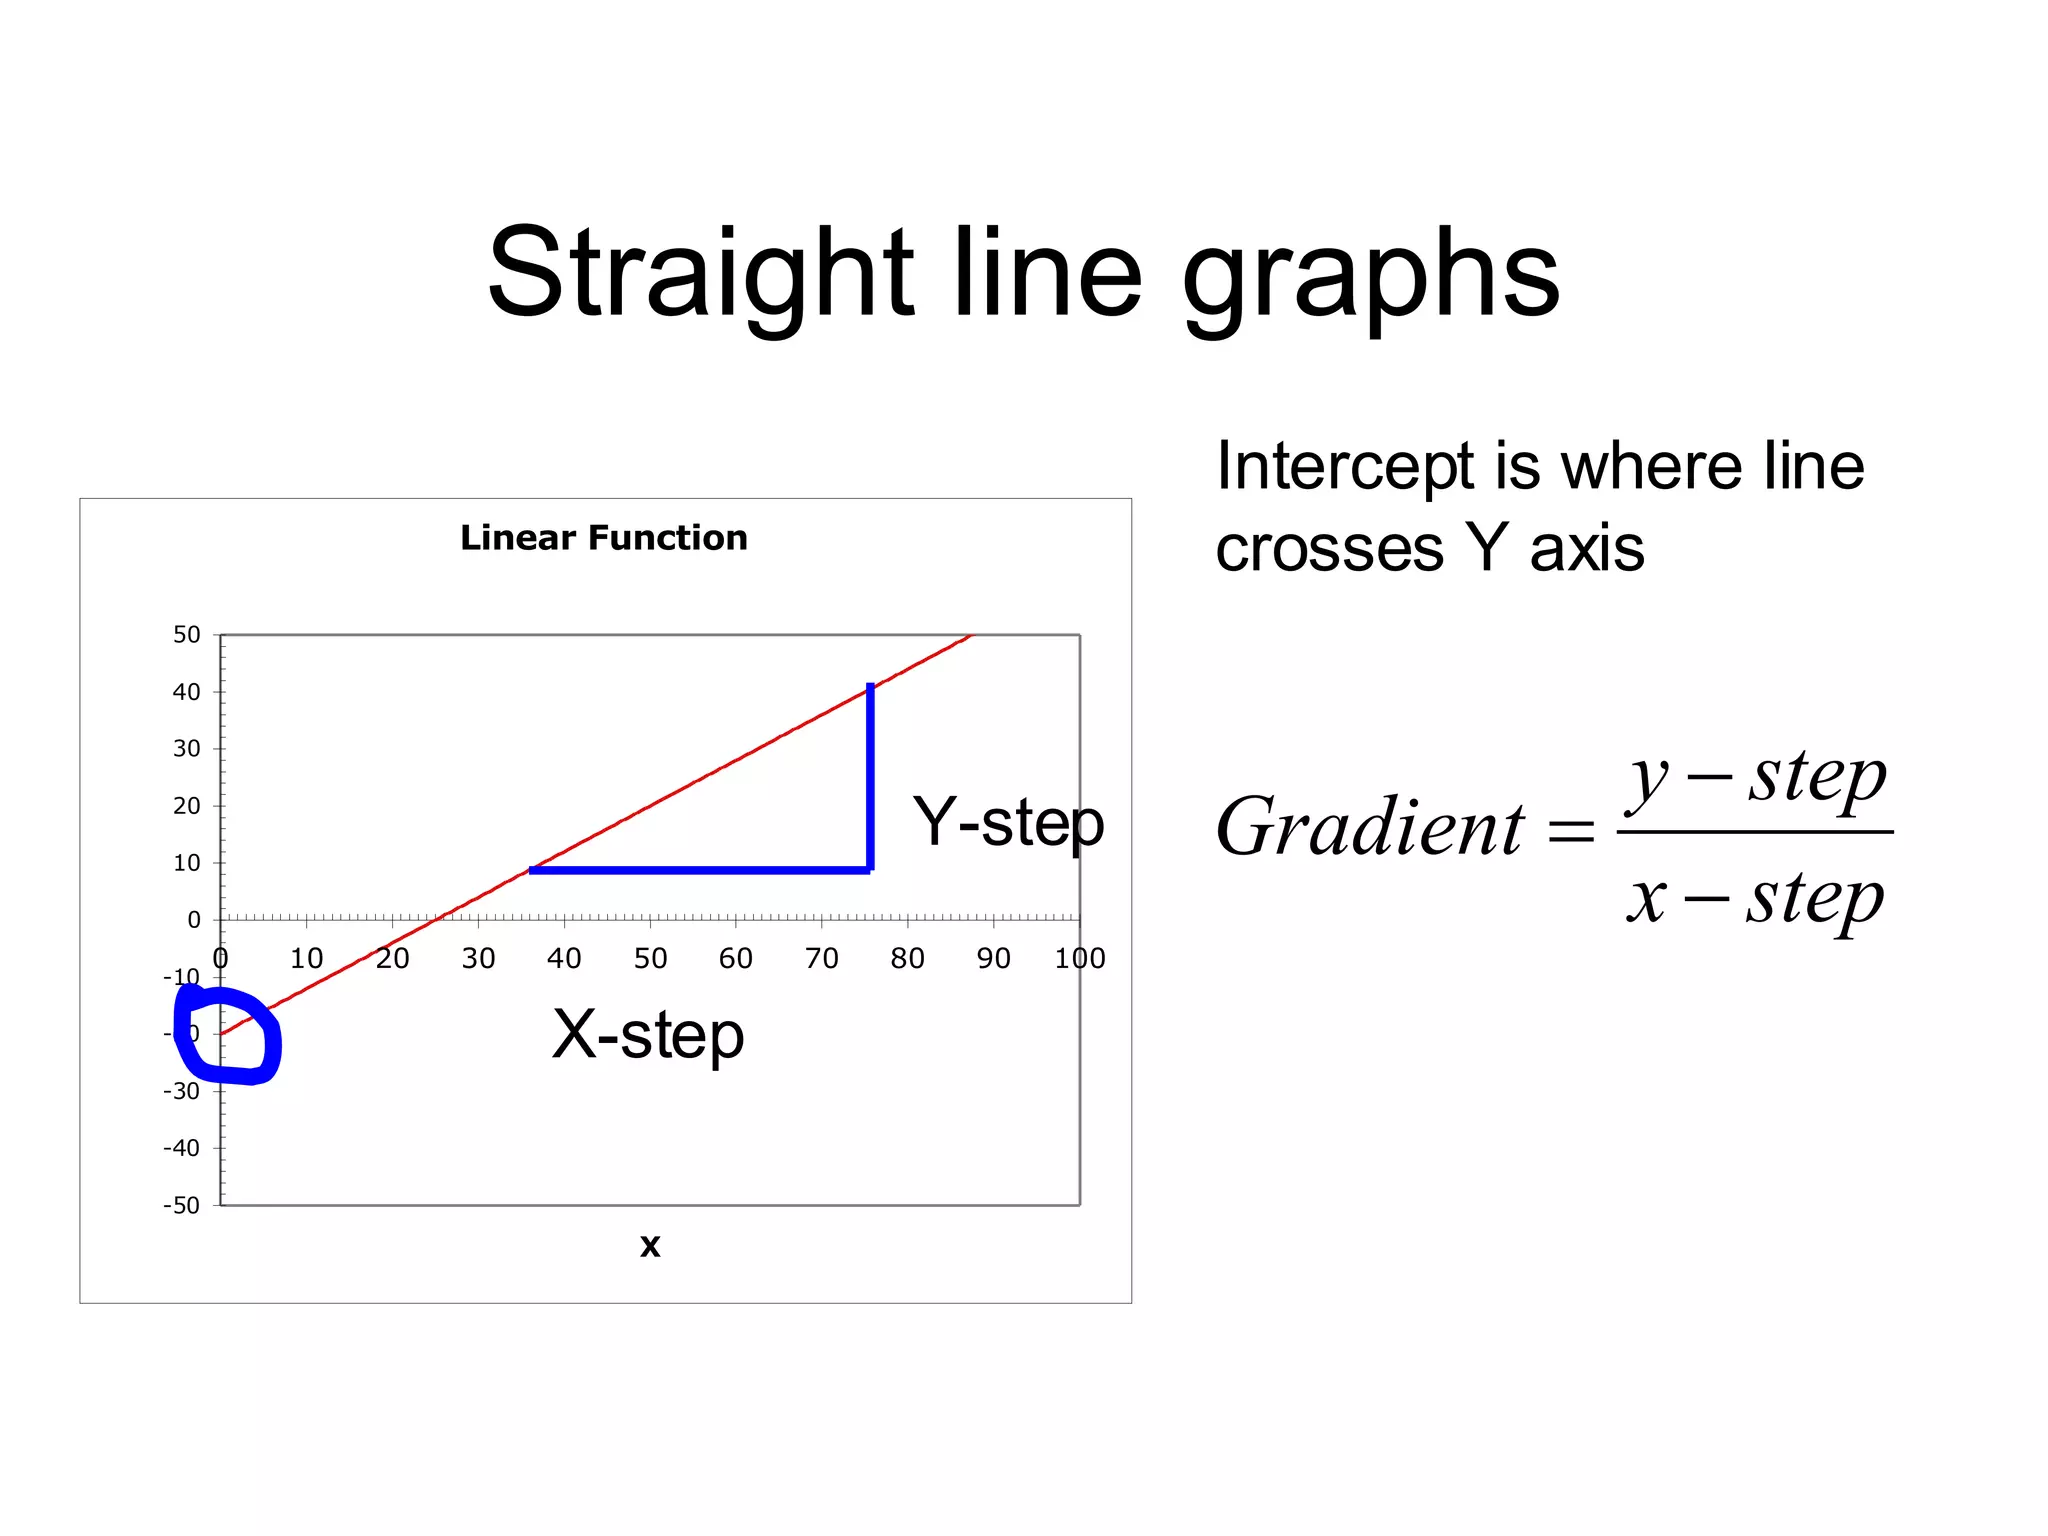
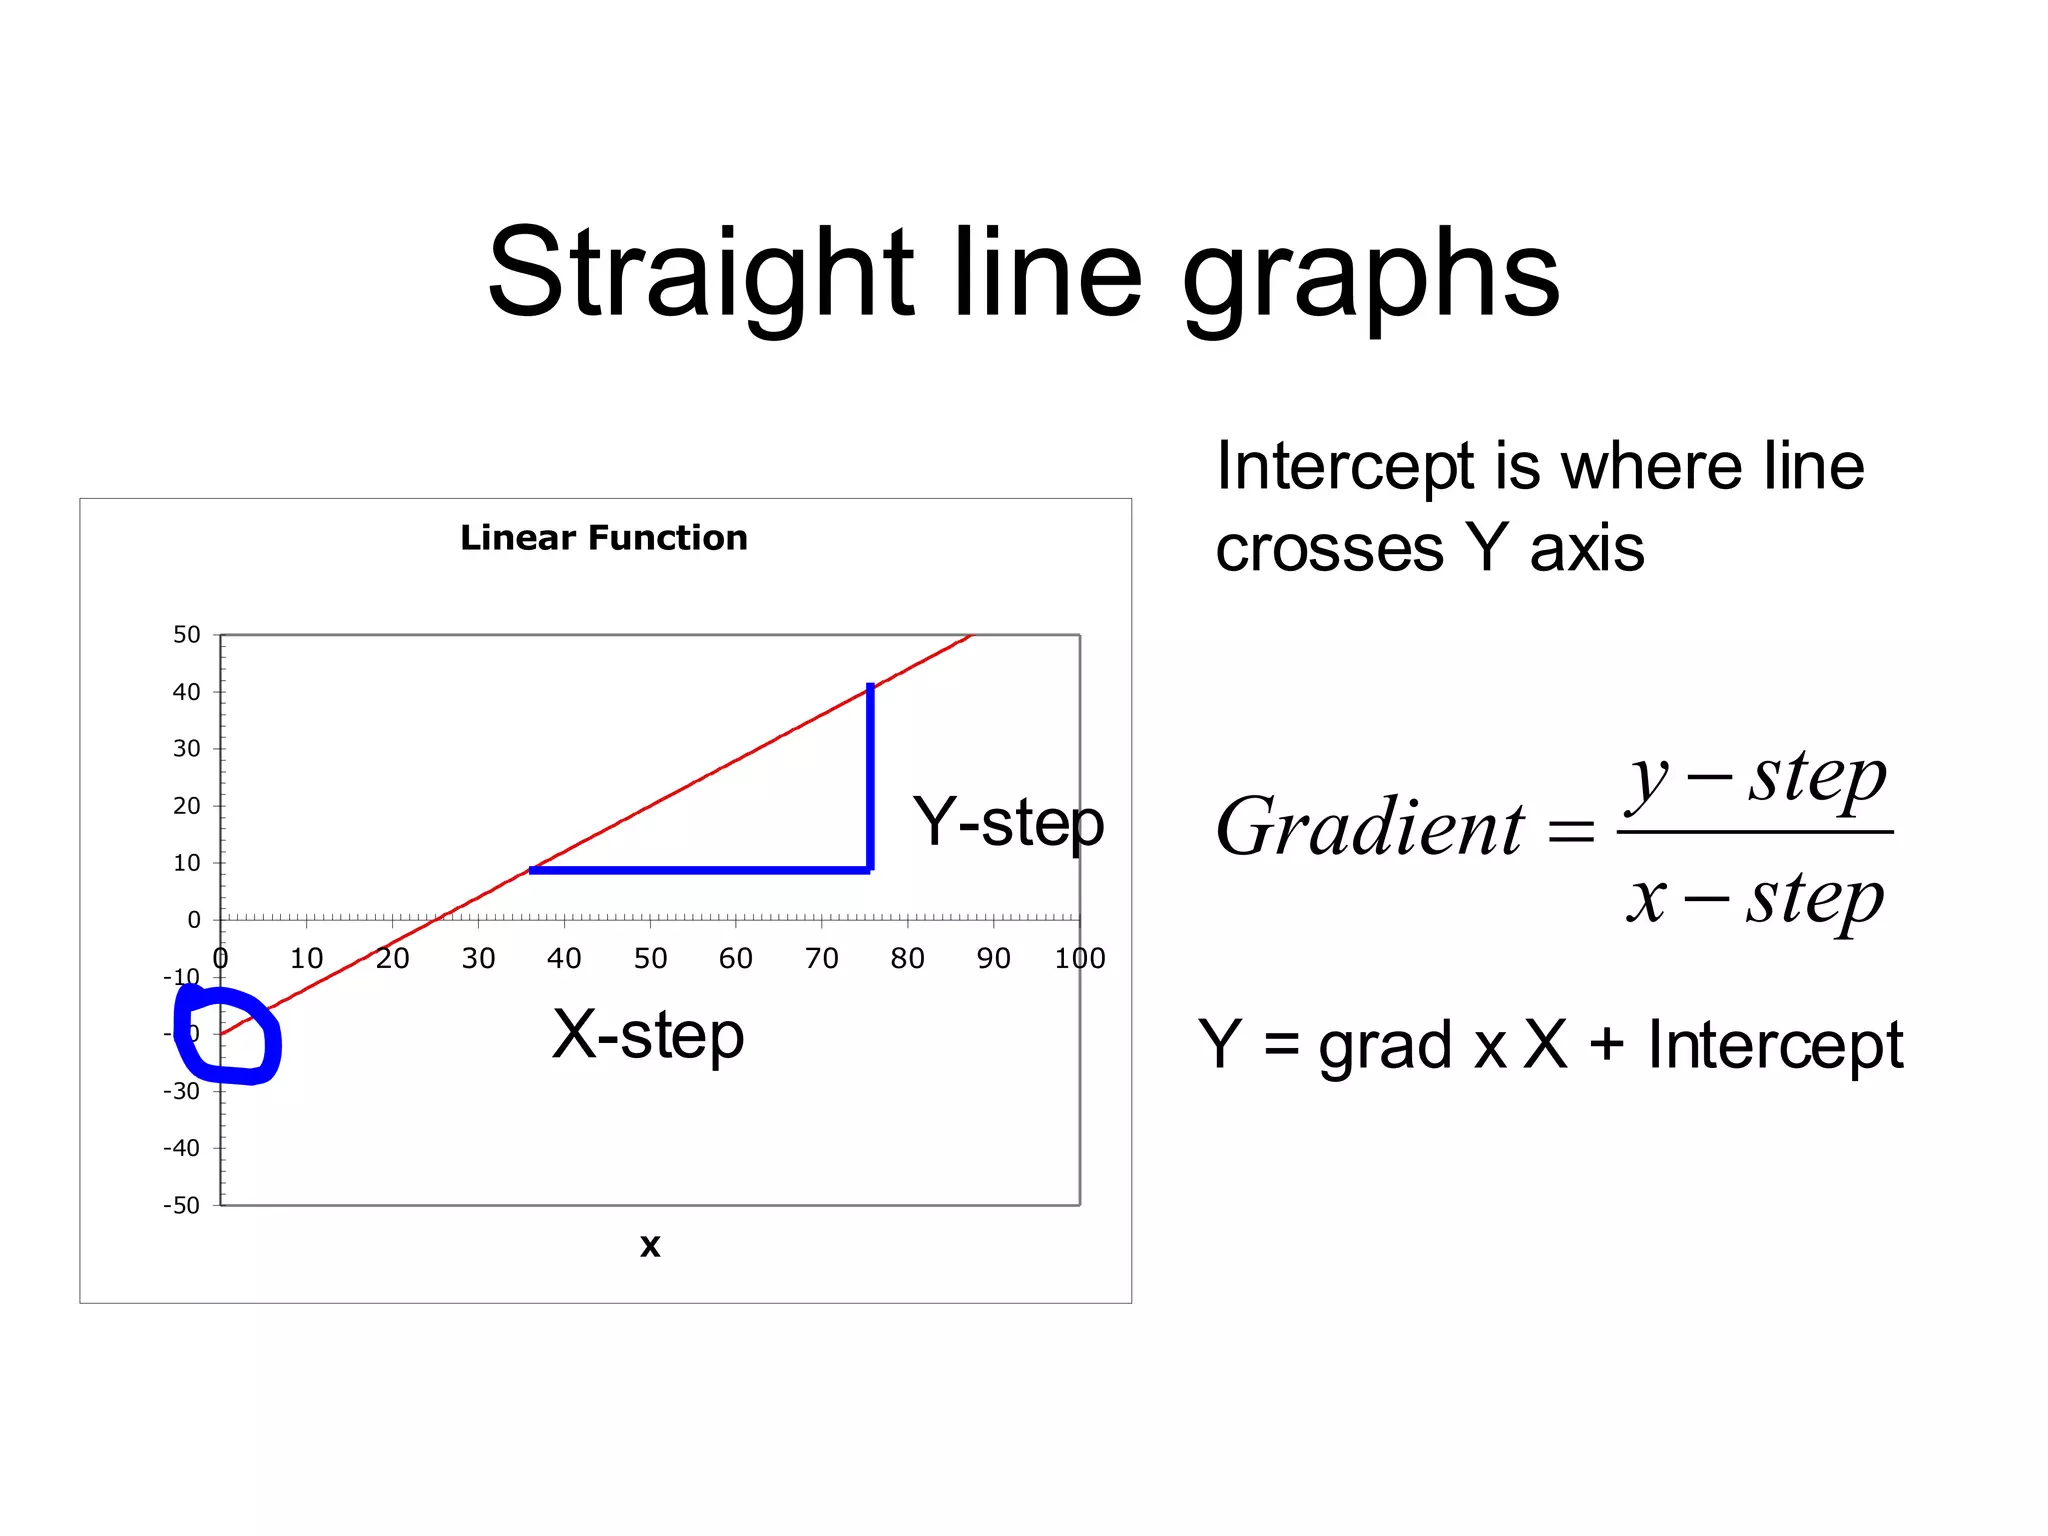
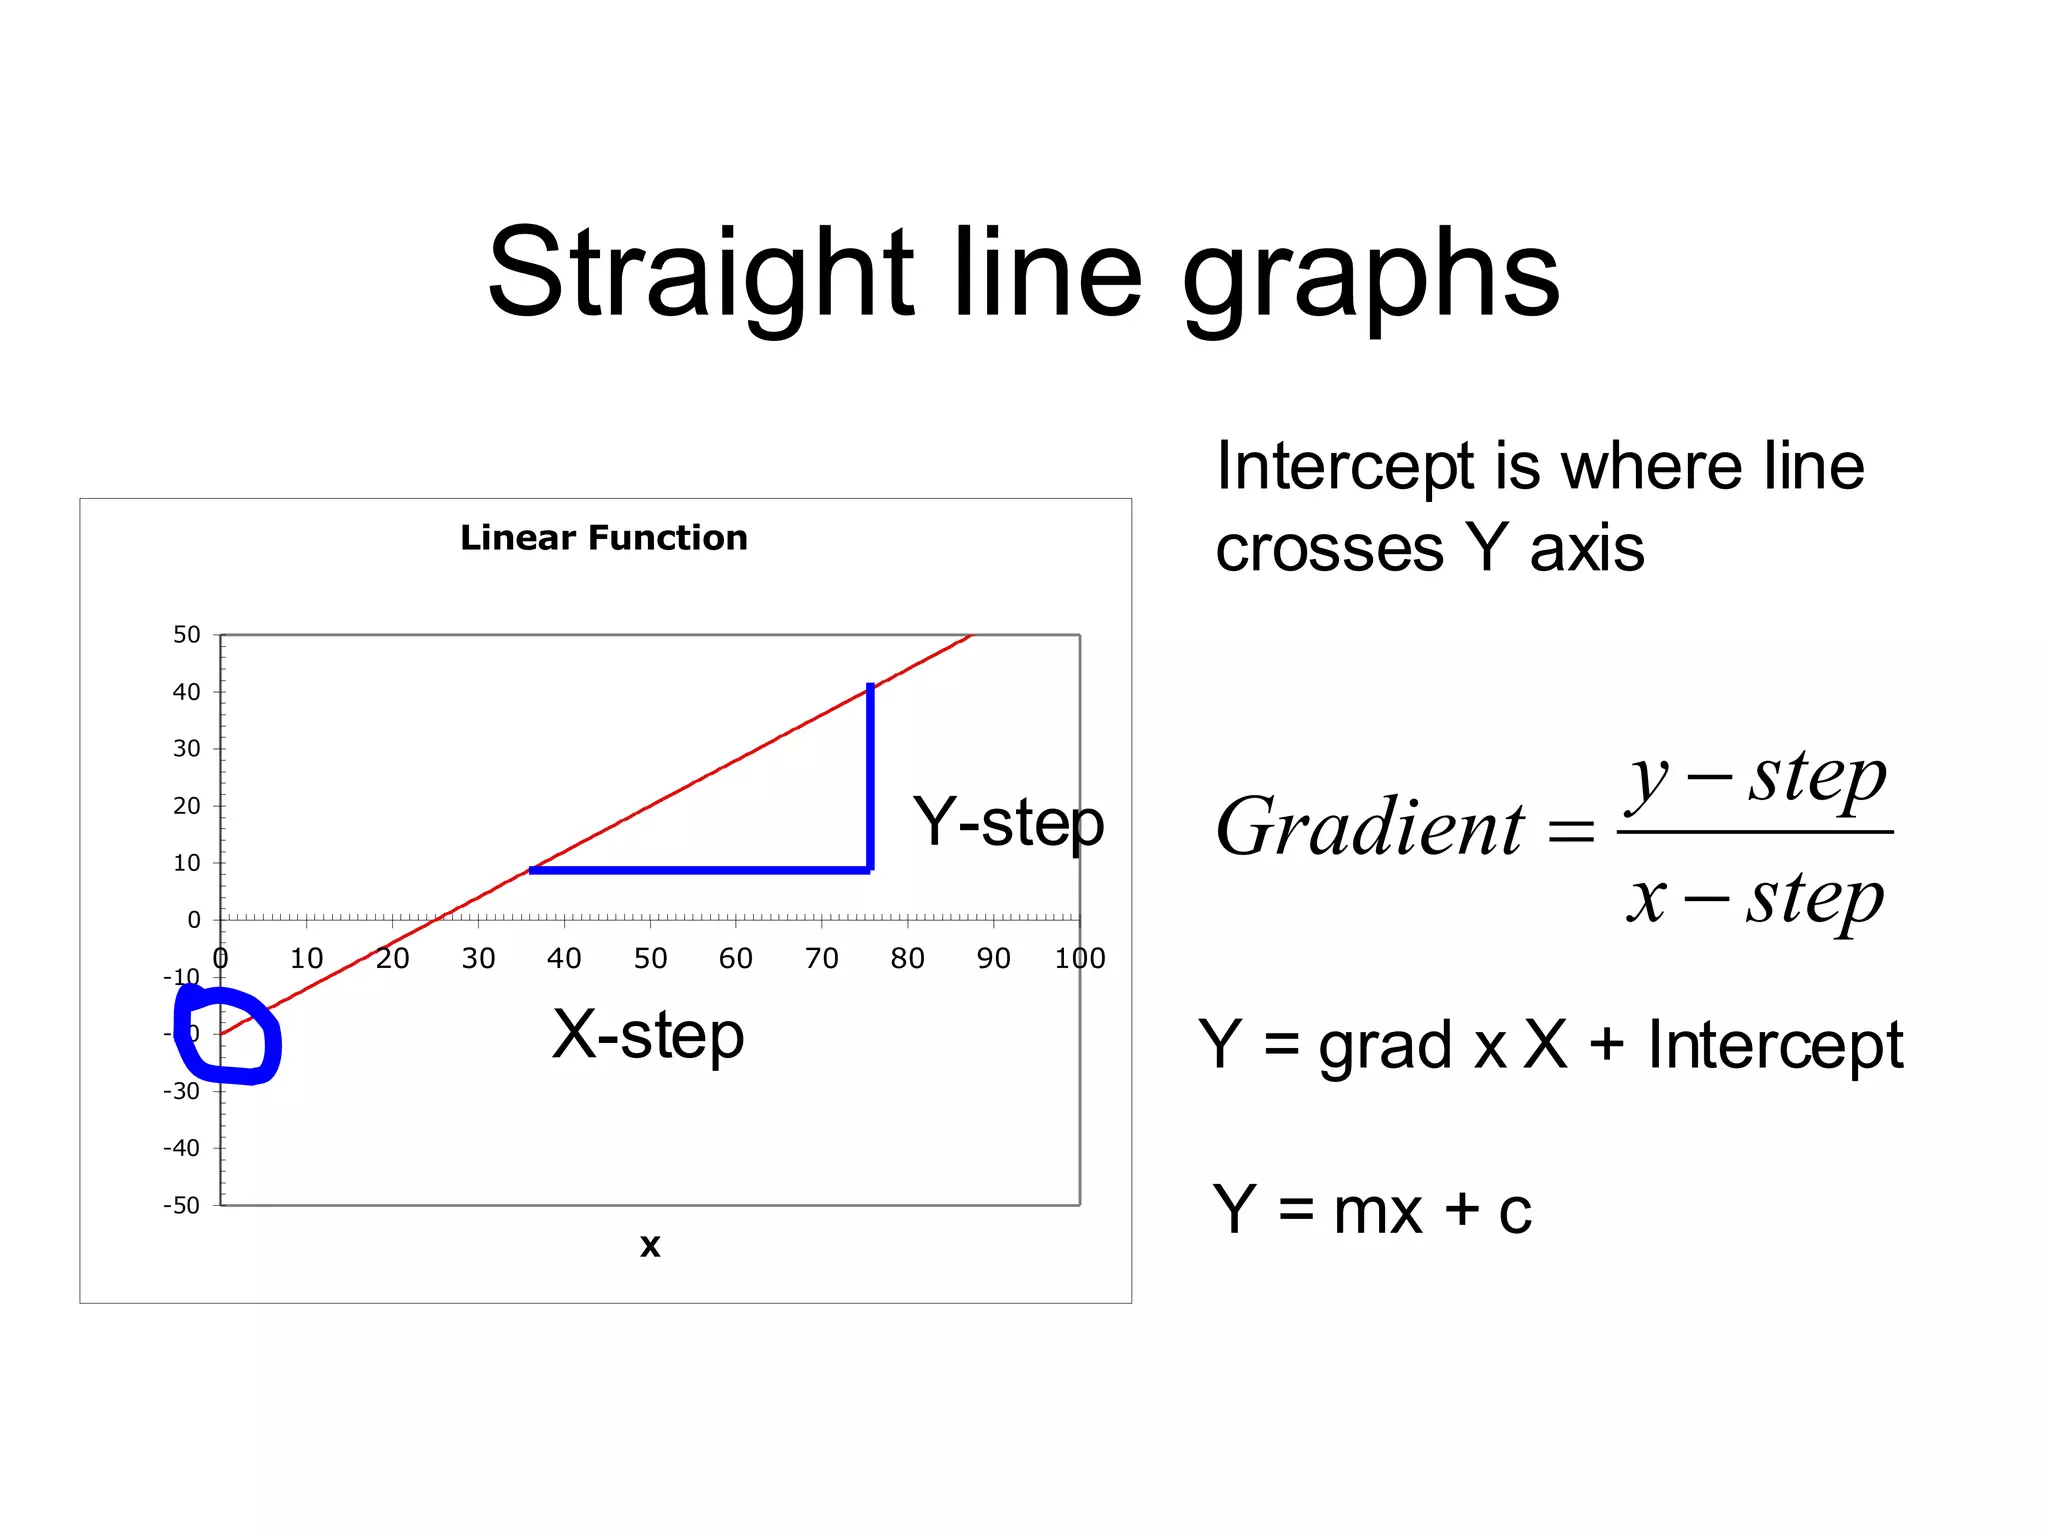

This document discusses how to graph and find the equation of a linear function from a set of data points. It explains that you should plot the points on a graph, draw the line of best fit, and then find the gradient and y-intercept in order to write the equation in y = mx + c form, with the intercept being where the line crosses the y-axis.


![Vibe Coding vs. Spec-Driven Development [Free Meetup]](https://cdn.slidesharecdn.com/ss_thumbnails/vibecodingvsspecdrivendevelopment-251209105622-43f455e7-thumbnail.jpg?width=640&height=640&fit=bounds)


