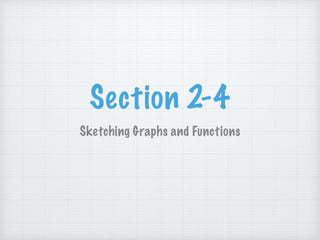
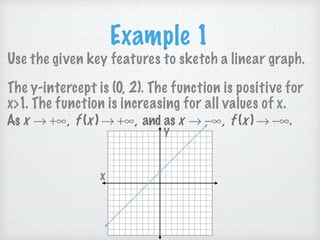
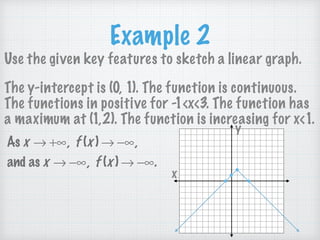
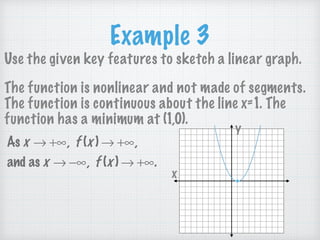
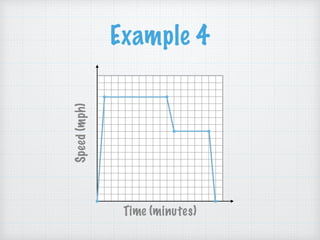
Section 2-4
Sketching Graphs and Functions
Essential Questions
• How do you use the key features of functions to
sketch graphs of linear functions?
• How do you use the key features of functions to
sketch graphs of nonlinear functions?
Example 1
As x → +∞, f (x ) → +∞, and as x → −∞, f (x ) → −∞.
Use the given key features to sketch a linear graph.
The y-intercept is (0, 2). The function is positive for
x>1. The function is increasing for all values of x.
x
y
Example 2
As x → +∞, f (x ) → −∞,
and as x → −∞, f (x ) → −∞.
Use the given key features to sketch a linear graph.
The y-intercept is (0, 1). The function is continuous.
The functions in positive for -1<x<3. The function has
a maximum at (1,2). The function is increasing for x<1.
x
y
Example 3
As x → +∞, f (x ) → +∞,
and as x → −∞, f (x ) → +∞.
Use the given key features to sketch a linear graph.
The function is nonlinear and not made of segments.
The function is continuous about the line x=1. The
function has a minimum at (1,0).
x
y
Example 4
Use the given key features to sketch a graph. Maggie
Brann goes for a bike ride on a bike path near her house. 

y-intercept: Maggie starts at 0 mph. 

Linear or nonlinear: The function that models the situation
is nonlinear.

Extrema: Maggie’s maximum speed is 15 mph, which she
reaches 1 minute after starting her bike ride.

Increasing: Maggie’s speed increases steadily for the first
minute.

Decreasing: At the 10-minute mark, Maggie decreases her
speed for 1 minute, then she stays at 10 mph for 5
minutes. At the 16-minute mark, she again decreases her
speed for 1 minute until she reaches a stop.
Example 4
Time (minutes)
Speed(mph)

Algebra 2 Section 2-4

  • 1.
  • 2.
    Essential Questions • Howdo you use the key features of functions to sketch graphs of linear functions? • How do you use the key features of functions to sketch graphs of nonlinear functions?
  • 3.
    Example 1 As x→ +∞, f (x ) → +∞, and as x → −∞, f (x ) → −∞. Use the given key features to sketch a linear graph. The y-intercept is (0, 2). The function is positive for x>1. The function is increasing for all values of x. x y
  • 4.
    Example 2 As x→ +∞, f (x ) → −∞, and as x → −∞, f (x ) → −∞. Use the given key features to sketch a linear graph. The y-intercept is (0, 1). The function is continuous. The functions in positive for -1<x<3. The function has a maximum at (1,2). The function is increasing for x<1. x y
  • 5.
    Example 3 As x→ +∞, f (x ) → +∞, and as x → −∞, f (x ) → +∞. Use the given key features to sketch a linear graph. The function is nonlinear and not made of segments. The function is continuous about the line x=1. The function has a minimum at (1,0). x y
  • 6.
    Example 4 Use thegiven key features to sketch a graph. Maggie Brann goes for a bike ride on a bike path near her house. 
 y-intercept: Maggie starts at 0 mph. 
 Linear or nonlinear: The function that models the situation is nonlinear.
 Extrema: Maggie’s maximum speed is 15 mph, which she reaches 1 minute after starting her bike ride.
 Increasing: Maggie’s speed increases steadily for the first minute.
 Decreasing: At the 10-minute mark, Maggie decreases her speed for 1 minute, then she stays at 10 mph for 5 minutes. At the 16-minute mark, she again decreases her speed for 1 minute until she reaches a stop.
  • 7.