Download to read offline


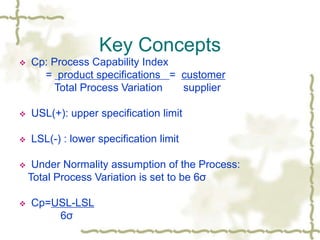

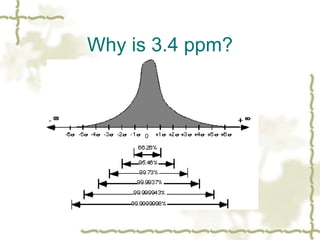
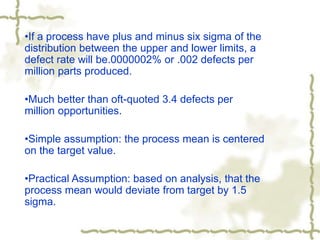
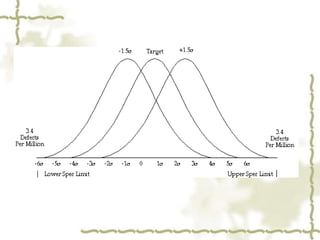
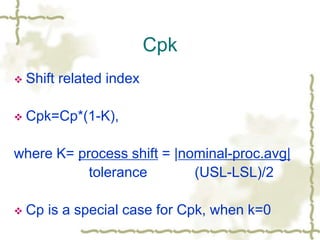
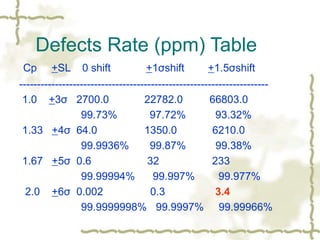

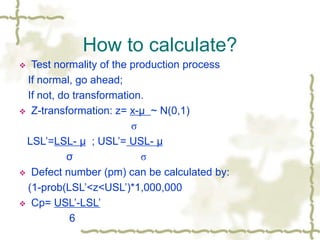

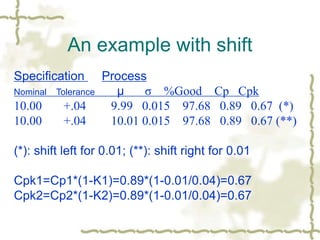


- Six Sigma is a quality methodology that aims for near perfection with 3.4 defects per million opportunities. It was developed by Motorola in 1987. - Key concepts include process capability index (Cp), process variation, and specification limits. A Cp of 2.0 or higher is needed to achieve Six Sigma quality. - The DMAIC methodology is used for improving existing processes and focuses on defining problems, measuring processes, analyzing causes, improving processes, and controlling future performance. DFSS designs new processes at Six Sigma quality levels using approaches like DMADV.


![Rodebaugh sixsigma[1]](https://cdn.slidesharecdn.com/ss_thumbnails/rodebaugh-sixsigma1-191102025225-thumbnail.jpg?width=640&height=640&fit=bounds)


