Downloaded 79 times
![Cpk A Guide to Using Cpk
a Process Capability Index
LSL
Cpk = Min [ U S L , ] _ X X _LSL
3s 3s
Specification Width
Process Spread
X USL](https://image.slidesharecdn.com/cpkguide0211tech1-141107003933-conversion-gate01/75/Cpk-guide-0211_tech1-1-2048.jpg)

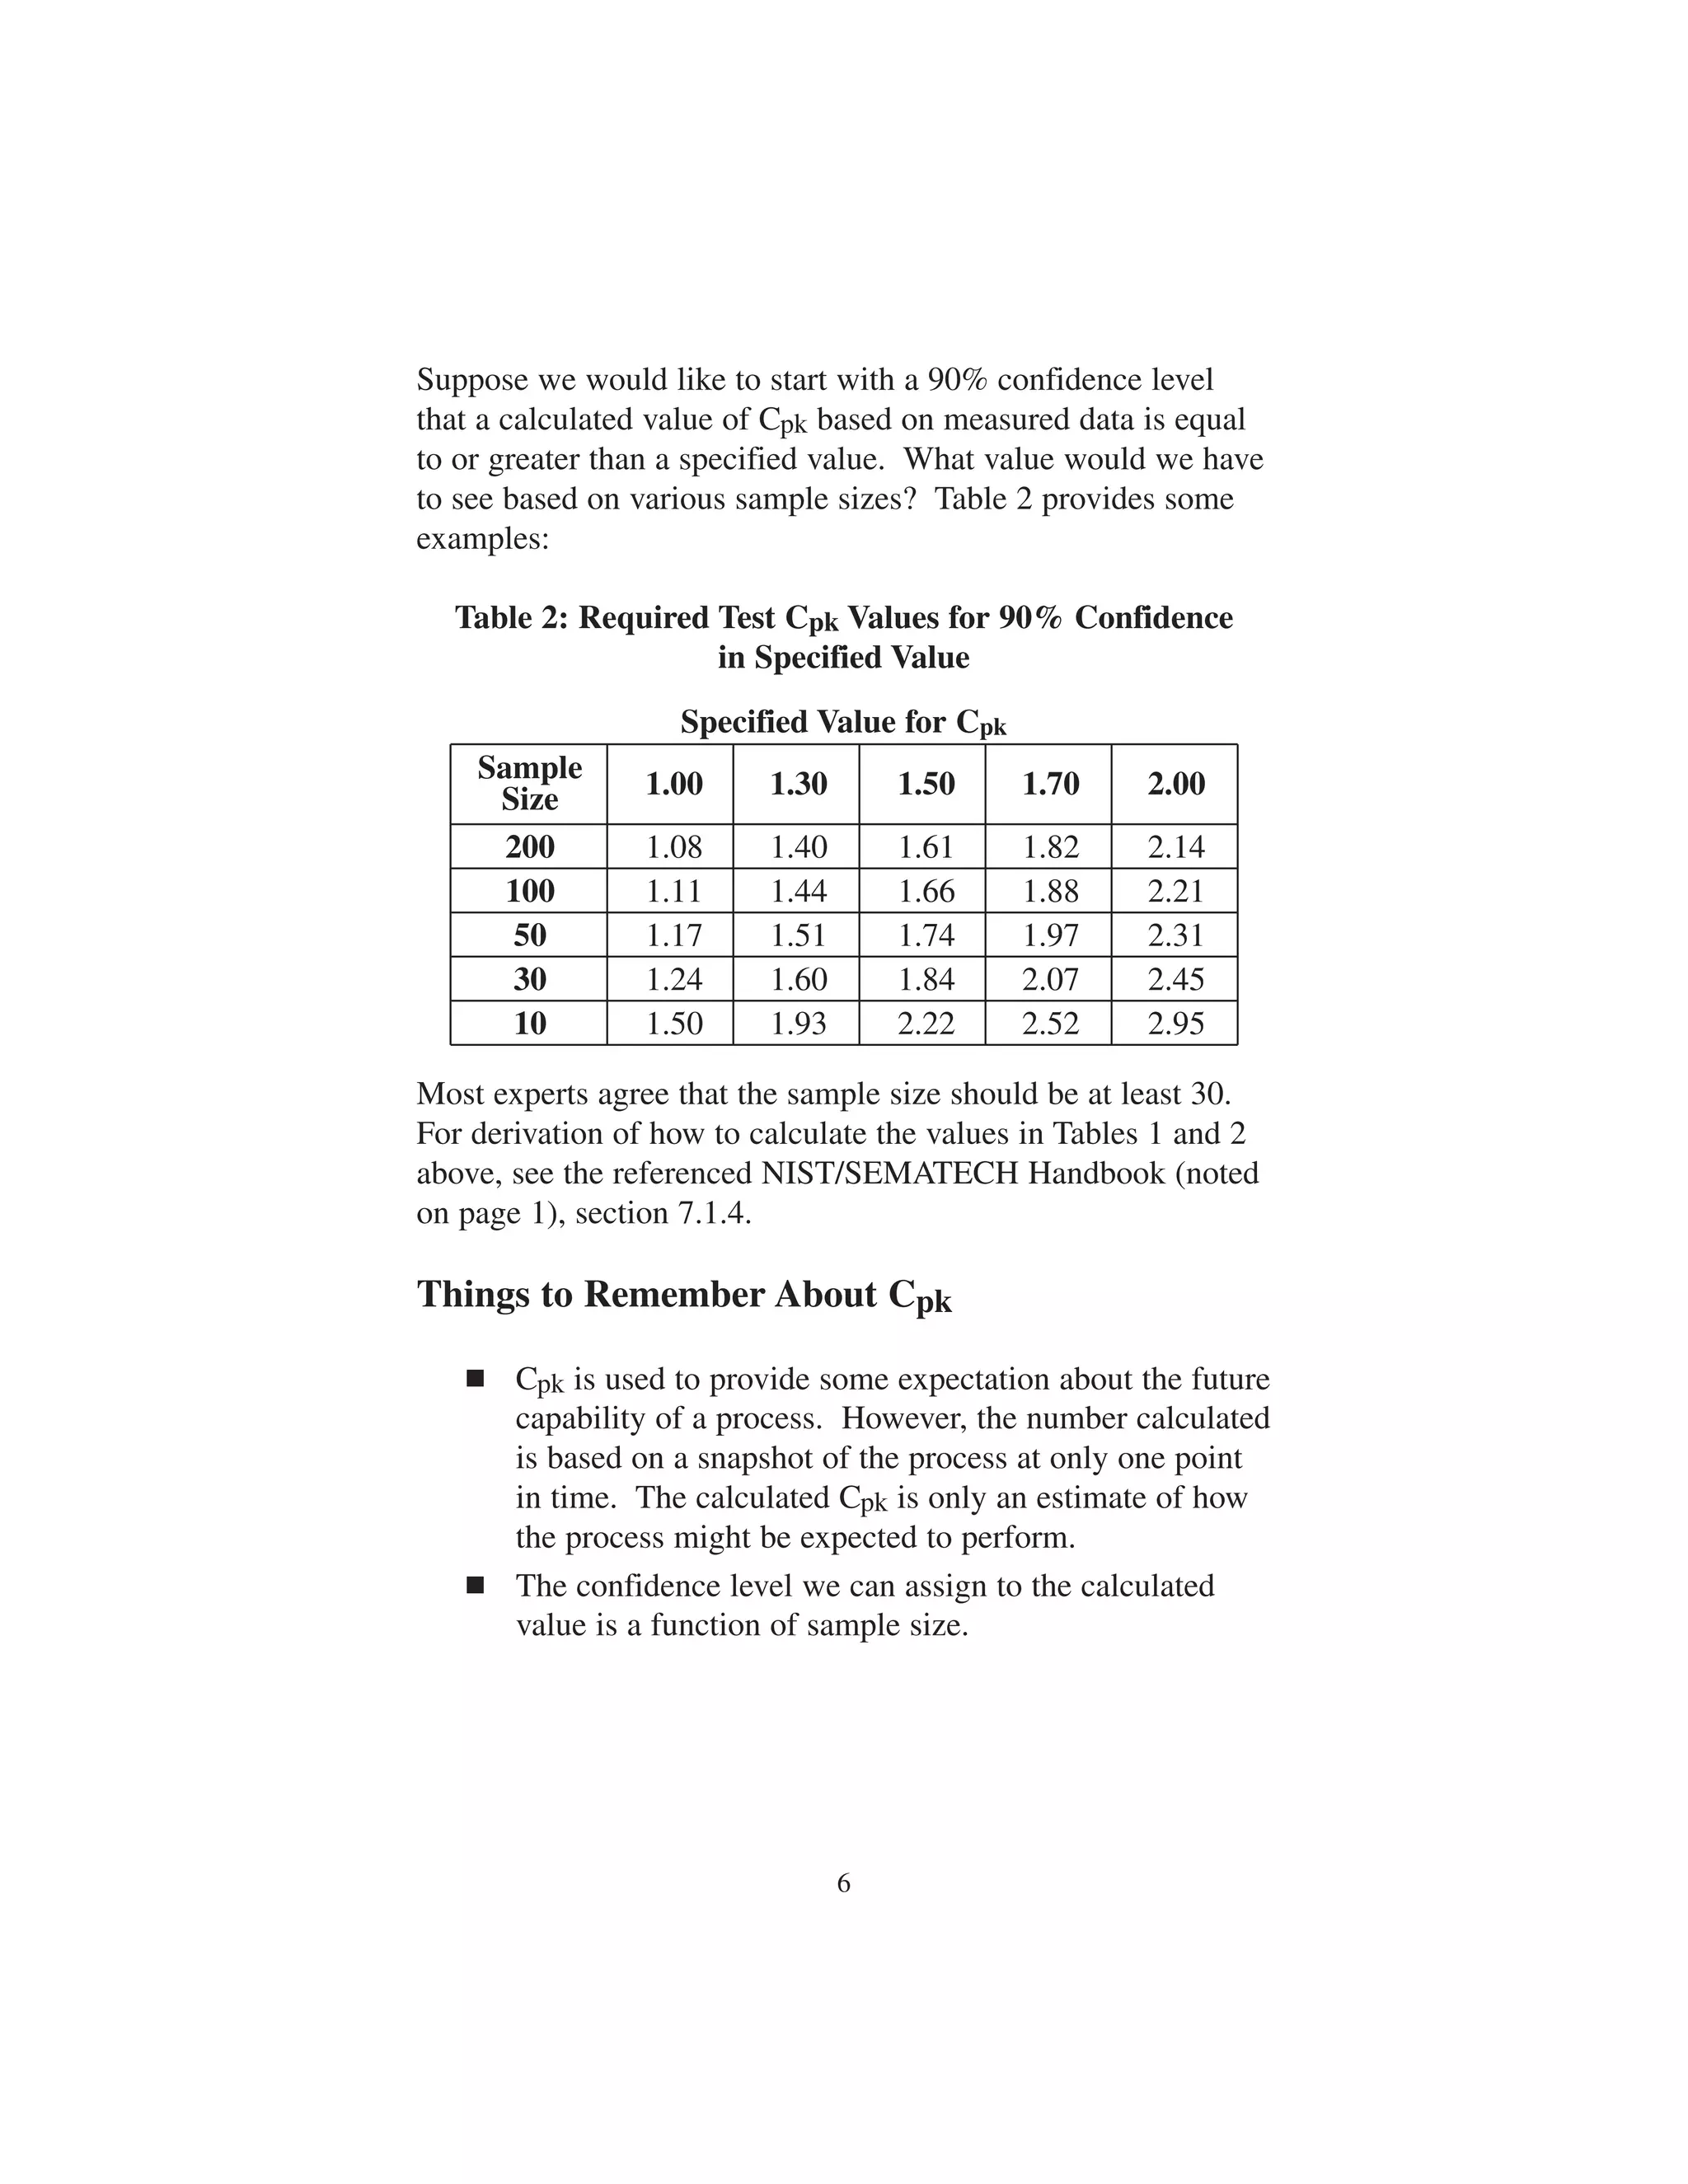
![However, in most cases, the process will not be centered on the
specification as shown in Figure 2. The actual process capabili-ty
Cpk then becomes
X Nearest Specificat ion Limit
X Nearest Specification Limit
USL X
−
X LSL
In Figure 2, the nearest specification limit is USL. An
inspection of Figure 2 will show that the first step in increasing
Cpk should be to take action to align the center of the process
spread with the center of the specification spread. This
assumes that the two spreads are close to equal, or the process
spread is actually less than the specification spread.
4
s
3
−
s
3
−
s
3
Cpk =
This is usually stated as
Cpk = Min [ , ]
FIG. 2](https://image.slidesharecdn.com/cpkguide0211tech1-141107003933-conversion-gate01/75/Cpk-guide-0211_tech1-7-2048.jpg)
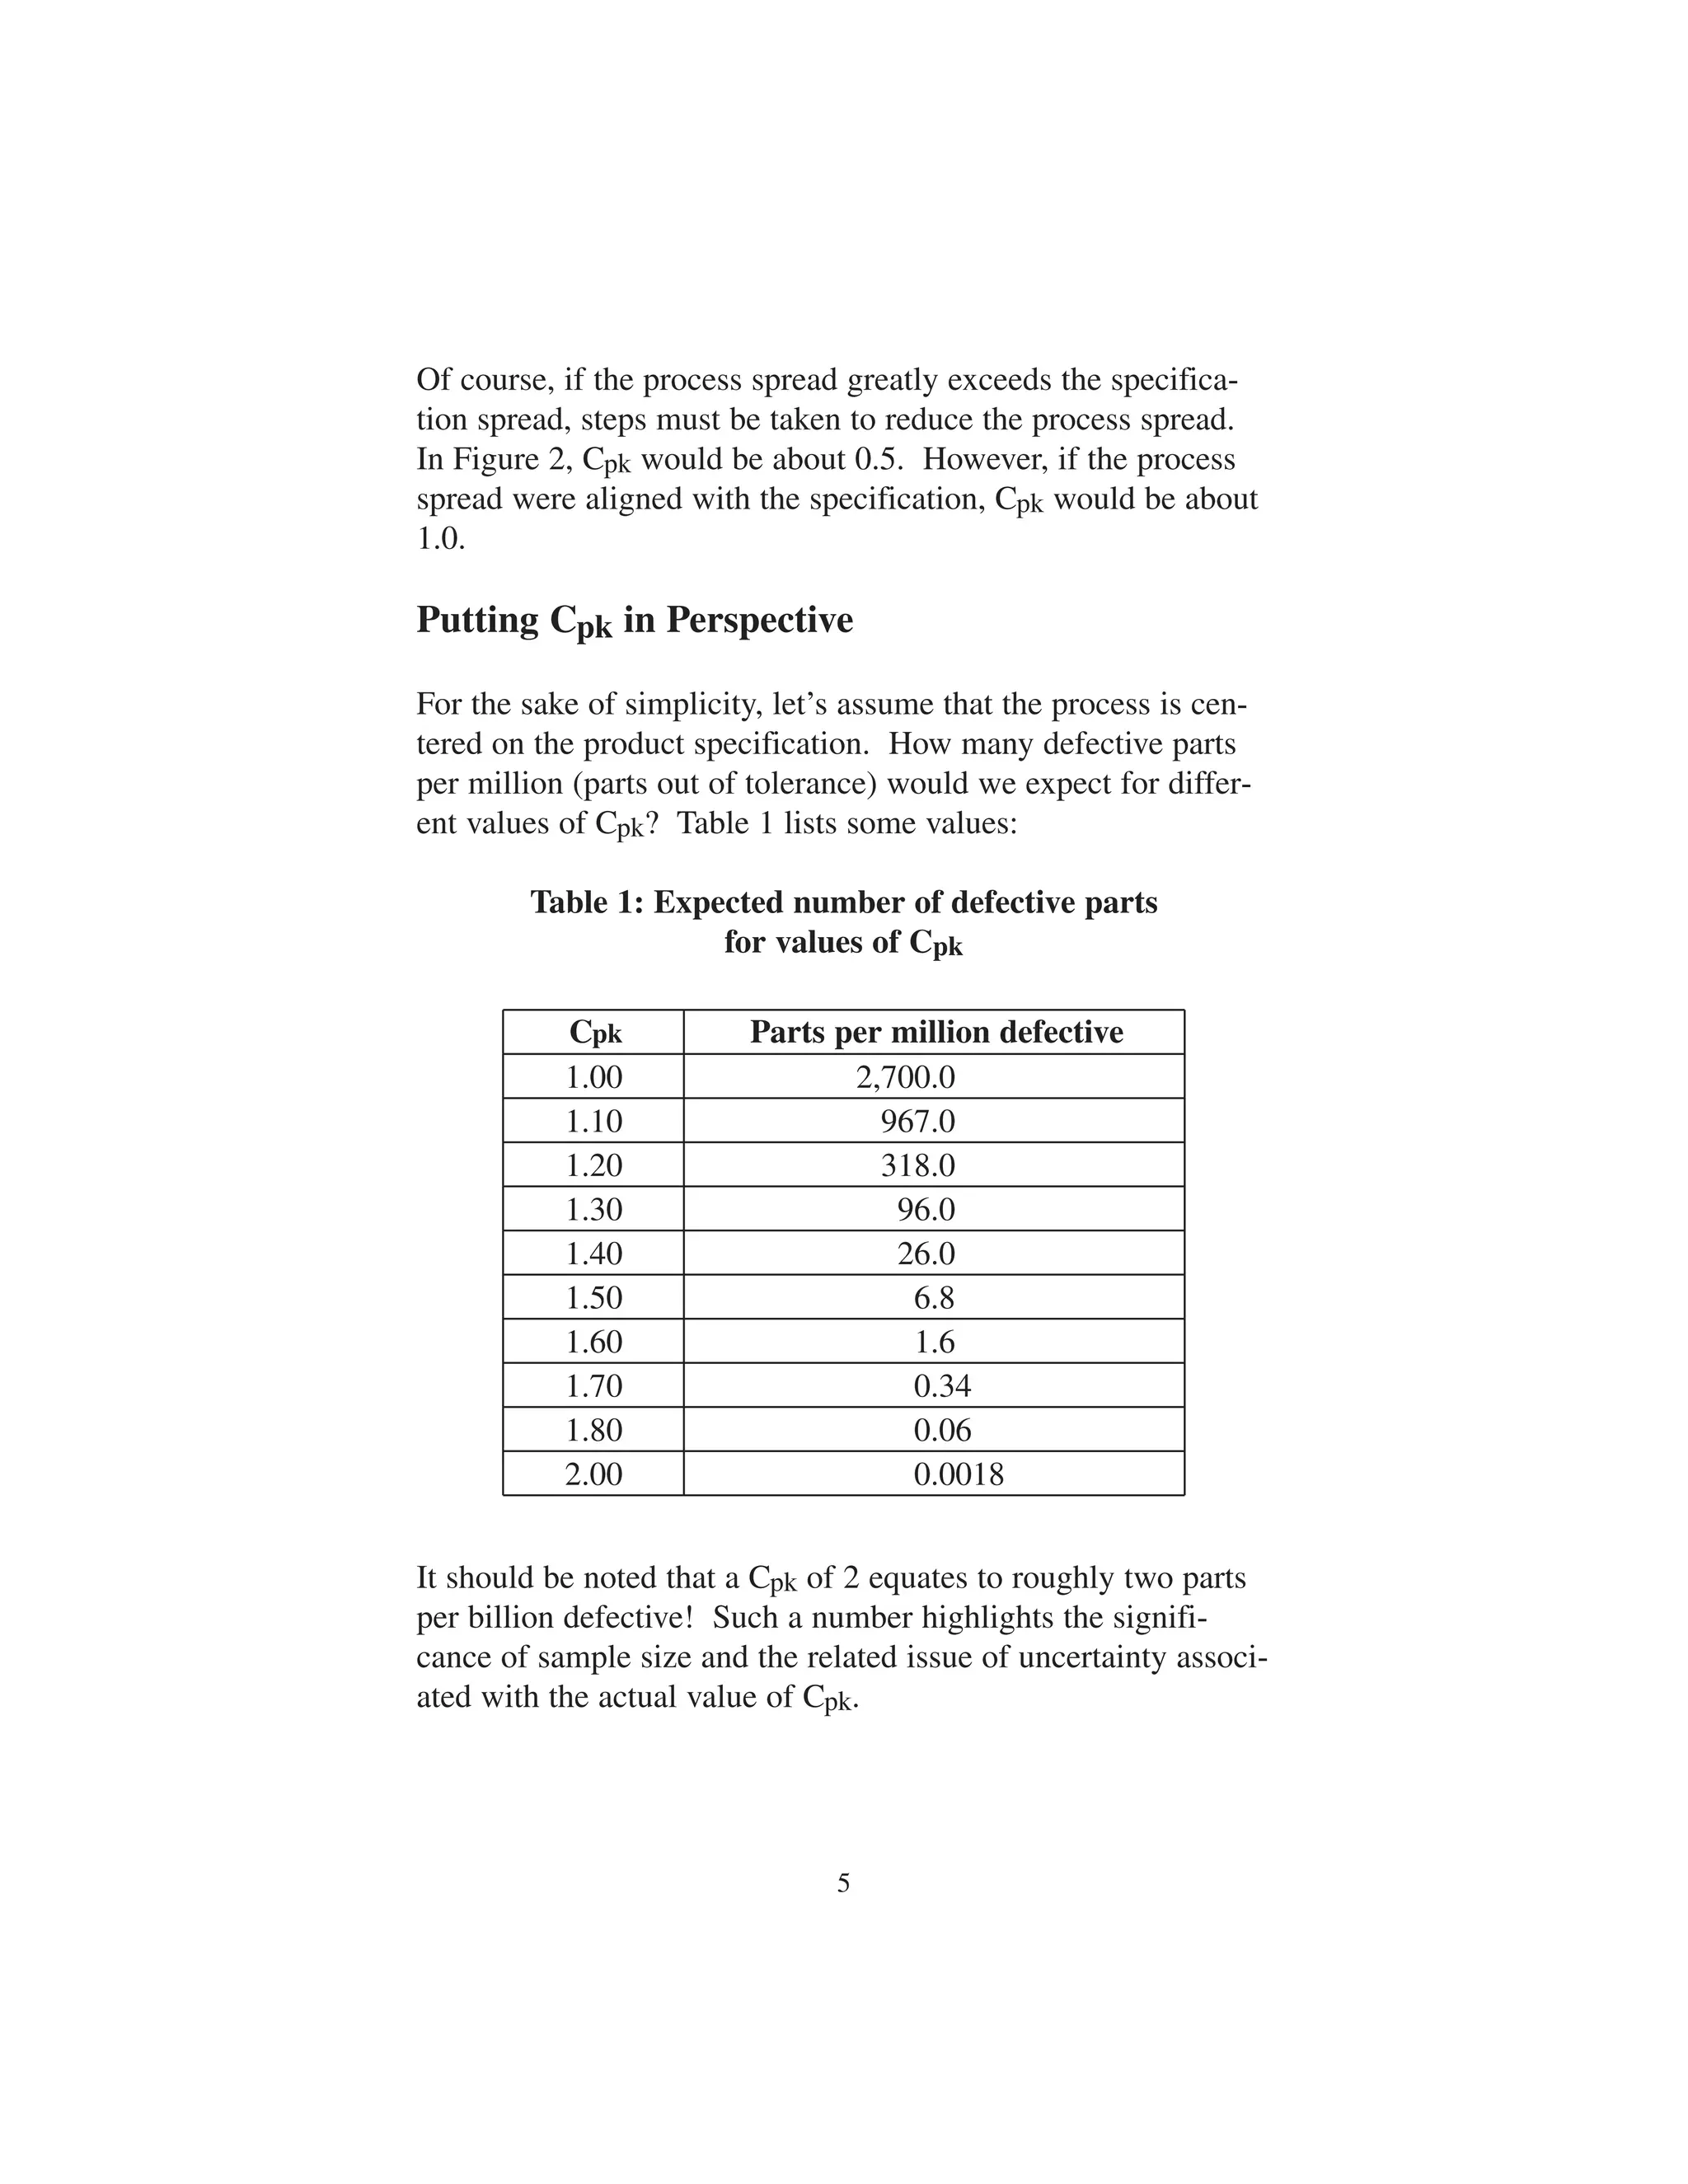

This document provides guidance on calculating and interpreting the process capability index Cpk. It defines Cpk as a ratio that compares the specification tolerance to the process variation expressed in terms of standard deviations. It explains how to calculate Cpk and discusses factors that influence Cpk values such as sample size, process centering, and measurement uncertainty. The document also provides examples of the expected defective parts per million that correspond to different Cpk values and factors to consider when improving Cpk, such as machine, tooling, workholding, and workpiece variables.


