The document provides an overview of the Taguchi method, which is a design of experiments approach developed by Genichi Taguchi to improve quality engineering. It discusses the three main stages of the Taguchi method: system design, parameter design, and tolerance design. Parameter design aims to determine the optimal settings for product or process parameters to improve robustness and reduce costs. Tolerance design then works to tighten tolerances around the optimal settings to make the design less sensitive to noise factors. The document also explains key Taguchi concepts like signal-to-noise ratios, orthogonal arrays, and applications in areas like plastic molding and wastewater treatment.
INTRODUCTION
HISTORY AND IMPACT
•The Taguchi method was first introduced by Dr.
Genichi Taguchi to AT&T Bell Laboratories in 1980.
• The Taguchi method for improving quality is now a
very important tool for statistical process
control(SPC), the Deming approach, and the Japanese
concept of total quality control.
4.
Taguchi Method isa new engineering design optimization
methodology that improves the quality of existing
products and
processes and simultaneously reduces their costs very
rapidly with
minimum engineering resources and development man-
hours.
• It is a basis for determining the functional relationship
between controllable product or service design factors
and the outcomes of a process.
• A method for adjusting the mean of a process by
optimizing controllable variables.
5.
OBJECTIVES OF TAGUCHIMETHODS
• The product can be made robust towards changes in
operating and environmental conditions.
• Minimize the variation in product response from mean
response .
• Since the method is applied in a systematic way at a
pre-production stage (off-line), it can greatly reduce
the number of time-consuming tests, thus saving in
costs and wasted products.
6.
TAGUCHI EXPERIMENTAL DESIGNVS TRADITIONAL DESIGN OF
EXPERIMENT
• Only the main factors and their interactions are considered.
higher order interactions are assumed to be non existent.
• Experimenters are asked to identify which interactions might be
significant before conducting the experiment , through their
knowledge of the subject matter.
• Taguchi’s orthogonal arrays are not randomly generated. they
are based on judgmental sampling.
• Traditional DOE’s treat noise as nuisance (blocking), but
Taguchi makes it the focal point of his analysis.
7.
TAGUCHI’S METHOD
• Taguchi'stechniques have been used widely in engineering
design. The Taguchi method contains system design,
parameter design, and tolerance design procedures to
achieve a robust process and result for the best product
quality.
• The main trust of Taguchi's techniques is the use of
parameter design which is an engineering method for
product or process design that focuses on determining the
parameter (factor) settings producing the best levels of a
8.
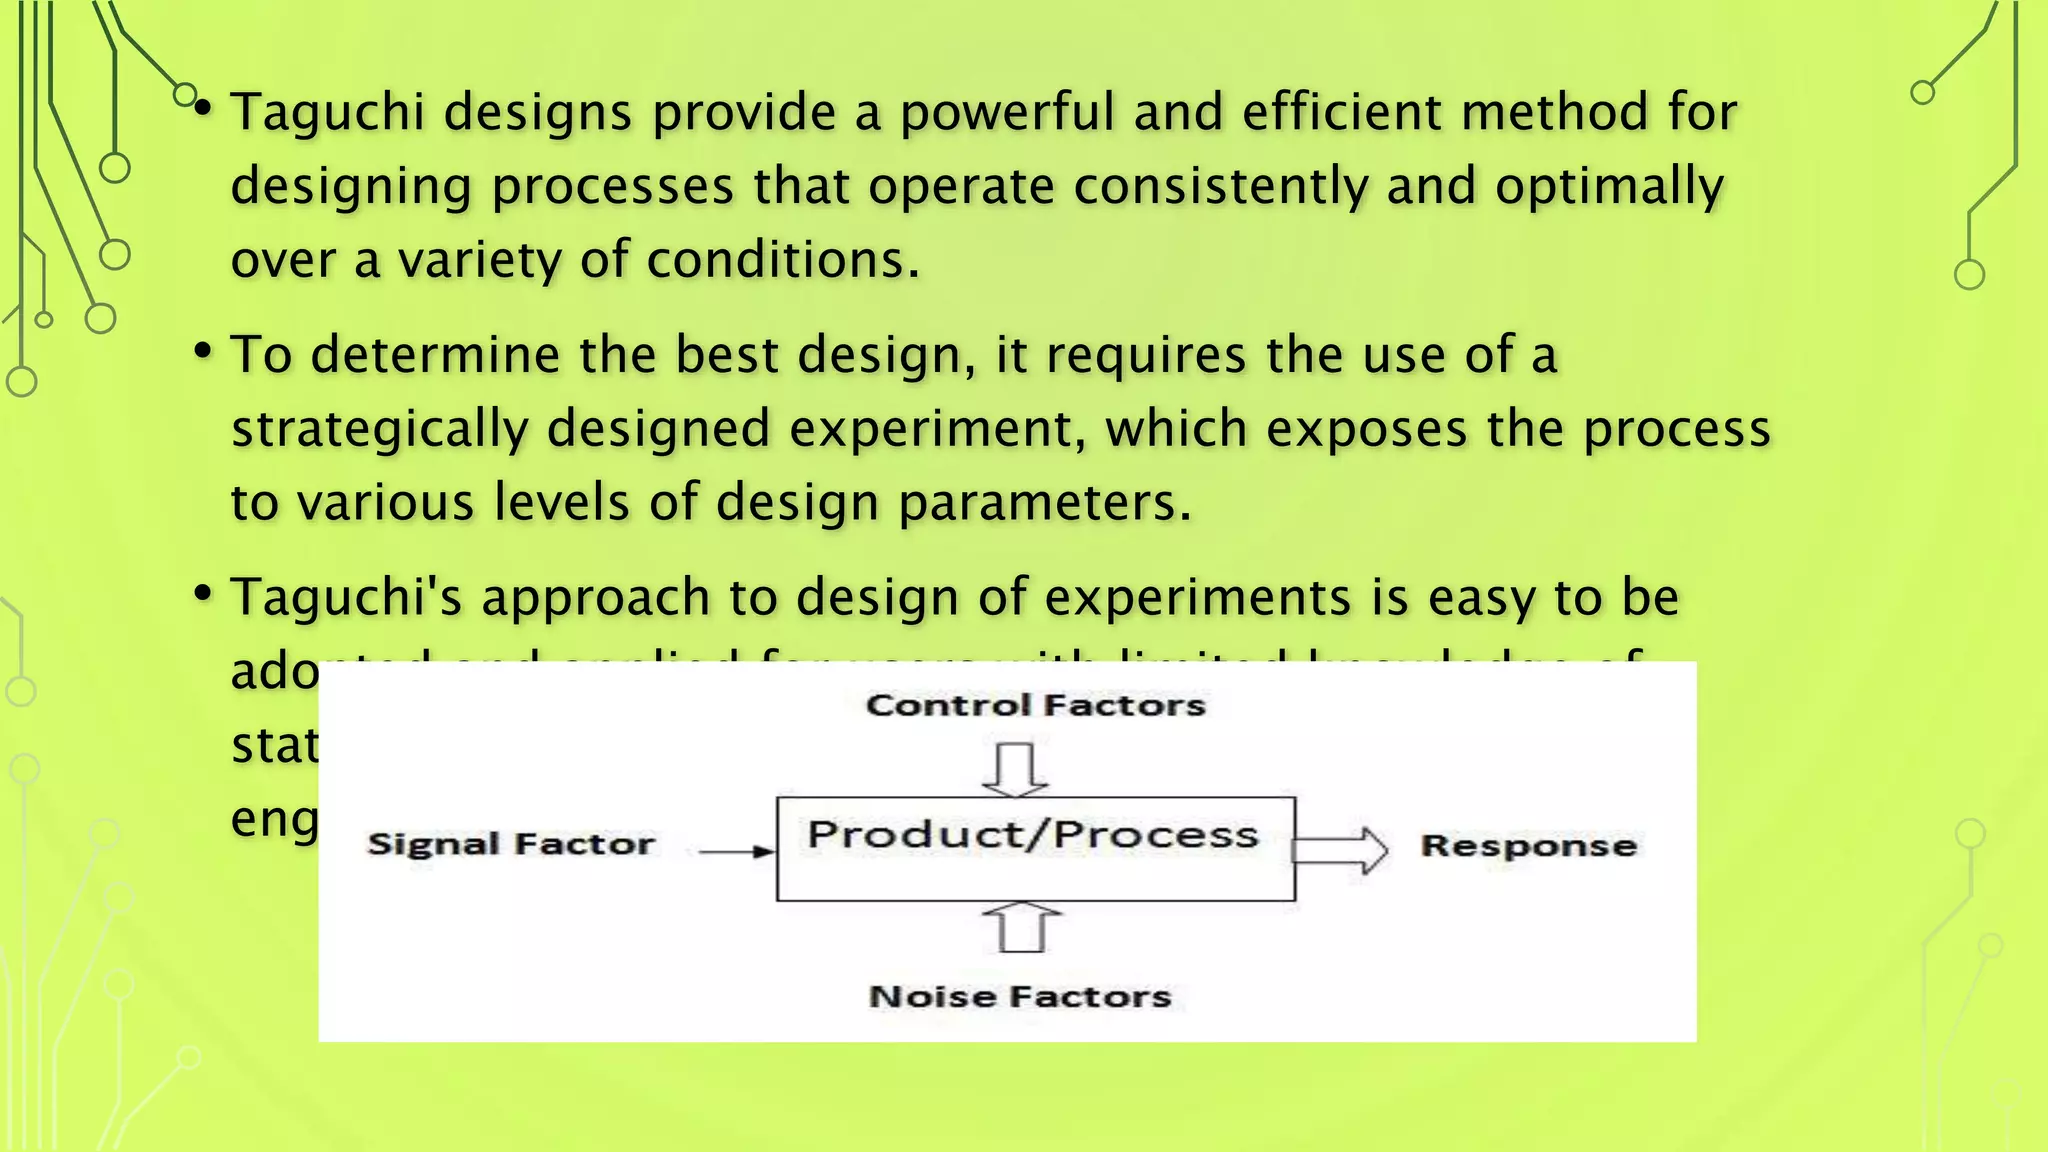
• Taguchi designsprovide a powerful and efficient method for
designing processes that operate consistently and optimally
over a variety of conditions.
• To determine the best design, it requires the use of a
strategically designed experiment, which exposes the process
to various levels of design parameters.
• Taguchi's approach to design of experiments is easy to be
adopted and applied for users with limited knowledge of
statistics; hence it has gained a wide popularity in the
engineering and scientific community.
9.
SIGNAL TO NOISERATIO (SNR)
Signal to noise ratio used for predicting the product quality.
S/N =
𝑎𝑚𝑜𝑢𝑛𝑡 𝑜𝑓 𝑒𝑛𝑒𝑟𝑔𝑦 𝑓𝑜𝑟 𝑖𝑛𝑡𝑒𝑛𝑑𝑒𝑑 𝑓𝑢𝑛𝑐𝑡𝑖𝑜𝑛
𝑎𝑚𝑜𝑢𝑡 𝑜𝑓 𝑒𝑛𝑒𝑟𝑔𝑦 𝑤𝑎𝑠𝑡𝑒𝑑
• Signal factors are set by the designer/ operator to obtain the
intended value of the response/ output variable.
• Noise factors are not controlled by the designer/ operator or
very difficult and expensive to control.
SNR is used to make the product /process robust against
Noise Factors.
10.
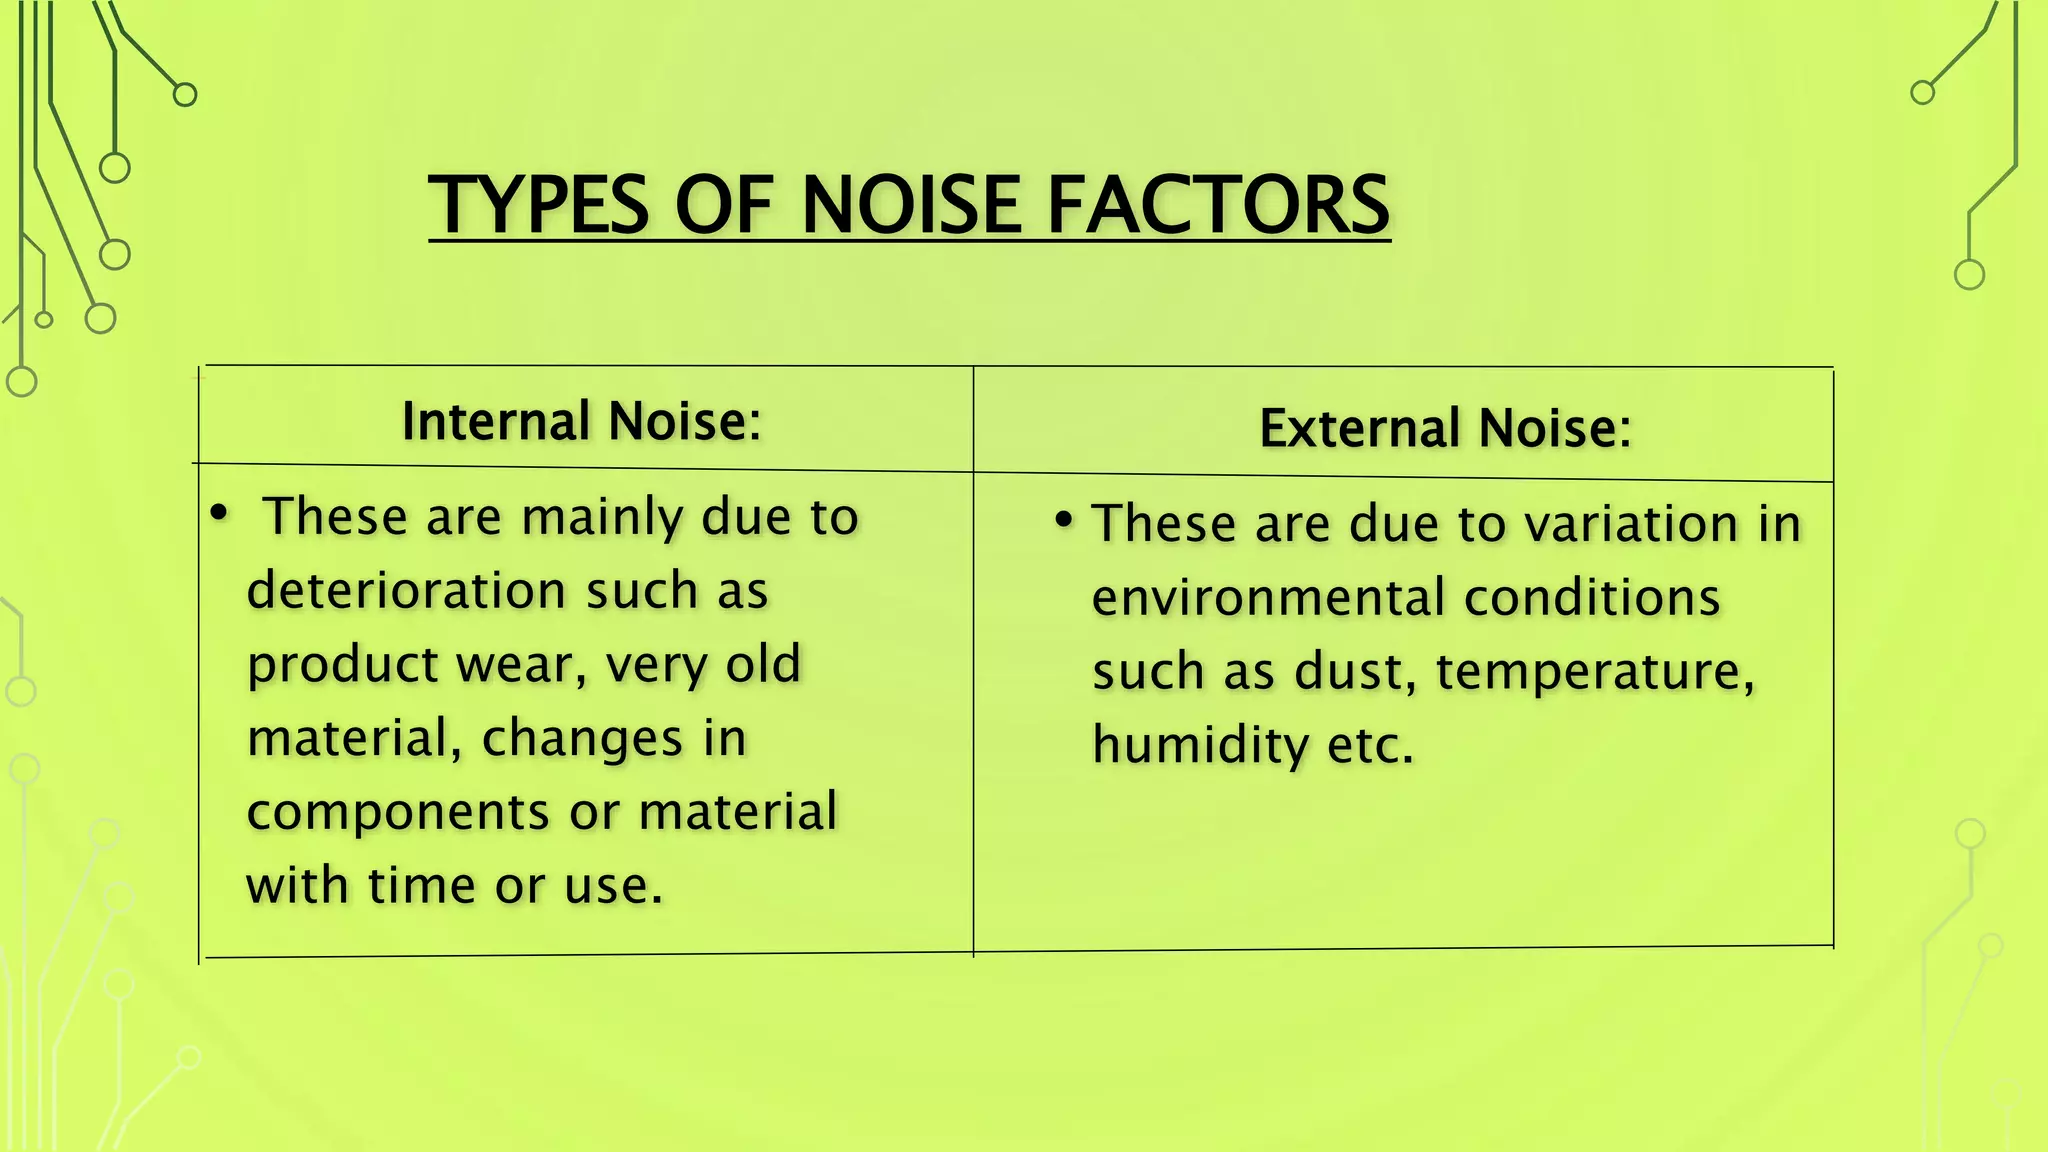
TYPES OF NOISEFACTORS
Internal Noise:
• These are mainly due to
deterioration such as
product wear, very old
material, changes in
components or material
with time or use.
External Noise:
• These are due to variation in
environmental conditions
such as dust, temperature,
humidity etc.
11.
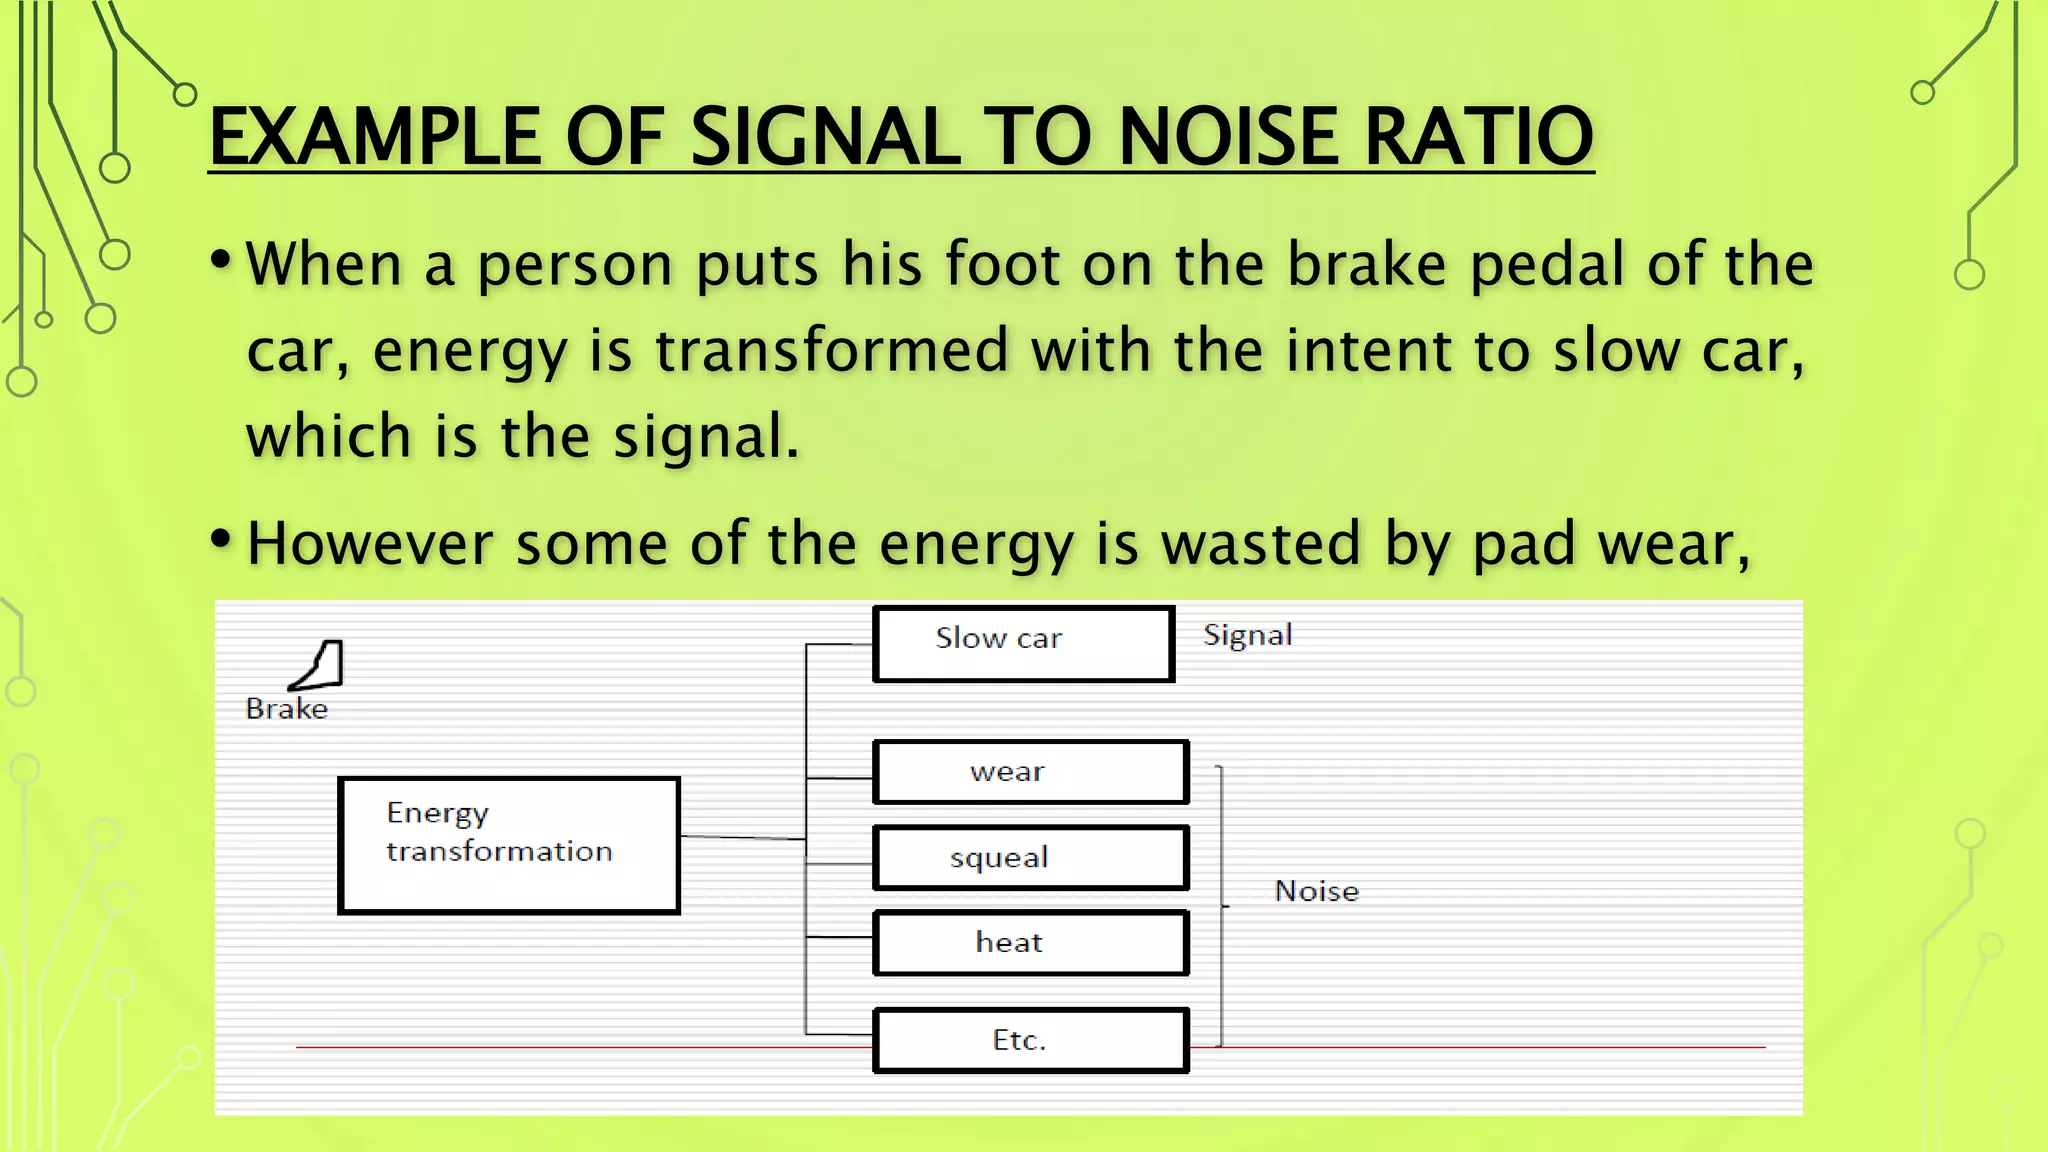
EXAMPLE OF SIGNALTO NOISE RATIO
• When a person puts his foot on the brake pedal of the
car, energy is transformed with the intent to slow car,
which is the signal.
• However some of the energy is wasted by pad wear,
squeal, heat etc. these are called noise.
12.
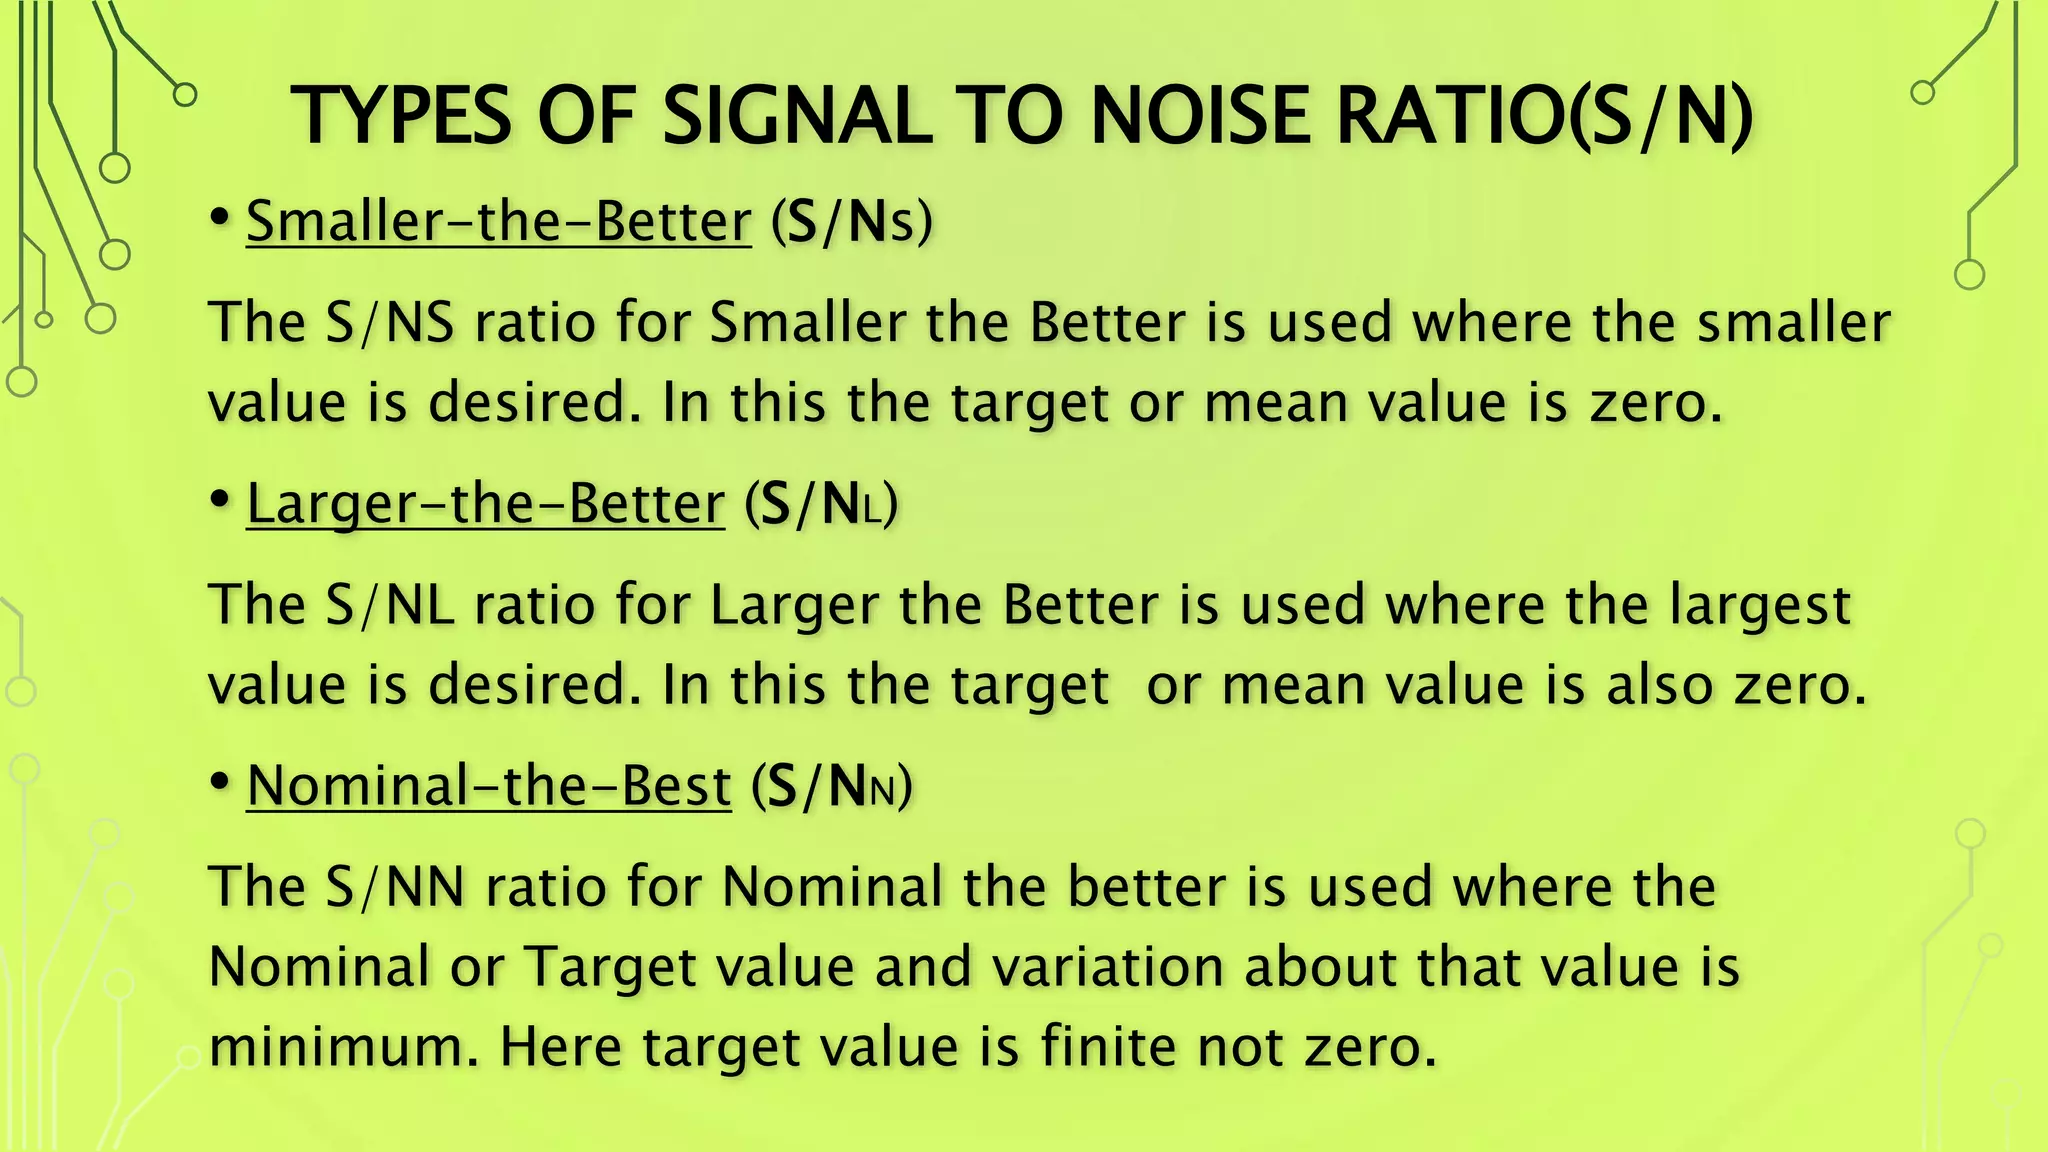
TYPES OF SIGNALTO NOISE RATIO(S/N)
• Smaller-the-Better (S/Ns)
The S/NS ratio for Smaller the Better is used where the smaller
value is desired. In this the target or mean value is zero.
• Larger-the-Better (S/NL)
The S/NL ratio for Larger the Better is used where the largest
value is desired. In this the target or mean value is also zero.
• Nominal-the-Best (S/NN)
The S/NN ratio for Nominal the better is used where the
Nominal or Target value and variation about that value is
minimum. Here target value is finite not zero.
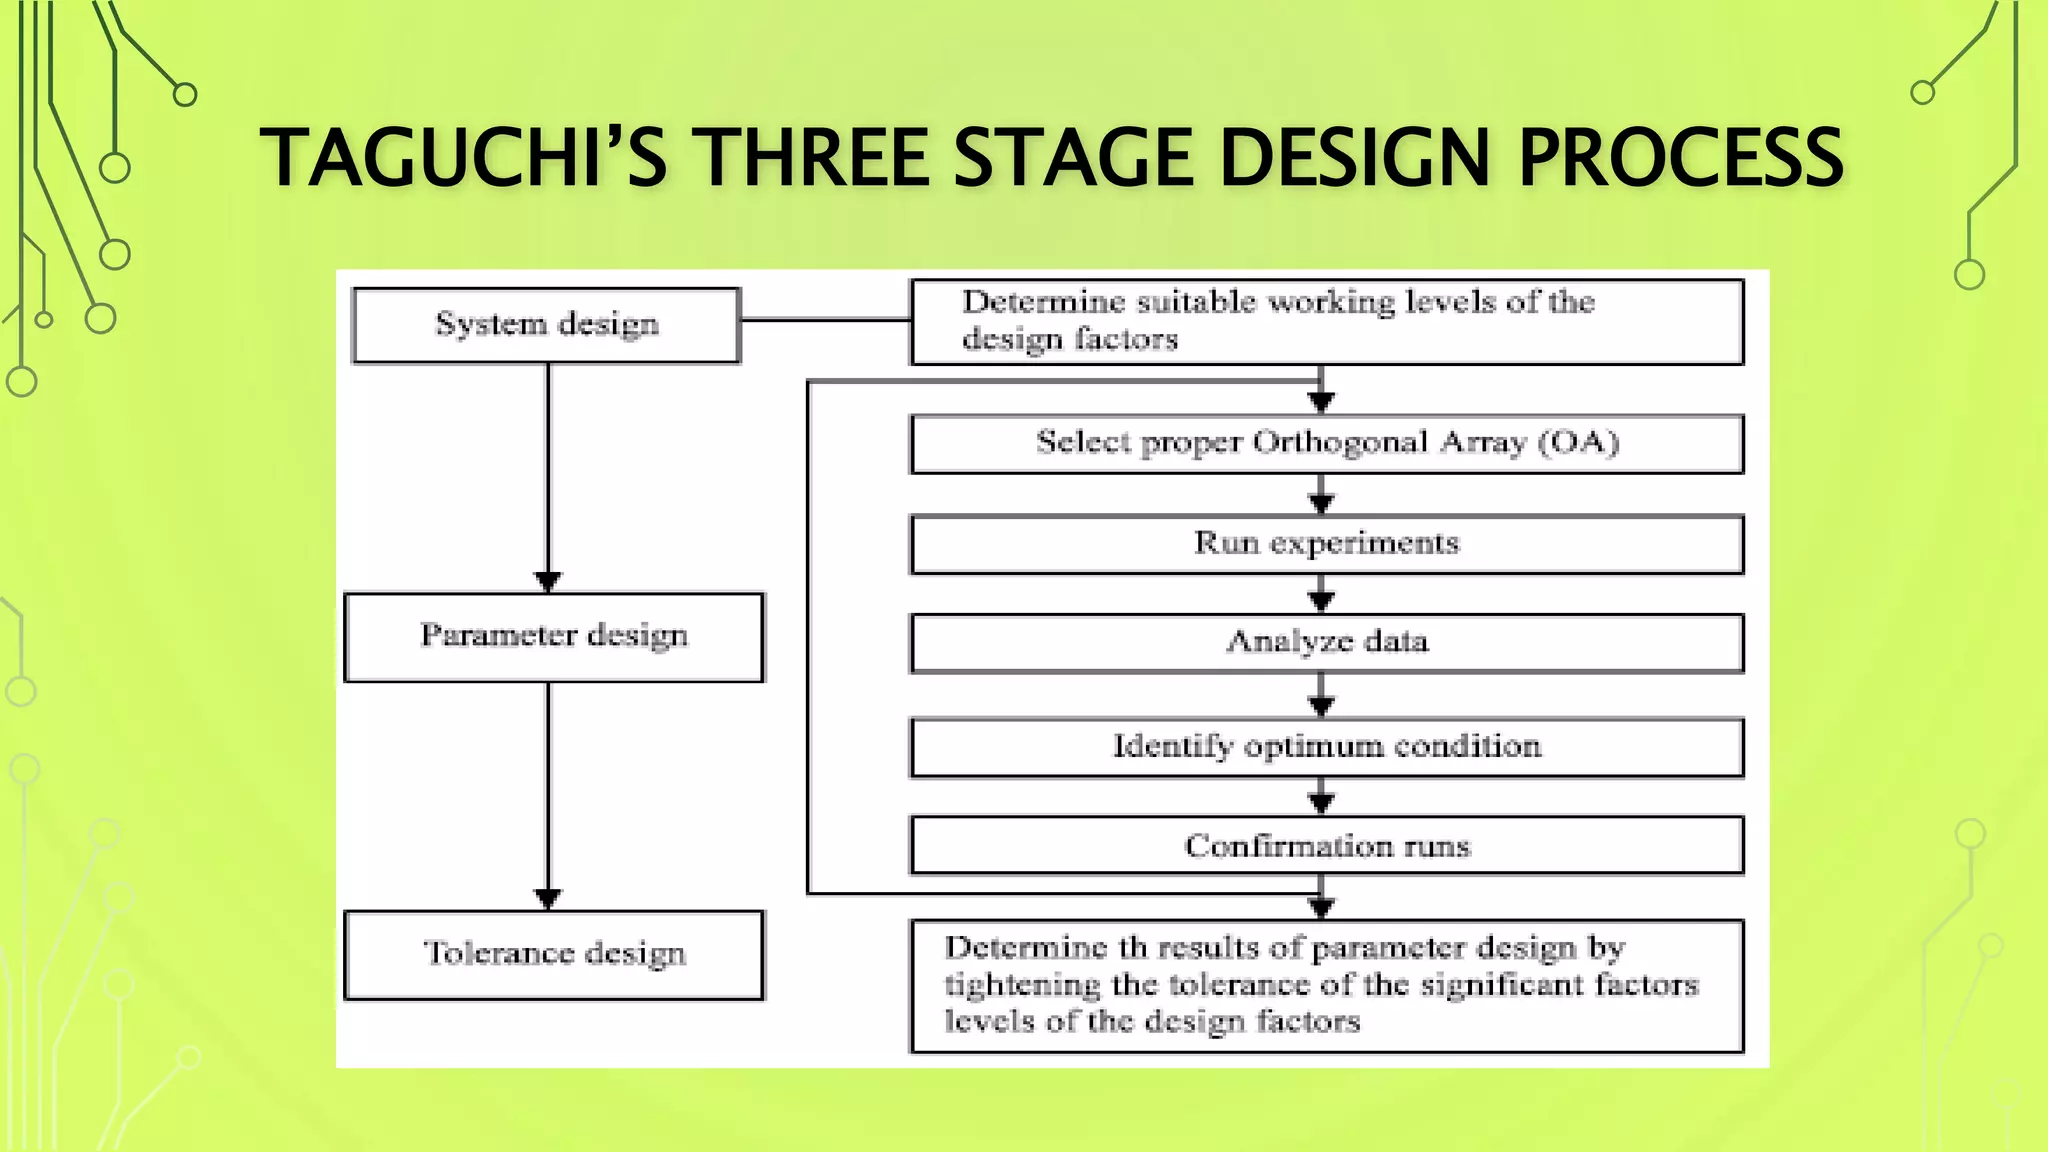
System/Concept Design:
•Design engineersuse their practical experience along
with scientific and engineering principles to develop
the basic design. This is similar to conventional
engineering design.
Parameter design:
•Optimized the system design by determining the
optimal settings for the product or process
parameters so that it improves quality(robustness)
and reduces cost.
Tolerance design:
15.
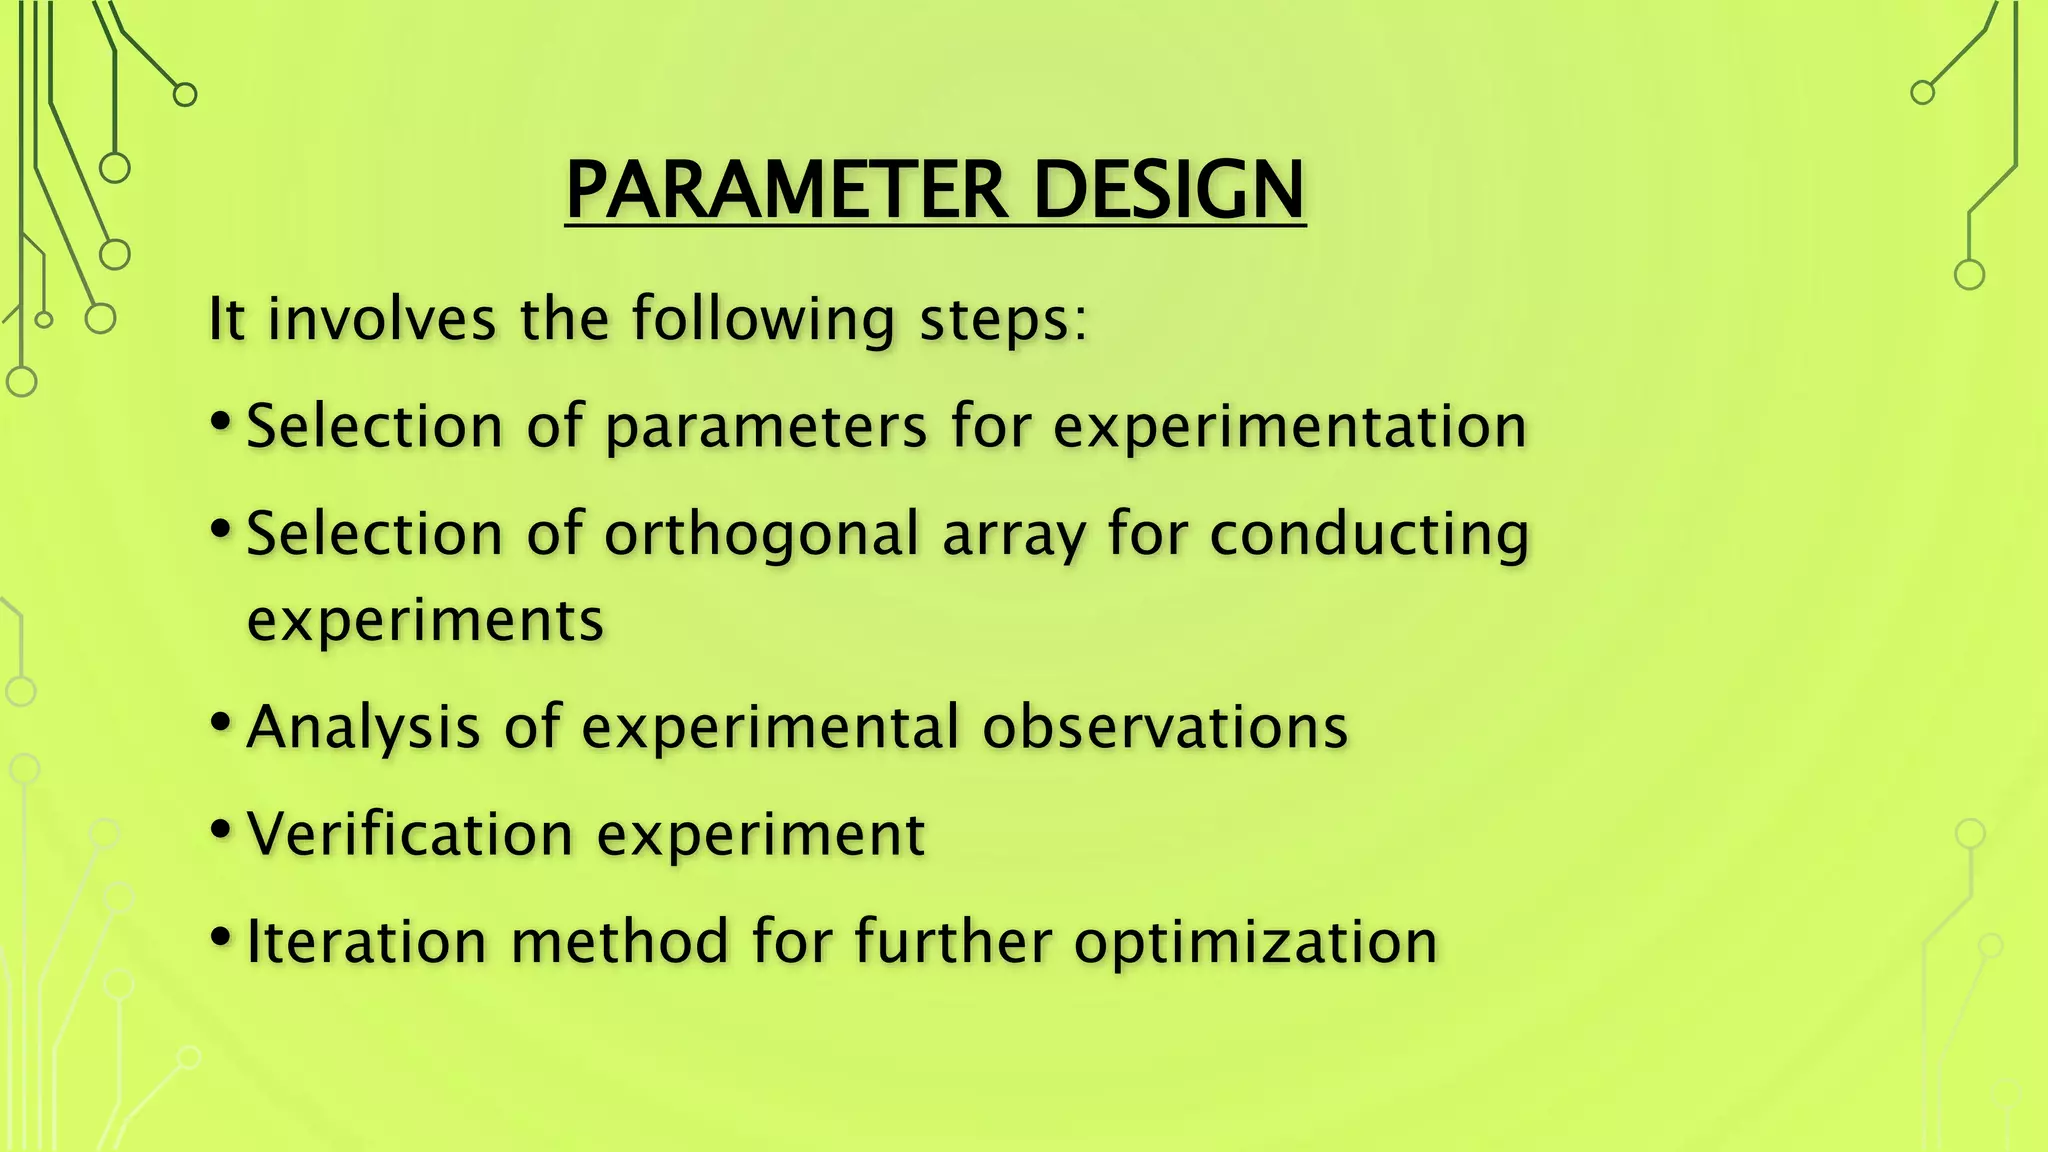
PARAMETER DESIGN
It involvesthe following steps:
• Selection of parameters for experimentation
• Selection of orthogonal array for conducting
experiments
• Analysis of experimental observations
• Verification experiment
• Iteration method for further optimization
16.
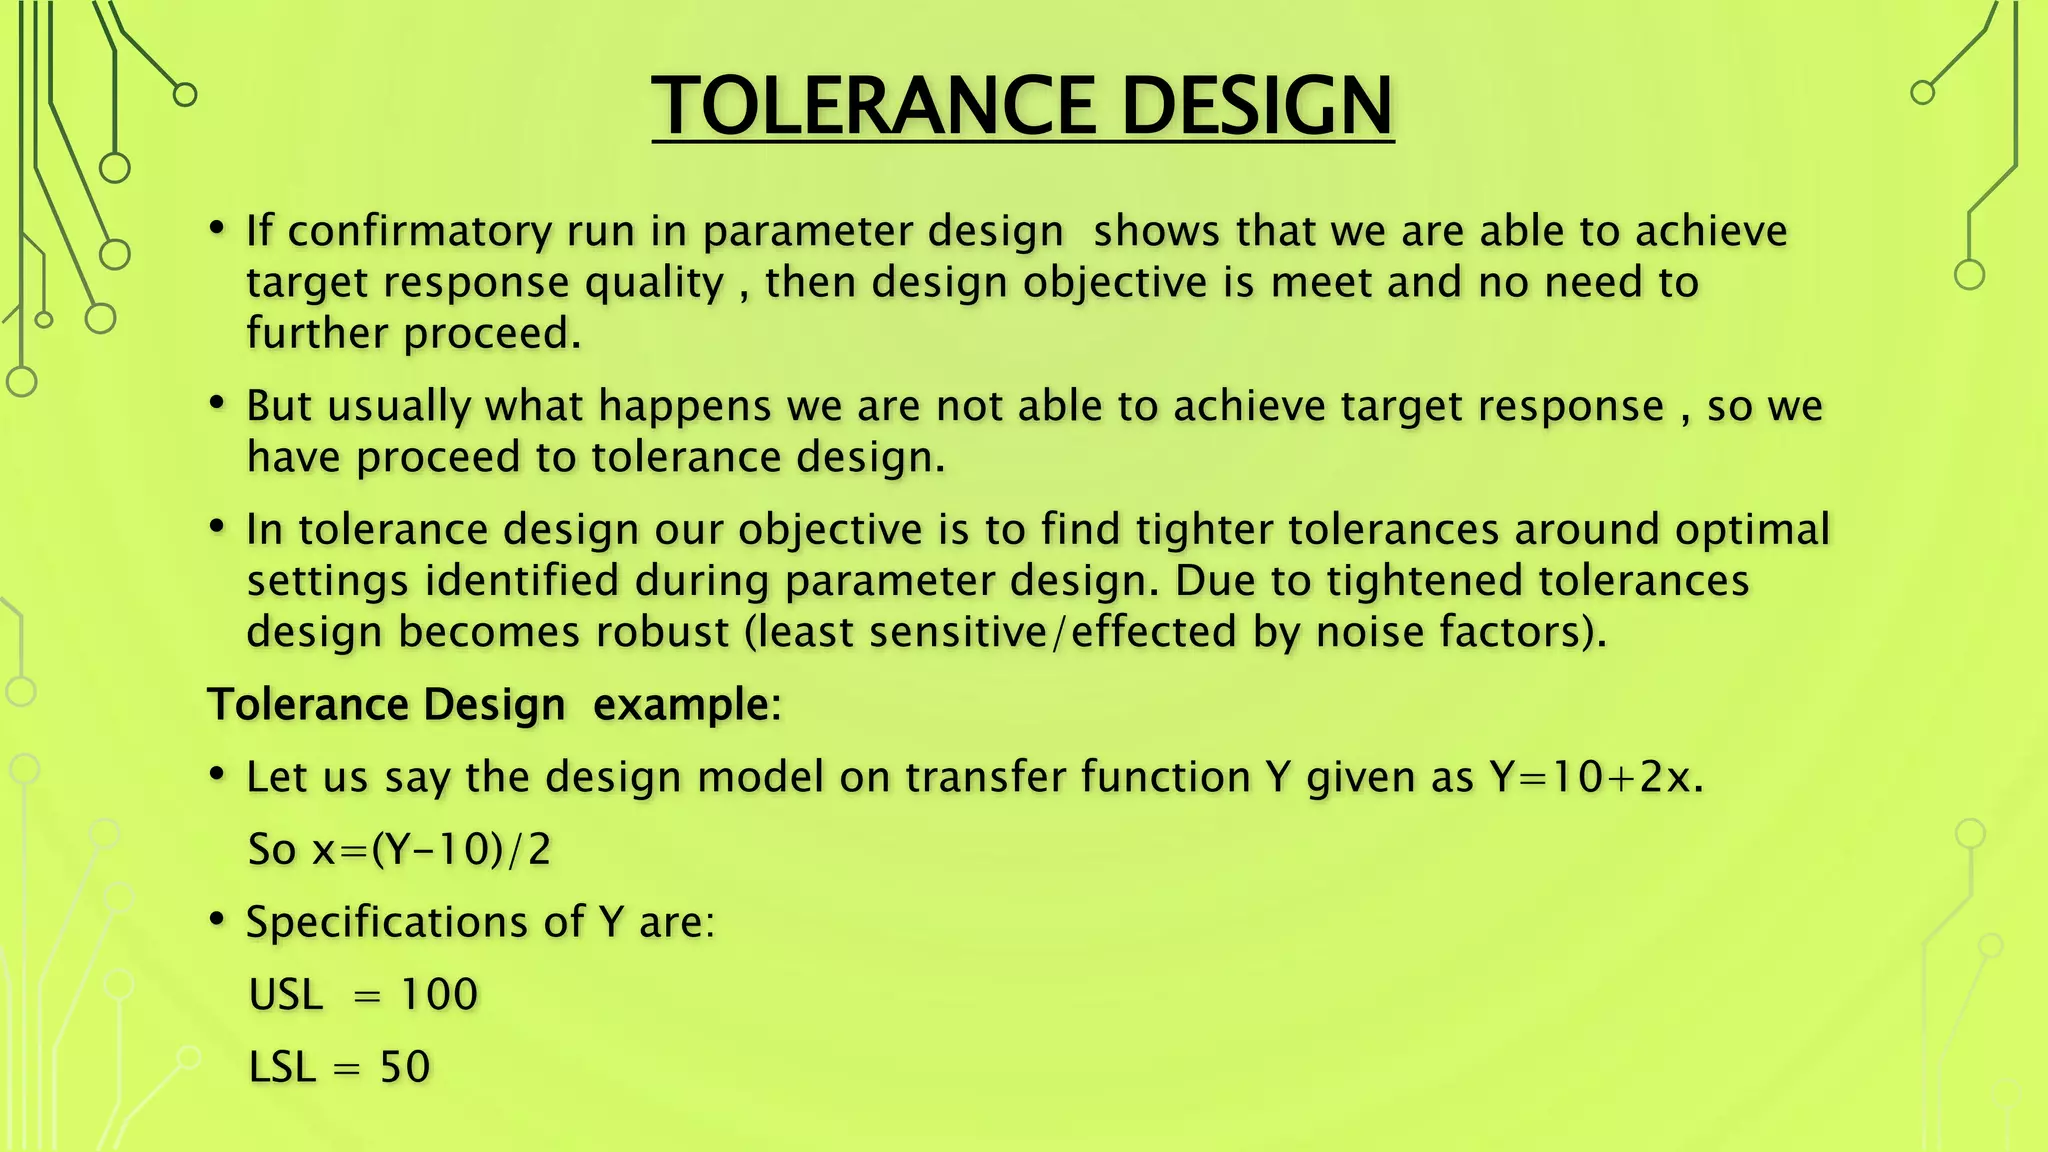
TOLERANCE DESIGN
• Ifconfirmatory run in parameter design shows that we are able to achieve
target response quality , then design objective is meet and no need to
further proceed.
• But usually what happens we are not able to achieve target response , so we
have proceed to tolerance design.
• In tolerance design our objective is to find tighter tolerances around optimal
settings identified during parameter design. Due to tightened tolerances
design becomes robust (least sensitive/effected by noise factors).
Tolerance Design example:
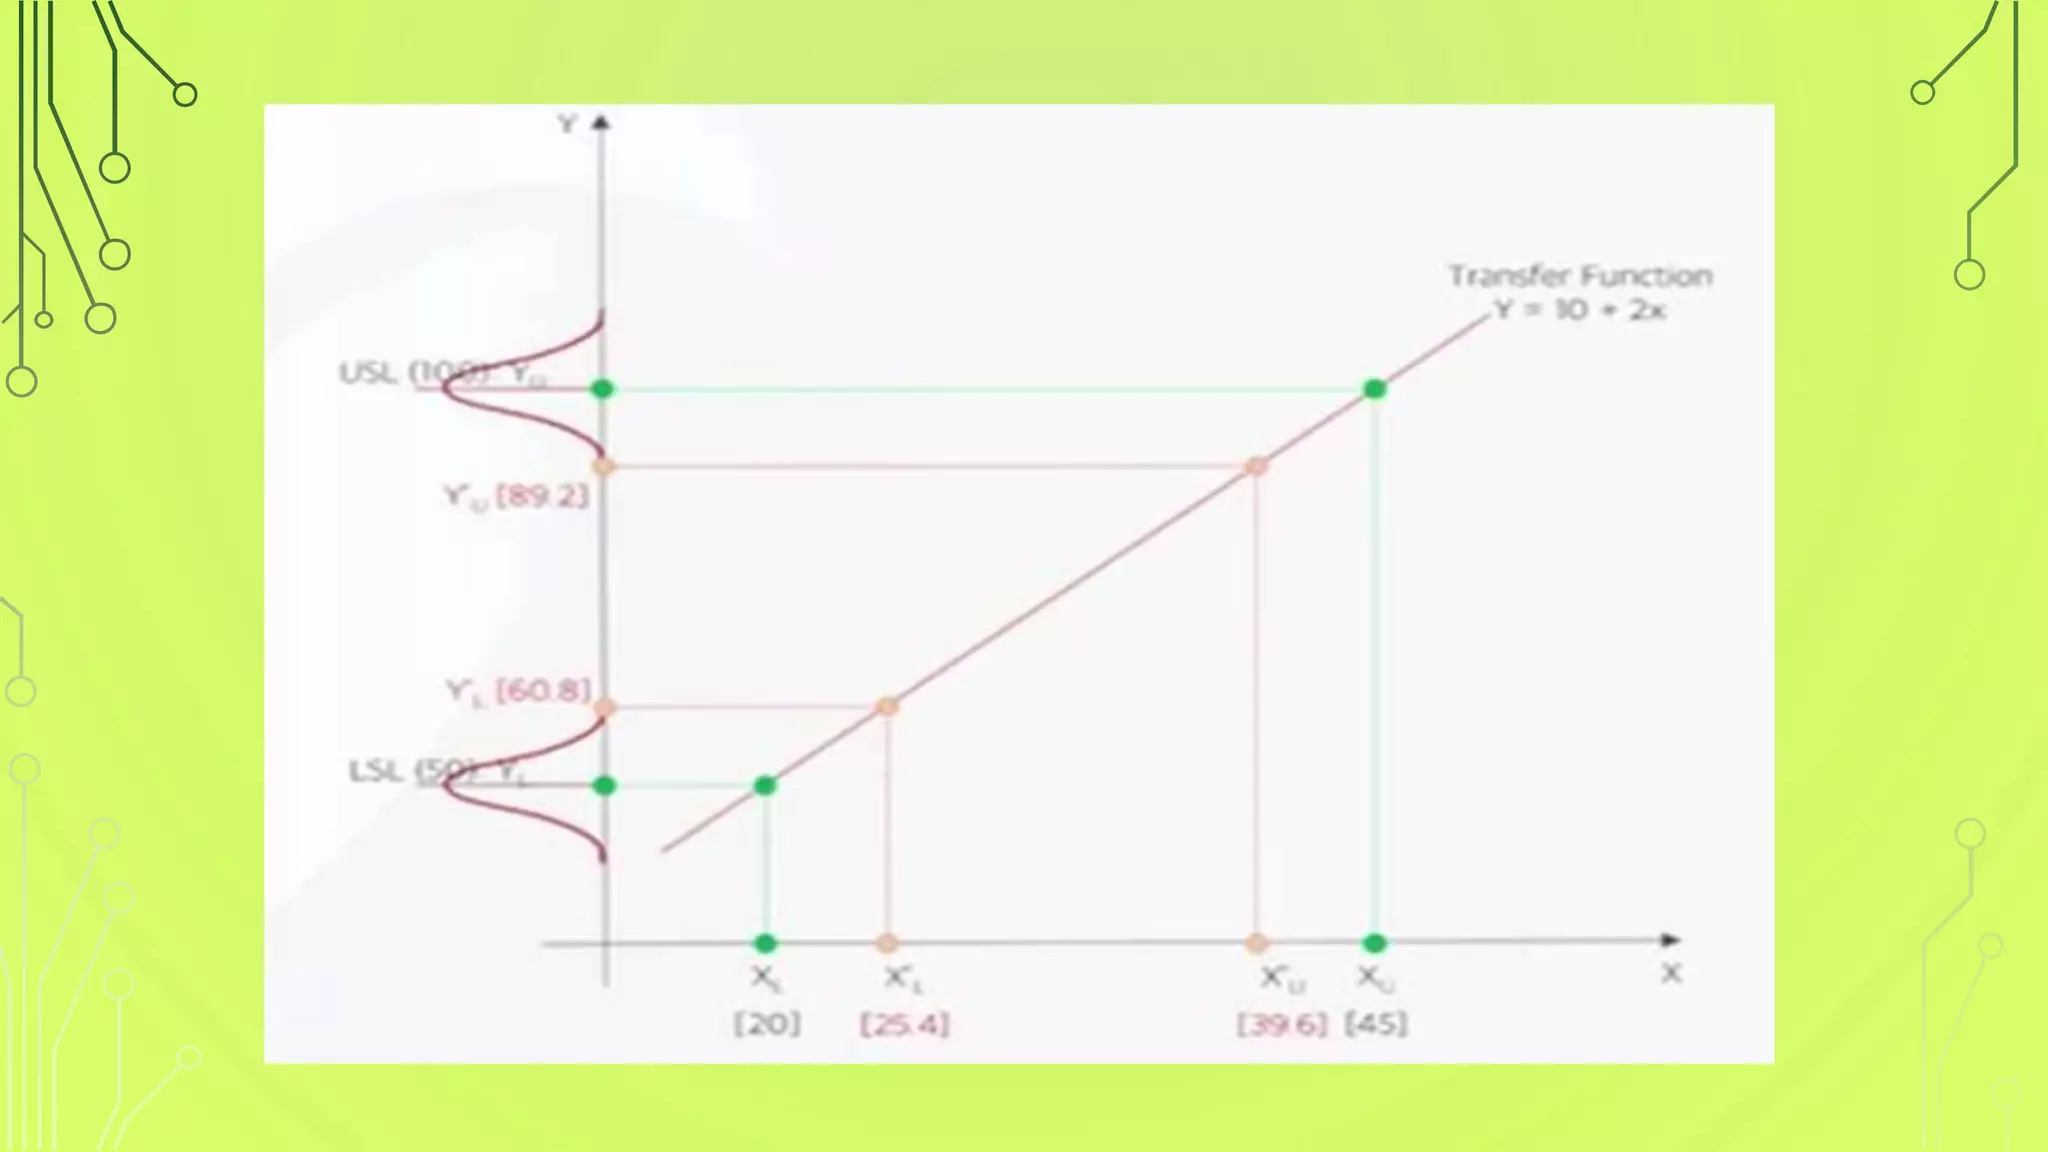
• Let us say the design model on transfer function Y given as Y=10+2x.
So x=(Y-10)/2
• Specifications of Y are:
USL = 100
LSL = 50
17.
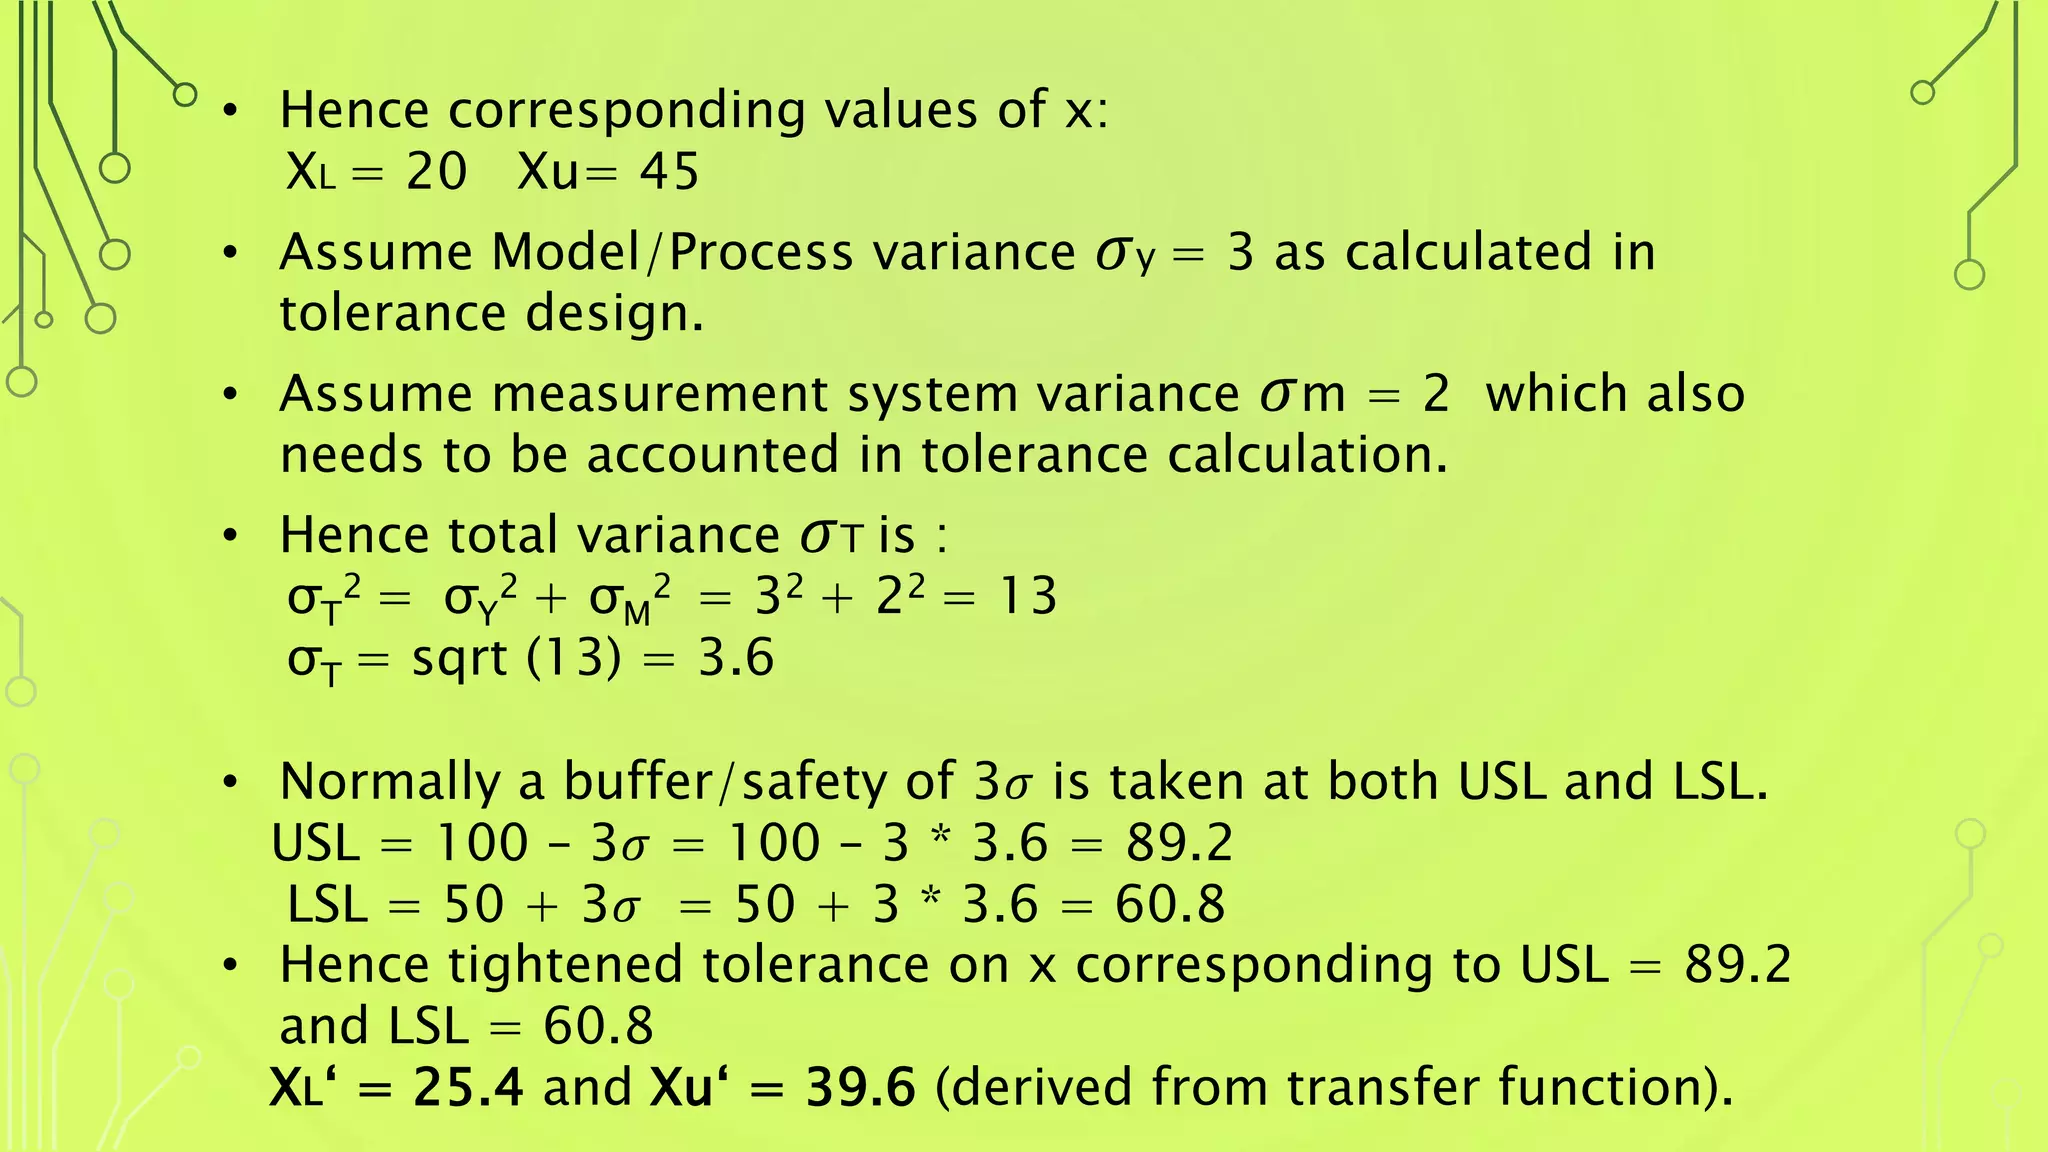
• Hence correspondingvalues of x:
XL = 20 Xu= 45
• Assume Model/Process variance 𝜎y = 3 as calculated in
tolerance design.
• Assume measurement system variance 𝜎m = 2 which also
needs to be accounted in tolerance calculation.
• Hence total variance 𝜎T is :
σT
2 = σY
2 + σM
2 = 32 + 22 = 13
σT = sqrt (13) = 3.6
• Normally a buffer/safety of 3𝜎 is taken at both USL and LSL.
USL = 100 – 3𝜎 = 100 – 3 * 3.6 = 89.2
LSL = 50 + 3𝜎 = 50 + 3 * 3.6 = 60.8
• Hence tightened tolerance on x corresponding to USL = 89.2
and LSL = 60.8
XL‘ = 25.4 and Xu‘ = 39.6 (derived from transfer function).
19.
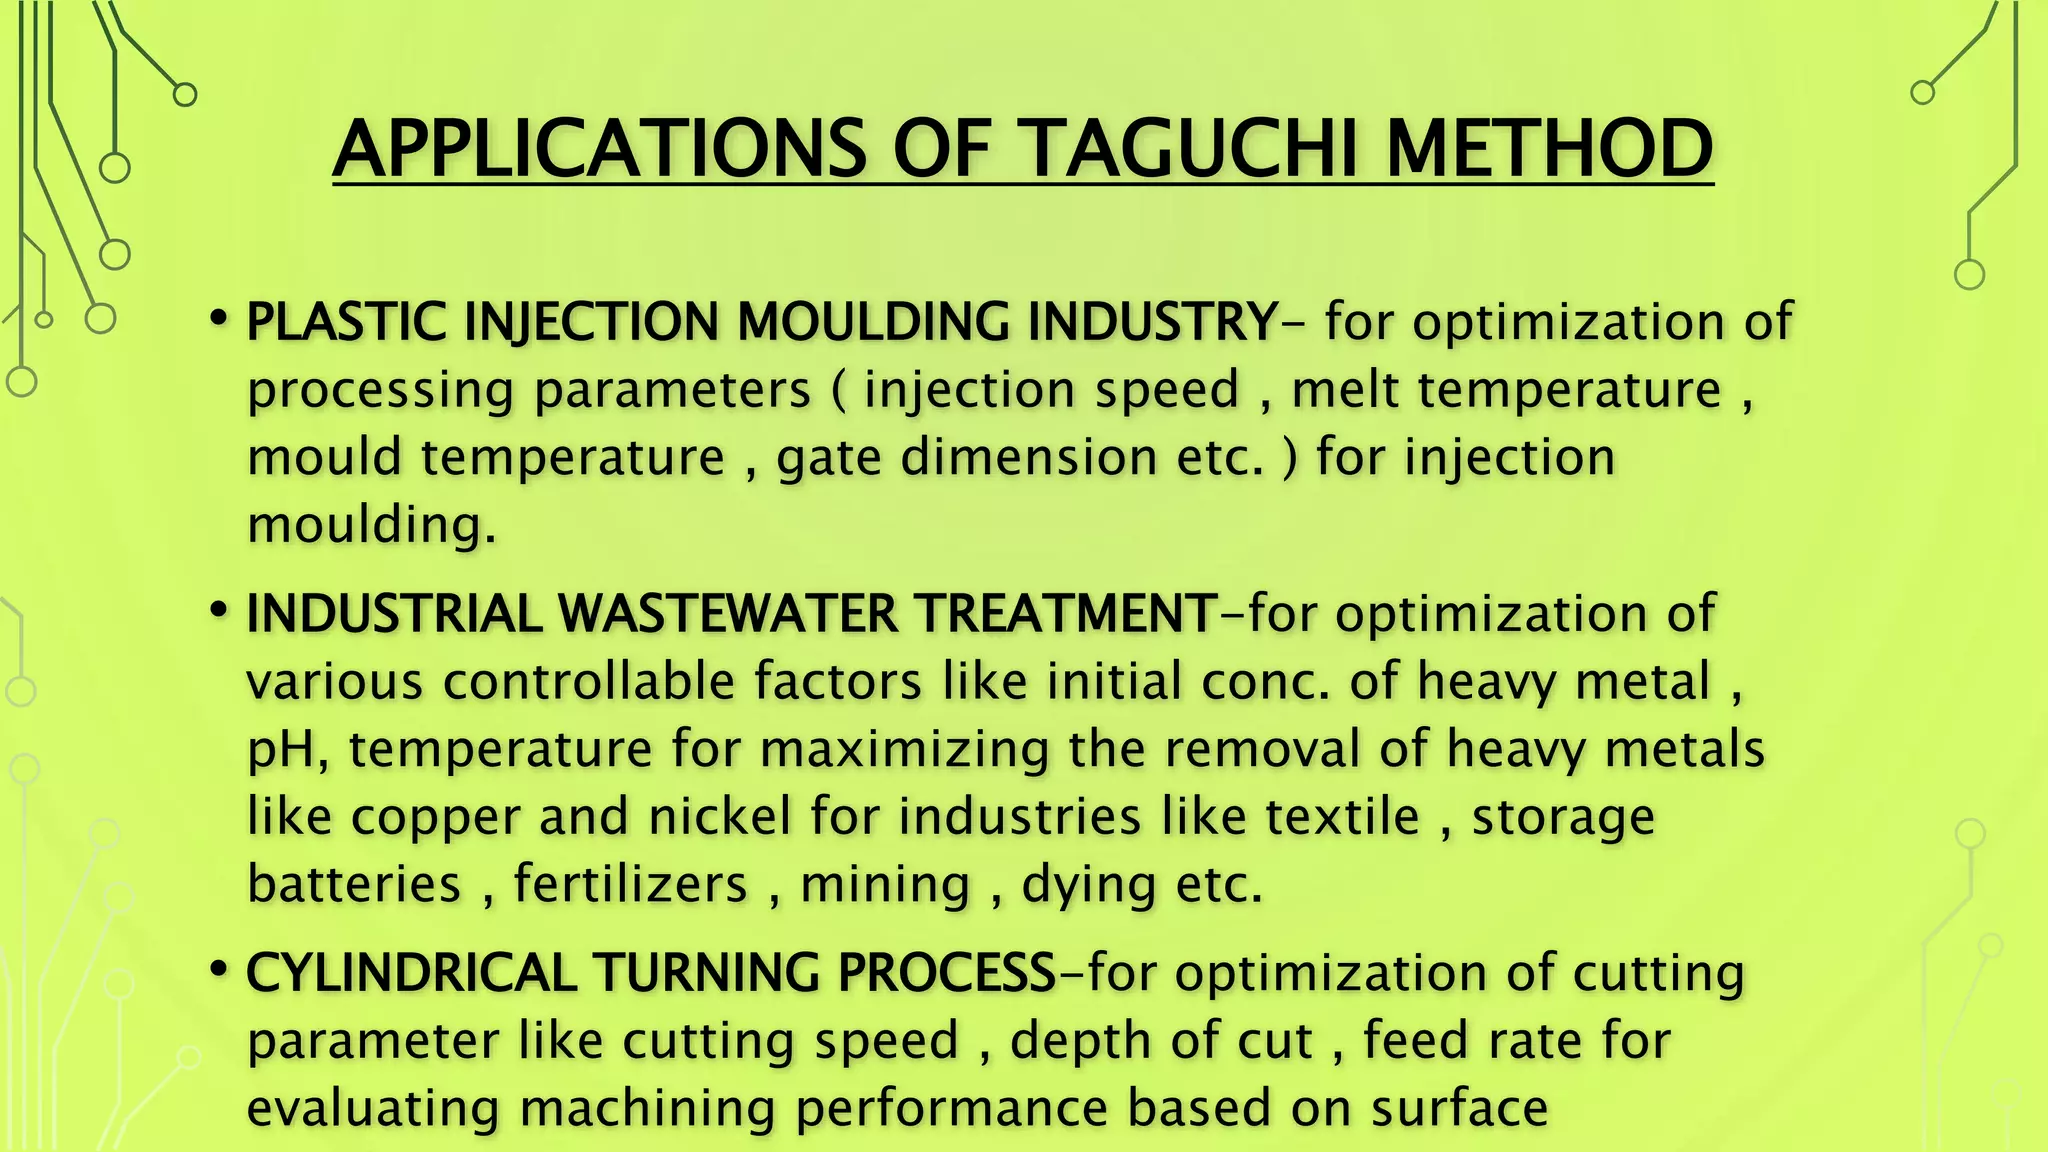
APPLICATIONS OF TAGUCHIMETHOD
• PLASTIC INJECTION MOULDING INDUSTRY- for optimization of
processing parameters ( injection speed , melt temperature ,
mould temperature , gate dimension etc. ) for injection
moulding.
• INDUSTRIAL WASTEWATER TREATMENT-for optimization of
various controllable factors like initial conc. of heavy metal ,
pH, temperature for maximizing the removal of heavy metals
like copper and nickel for industries like textile , storage
batteries , fertilizers , mining , dying etc.
• CYLINDRICAL TURNING PROCESS-for optimization of cutting
parameter like cutting speed , depth of cut , feed rate for
evaluating machining performance based on surface