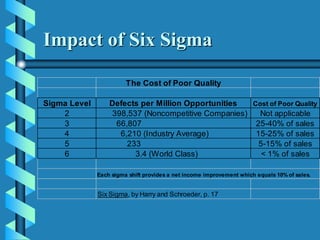
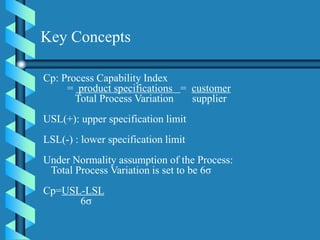
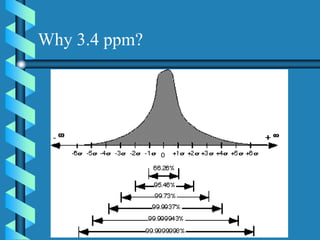
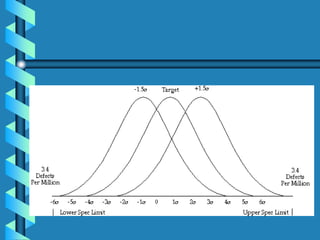
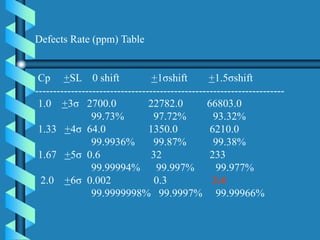
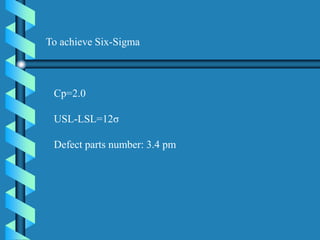
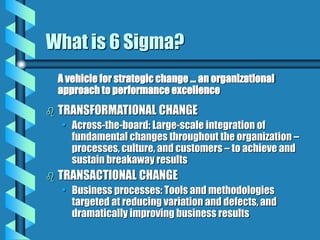
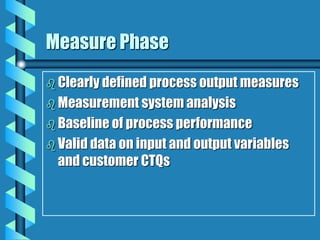
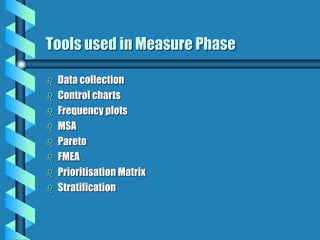
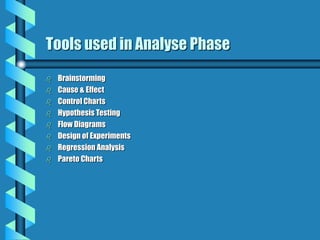
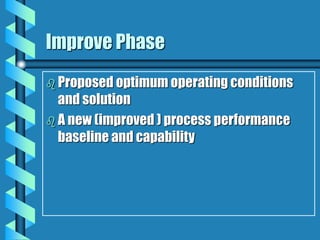
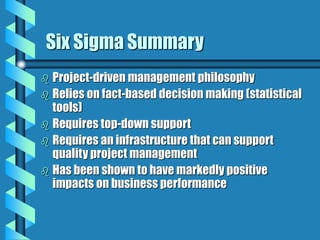
“Six Sigma: A comprehensive and flexible system for achieving, sustaining
and maximizing business success. Six sigma is uniquely driven by a close
understanding of customer needs, disciplined use of facts, data, and
statistical analysis and diligent attention to managing, improving, and
reinventing business processes.”
- Peter S. Pande
Defining Six Sigma (6 )
The History of Six Sigma
 1987 Motorola introduced Quality Program now
known as Six Sigma.
 Allied Signal picked it up.
 G.E. Success….
• Capital Services
• Medical Systems (CAT Scan)
The Cost of Poor Quality
Sigma Level Defects per Million Opportunities Cost of Poor Quality
2 398,537 (Noncompetitive Companies) Not applicable
3 66,807 25-40% of sales
4 6,210 (Industry Average) 15-25% of sales
5 233 5-15% of sales
6 3.4 (World Class) < 1% of sales
Each sigma shift provides a net income improvement which equals 10% of sales.
Six Sigma, by Harry and Schroeder, p. 17
Impact of Six Sigma
Cp: Process Capability Index
= product specifications = customer
Total Process Variation supplier
USL(+): upper specification limit
LSL(-) : lower specification limit
Under Normality assumption of the Process:
Total Process Variation is set to be 6σ
Cp=USL-LSL
6σ
Key Concepts
The Greek symbol (sigma) refers to the amount of variation
in a process around the mean value for that process
Processes have acceptable upper and lower limits
Six Sigma is concerned with reducing the variations to get
more output within those limits
Defining Six Sigma (6 )

Units of Measure
LSL USL
Poor Process
Capability
Very High
Probability
of Defects
LSL USL
Excellent
Process
Capability
Very Low
Probability
of Defects
Very High
Probability
of Defects
Very Low
Probability
of Defects
Units of MeasureUnits of Measure

Low Sigma High Sigma
Units of Measure
Performance
Limit
Probability
of a Defect
Area of Yield
A metric that indicates how well a process is performing.
Higher is better
Measures the capability of the process to perform defect-
free work
Also known as “z”, it is based on standard deviation for
continuous data
For discrete data it is calculated from DPMO
Why 3.4 ppm?
Cp +SL 0 shift +1σshift +1.5σshift
----------------------------------------------------------------------
1.0 +3σ 2700.0 22782.0 66803.0
99.73% 97.72% 93.32%
1.33 +4σ 64.0 1350.0 6210.0
99.9936% 99.87% 99.38%
1.67 +5σ 0.6 32 233
99.99994% 99.997% 99.977%
2.0 +6σ 0.002 0.3 3.4
99.9999998% 99.9997% 99.99966%
Defects Rate (ppm) Table
To achieve Six-Sigma
Cp=2.0
USL-LSL=12σ
Defect parts number: 3.4 pm
What is 6 Sigma?
A vehicle for strategic change ... an organizational
approach to performance excellence
 TRANSFORMATIONAL CHANGE
• Across-the-board: Large-scale integration of
fundamental changes throughout the organization –
processes, culture, and customers – to achieve and
sustain breakaway results
 TRANSACTIONAL CHANGE
• Business processes: Tools and methodologies
targeted at reducing variation and defects, and
dramatically improving business results
Designing robust processes:
A structured methodology, DFSS (Design for Six Sigma),
assures that:
New processes have high capability (satisfy customers
and produce low defects) right from the start
New processes are designed to minimize the risk of
failure
Six Sigma methodology
Improving existing processes:
A structured methodology, DMAIC (Define, Measure,
Analyse, Improve, Control):
Uses statistical tools to locate and eliminate the root
causes of otherwise intractable problems
Focuses on removal and prevention of defects
Reduces process variability
Six Sigma methodology
Controlling processes, so that their behavior is predictable
(within limits). Six Sigma provides:
Special tools and techniques including a framework:
For measuring and judging process variation
For detecting special causes
To providing early warning of process changes
The ability to calculate Process Sigma, an index of process
performance
Six Sigma methodology
Define phase
 First phase of DMAIC methodology
 Identifies products and or processes to be
improved
 Ensures resources in place for the improved
project
 Establishes expectation of the improvement
project
 Maintains focus of breakthrough strategy on
customers requirements
Define Phase Road Map
Problem Statement
Identify customer
Identify CTQs
High level process map
Tools commonly used in Define Phase
 Project Charter
 SIPOC
 VOC
 KANO Model
 AFFINITY DIAGRAM
Project Selection
Impact
 Business Impact
• Revenue Growth
• Cost Reduction
• Capital Reduction
• Key Business Objectives
• On Time Delivery
• Lead Time
• Quality
• Customer Satisfaction
 Impact on Operational Excellence Metrics
Evaluate and Rank Suggestions
Effort and Risk
 Effort required
• People Resources
• Capital Resources
• Duration of Project
 Probability of success
• Technical Risk
• Data available
• Knowledge of process
• Management Risk
• Aligned with objectives
• Impact vs. Risk vs. Effort
• Assess ROI (Return On Investment)
• Assign priorities to projects
Evaluate and Rank Suggestions
Example tool to rank projects
#
Mfg
(M)
or
Admin
(A) Project Description
RevenueGrowth
CostReduction
CapitalReduction
KeyBusiness
Objective
OnTimeDelivery
LeadTime
Quality
Customer
Satisfaction
TotalImpact
PeopleResources
CapitalResources
DurationofProject
TotalEffort
TechnicalRisk
ManagementRisk
TotalRisk
Variable weightings 20% 15% 10% 15% 20% 5% 5% 10% 100% 50% 20% 30% 100% 40% 60% 100%
1 A Customer Billing Errors 0 2 0 4 4 2 2 5 2.4 2 1 3 2.1 1 4 2.8
2 M
Warranty
scrap warranty vs sales
0 2 0 1 1 0 3 3 1.1 4 4 5 4.3 4 2 2.8
3 A Vendor Delivery Performance 0 2 2 2 5 4 3 0 2.2 1 1 3 1.6 1 2 1.6
4 M On Time Shipping Performance 2 1 2 4 5 0 1 5 2.9 4 1 2 2.8 1 3 2.2
5 A
Hiring and Retention
20% - 24% Turnover 0 3 0 2 1 0 3 2 1.3 3 2 4 3.1 1 4 2.8
6 A
New Product Development Cycle Time
3 4 2 5 3 3 4 5 3.6 5 3 5 4.6 5 5 5.0
7 M
Manufacturing Maintenance
Tooling Maintenance
0 3 0 1 2 3 1 0 1.2 1 4 1 1.6 1 1 1.0
8 A Day Sales Outstanding (DSO) 0 0 4 2 0 0 0 0 0.7 1 0 2 1.1 1 1 1.0
9 M FTYof 65% on product 123 4 4 2 5 4 4 5 5 4.1 2 1 1 1.5 2 1 1.4
RiskProject Information Impact Effort
Measure Phase
 Clearly defined process output measures
 Measurement system analysis
 Baseline of process performance
 Valid data on input and output variables
and customer CTQs
Tools used in Measure Phase
 Data collection
 Control charts
 Frequency plots
 MSA
 Pareto
 FMEA
 Prioritisation Matrix
 Stratification
Analyse Phase
 Prioritized list of potential sources of
variation
 P value establishing level of significance
and probability
 Statistical analysis of data, input variables
versus output variables, and sources of
variation
Tools used in Analyse Phase
 Brainstorming
 Cause & Effect
 Control Charts
 Hypothesis Testing
 Flow Diagrams
 Design of Experiments
 Regression Analysis
 Pareto Charts
Improve Phase
 Proposed optimum operating conditions
and solution
 A new (improved ) process performance
baseline and capability
Tools used in improvement phase
 Brainstorming
 Creativity Techniques
 Hypothesis Testing
 Design of Experiments
 FMEA
 Flow Diagrams
 Cost / Benefit Techniques
Control Phase
 Approved control plan encompassing
documentation required to maintain
improvements
 Documented project and process
improvements
 Statistically validated process
performance monitoring vehicle
Tools used in control phase
 Control Charts
 Flow Diagrams
 Control plans
Basic Implementation
Roadmap
Understand and Define
Entire Value Streams
Deploy Key Business Objectives
- Measure and target (metrics)
- Align and involve all employees
- Develop and motivate
Define, Measure, Analyze, Improve
Identify root causes, prioritize, eliminate waste,
make things flow and pulled by customers
Control
-Sustain Improvement
-Drive Towards Perfection
Identify Customer Requirements
Vision (Strategic Business Plan)
Continuous Improvement (DMAIC)
Identify Customer Requirements
Key Six Sigma Roles
 The Leadership Group
• Be actively involved from outset
• Develop a strategic plan
• Establish Roles and Infrastructure
• Establish supporting policies
– Job descriptions
– Reward/Compensation systems
– Career paths
Key Six Sigma Roles
 The Leadership Group (cont’d)
• Select projects
• Prioritize projects and allocate resources
• Facilitate, guide, manage
Key Six Sigma Roles
 The Champions
• Find appropriate projects
• Represent projects to the leadership
• Provide coaching
• Ensure allocation of resources
• Resolve issues
Key Six Sigma Roles
 Master Back Belts
• Coach and support project leads
• Work as a change agent
• Train others in the use of six sigma tools
Key Six Sigma Roles
 Black Belts
• Highly trained experts
• Manage project leaders
• Lead project teams
Key Six Sigma Roles
 Green Belts
• Trained in the use of statistical tools
• Lead project teams
• Participate on project teams
Six Sigma Summary
 Project-driven management philosophy
 Relies on fact-based decision making (statistical
tools)
 Requires top-down support
 Requires an infrastructure that can support
quality project management
 Has been shown to have markedly positive
impacts on business performance
Project Selection
 What are the largest customer complaints
?
 What processes are currently causing the
largest number of defects ?
 How is our product or service compared to
competition ?
 Business goals of the company
Good six sigma project
 Process is supportive of key business objectives
 Process is focussed on an ongoing process
 The process is measurable
 Project is linked to customer CTQ (Critical to
Satisfaction)
 Should have a high probability of success and be
executable in 4~6 months
• Develop a focused Problem Statement and Objective
• Develop a Process Map and/or FMEA
• Develop a Current State Map
• Identify the response variable(s) and how to measure them
• Analyze measurement system capability
• Assess the specification (Is one in place? Is it the right one?)
Practical
Problem
Problem
Definition
• Characterize the response, look at the raw data
• Time Observation • Spaghetti Diagram • Takt Time
• Future State Maps
• Standard Work Combination
• Use Graphical Analysis, Multi-Vari, ANOVA and basic
statistical tools to identify the likely families of variability
Problem
Solution
• Identify the likely X’s
• 5S • Set Up Time Reduction (SMED)
• Material Replenishment Systems
• Level Loading / Line Leveling
• Cell Design • Visual Controls
• Use Design of Experiments to find the critical few X’s
• Move the distribution; Shrink the spread; Confirm the results
Problem
Control
• Mistake Proof the process (Poka-Yoke)
• Tolerance the process
• Measure the final capability
• Place appropriate process controls on
the critical X’s
• Document the effort and results
• Standard Work • TPM
Identify
Problem
• Strategic Link to Business Plan defined in Project Selection Process
• Defined Business Impact with Op Ex Champion support
• Structured Brainstorming at all organizational levels
• Cause and Effect Diagrams identifying critical factors
• Primary and Secondary Metrics defined and charted
• Multi-Level Pareto Charts to confirm project focus
 What do you want to know?
 How do you want to see what it is that you need
to know?
 What type of tool will generate what it is that you
need to see?
 What type of data is required of the selected tool?
 Where can you get the required type of data?
Problem Solving
Plan Execute
Execute Plan
DMAICMethodology
Based in part on Six Sigma Methodology developed by GE Medical Systems and Six Sigma Academy, Inc.
Six sigma training
Six sigma training

Six sigma training

  • 2.
    “Six Sigma: Acomprehensive and flexible system for achieving, sustaining and maximizing business success. Six sigma is uniquely driven by a close understanding of customer needs, disciplined use of facts, data, and statistical analysis and diligent attention to managing, improving, and reinventing business processes.” - Peter S. Pande Defining Six Sigma (6 )
  • 3.
    The History ofSix Sigma  1987 Motorola introduced Quality Program now known as Six Sigma.  Allied Signal picked it up.  G.E. Success…. • Capital Services • Medical Systems (CAT Scan)
  • 4.
    The Cost ofPoor Quality Sigma Level Defects per Million Opportunities Cost of Poor Quality 2 398,537 (Noncompetitive Companies) Not applicable 3 66,807 25-40% of sales 4 6,210 (Industry Average) 15-25% of sales 5 233 5-15% of sales 6 3.4 (World Class) < 1% of sales Each sigma shift provides a net income improvement which equals 10% of sales. Six Sigma, by Harry and Schroeder, p. 17 Impact of Six Sigma
  • 5.
    Cp: Process CapabilityIndex = product specifications = customer Total Process Variation supplier USL(+): upper specification limit LSL(-) : lower specification limit Under Normality assumption of the Process: Total Process Variation is set to be 6σ Cp=USL-LSL 6σ Key Concepts
  • 6.
    The Greek symbol(sigma) refers to the amount of variation in a process around the mean value for that process Processes have acceptable upper and lower limits Six Sigma is concerned with reducing the variations to get more output within those limits Defining Six Sigma (6 ) 
  • 7.
    Units of Measure LSLUSL Poor Process Capability Very High Probability of Defects LSL USL Excellent Process Capability Very Low Probability of Defects Very High Probability of Defects Very Low Probability of Defects Units of MeasureUnits of Measure  Low Sigma High Sigma Units of Measure Performance Limit Probability of a Defect Area of Yield
  • 8.
    A metric thatindicates how well a process is performing. Higher is better Measures the capability of the process to perform defect- free work Also known as “z”, it is based on standard deviation for continuous data For discrete data it is calculated from DPMO
  • 9.
  • 11.
    Cp +SL 0shift +1σshift +1.5σshift ---------------------------------------------------------------------- 1.0 +3σ 2700.0 22782.0 66803.0 99.73% 97.72% 93.32% 1.33 +4σ 64.0 1350.0 6210.0 99.9936% 99.87% 99.38% 1.67 +5σ 0.6 32 233 99.99994% 99.997% 99.977% 2.0 +6σ 0.002 0.3 3.4 99.9999998% 99.9997% 99.99966% Defects Rate (ppm) Table
  • 12.
  • 13.
    What is 6Sigma? A vehicle for strategic change ... an organizational approach to performance excellence  TRANSFORMATIONAL CHANGE • Across-the-board: Large-scale integration of fundamental changes throughout the organization – processes, culture, and customers – to achieve and sustain breakaway results  TRANSACTIONAL CHANGE • Business processes: Tools and methodologies targeted at reducing variation and defects, and dramatically improving business results
  • 14.
    Designing robust processes: Astructured methodology, DFSS (Design for Six Sigma), assures that: New processes have high capability (satisfy customers and produce low defects) right from the start New processes are designed to minimize the risk of failure Six Sigma methodology
  • 15.
    Improving existing processes: Astructured methodology, DMAIC (Define, Measure, Analyse, Improve, Control): Uses statistical tools to locate and eliminate the root causes of otherwise intractable problems Focuses on removal and prevention of defects Reduces process variability Six Sigma methodology
  • 16.
    Controlling processes, sothat their behavior is predictable (within limits). Six Sigma provides: Special tools and techniques including a framework: For measuring and judging process variation For detecting special causes To providing early warning of process changes The ability to calculate Process Sigma, an index of process performance Six Sigma methodology
  • 17.
    Define phase  Firstphase of DMAIC methodology  Identifies products and or processes to be improved  Ensures resources in place for the improved project  Establishes expectation of the improvement project  Maintains focus of breakthrough strategy on customers requirements
  • 18.
    Define Phase RoadMap Problem Statement Identify customer Identify CTQs High level process map
  • 19.
    Tools commonly usedin Define Phase  Project Charter  SIPOC  VOC  KANO Model  AFFINITY DIAGRAM
  • 20.
    Project Selection Impact  BusinessImpact • Revenue Growth • Cost Reduction • Capital Reduction • Key Business Objectives • On Time Delivery • Lead Time • Quality • Customer Satisfaction  Impact on Operational Excellence Metrics
  • 21.
    Evaluate and RankSuggestions Effort and Risk  Effort required • People Resources • Capital Resources • Duration of Project  Probability of success • Technical Risk • Data available • Knowledge of process • Management Risk • Aligned with objectives • Impact vs. Risk vs. Effort • Assess ROI (Return On Investment) • Assign priorities to projects
  • 22.
    Evaluate and RankSuggestions Example tool to rank projects # Mfg (M) or Admin (A) Project Description RevenueGrowth CostReduction CapitalReduction KeyBusiness Objective OnTimeDelivery LeadTime Quality Customer Satisfaction TotalImpact PeopleResources CapitalResources DurationofProject TotalEffort TechnicalRisk ManagementRisk TotalRisk Variable weightings 20% 15% 10% 15% 20% 5% 5% 10% 100% 50% 20% 30% 100% 40% 60% 100% 1 A Customer Billing Errors 0 2 0 4 4 2 2 5 2.4 2 1 3 2.1 1 4 2.8 2 M Warranty scrap warranty vs sales 0 2 0 1 1 0 3 3 1.1 4 4 5 4.3 4 2 2.8 3 A Vendor Delivery Performance 0 2 2 2 5 4 3 0 2.2 1 1 3 1.6 1 2 1.6 4 M On Time Shipping Performance 2 1 2 4 5 0 1 5 2.9 4 1 2 2.8 1 3 2.2 5 A Hiring and Retention 20% - 24% Turnover 0 3 0 2 1 0 3 2 1.3 3 2 4 3.1 1 4 2.8 6 A New Product Development Cycle Time 3 4 2 5 3 3 4 5 3.6 5 3 5 4.6 5 5 5.0 7 M Manufacturing Maintenance Tooling Maintenance 0 3 0 1 2 3 1 0 1.2 1 4 1 1.6 1 1 1.0 8 A Day Sales Outstanding (DSO) 0 0 4 2 0 0 0 0 0.7 1 0 2 1.1 1 1 1.0 9 M FTYof 65% on product 123 4 4 2 5 4 4 5 5 4.1 2 1 1 1.5 2 1 1.4 RiskProject Information Impact Effort
  • 24.
    Measure Phase  Clearlydefined process output measures  Measurement system analysis  Baseline of process performance  Valid data on input and output variables and customer CTQs
  • 25.
    Tools used inMeasure Phase  Data collection  Control charts  Frequency plots  MSA  Pareto  FMEA  Prioritisation Matrix  Stratification
  • 26.
    Analyse Phase  Prioritizedlist of potential sources of variation  P value establishing level of significance and probability  Statistical analysis of data, input variables versus output variables, and sources of variation
  • 27.
    Tools used inAnalyse Phase  Brainstorming  Cause & Effect  Control Charts  Hypothesis Testing  Flow Diagrams  Design of Experiments  Regression Analysis  Pareto Charts
  • 28.
    Improve Phase  Proposedoptimum operating conditions and solution  A new (improved ) process performance baseline and capability
  • 29.
    Tools used inimprovement phase  Brainstorming  Creativity Techniques  Hypothesis Testing  Design of Experiments  FMEA  Flow Diagrams  Cost / Benefit Techniques
  • 30.
    Control Phase  Approvedcontrol plan encompassing documentation required to maintain improvements  Documented project and process improvements  Statistically validated process performance monitoring vehicle
  • 31.
    Tools used incontrol phase  Control Charts  Flow Diagrams  Control plans
  • 32.
    Basic Implementation Roadmap Understand andDefine Entire Value Streams Deploy Key Business Objectives - Measure and target (metrics) - Align and involve all employees - Develop and motivate Define, Measure, Analyze, Improve Identify root causes, prioritize, eliminate waste, make things flow and pulled by customers Control -Sustain Improvement -Drive Towards Perfection Identify Customer Requirements Vision (Strategic Business Plan) Continuous Improvement (DMAIC) Identify Customer Requirements
  • 33.
    Key Six SigmaRoles  The Leadership Group • Be actively involved from outset • Develop a strategic plan • Establish Roles and Infrastructure • Establish supporting policies – Job descriptions – Reward/Compensation systems – Career paths
  • 34.
    Key Six SigmaRoles  The Leadership Group (cont’d) • Select projects • Prioritize projects and allocate resources • Facilitate, guide, manage
  • 35.
    Key Six SigmaRoles  The Champions • Find appropriate projects • Represent projects to the leadership • Provide coaching • Ensure allocation of resources • Resolve issues
  • 36.
    Key Six SigmaRoles  Master Back Belts • Coach and support project leads • Work as a change agent • Train others in the use of six sigma tools
  • 37.
    Key Six SigmaRoles  Black Belts • Highly trained experts • Manage project leaders • Lead project teams
  • 38.
    Key Six SigmaRoles  Green Belts • Trained in the use of statistical tools • Lead project teams • Participate on project teams
  • 39.
    Six Sigma Summary Project-driven management philosophy  Relies on fact-based decision making (statistical tools)  Requires top-down support  Requires an infrastructure that can support quality project management  Has been shown to have markedly positive impacts on business performance
  • 40.
    Project Selection  Whatare the largest customer complaints ?  What processes are currently causing the largest number of defects ?  How is our product or service compared to competition ?  Business goals of the company
  • 41.
    Good six sigmaproject  Process is supportive of key business objectives  Process is focussed on an ongoing process  The process is measurable  Project is linked to customer CTQ (Critical to Satisfaction)  Should have a high probability of success and be executable in 4~6 months
  • 42.
    • Develop afocused Problem Statement and Objective • Develop a Process Map and/or FMEA • Develop a Current State Map • Identify the response variable(s) and how to measure them • Analyze measurement system capability • Assess the specification (Is one in place? Is it the right one?) Practical Problem Problem Definition • Characterize the response, look at the raw data • Time Observation • Spaghetti Diagram • Takt Time • Future State Maps • Standard Work Combination • Use Graphical Analysis, Multi-Vari, ANOVA and basic statistical tools to identify the likely families of variability Problem Solution • Identify the likely X’s • 5S • Set Up Time Reduction (SMED) • Material Replenishment Systems • Level Loading / Line Leveling • Cell Design • Visual Controls • Use Design of Experiments to find the critical few X’s • Move the distribution; Shrink the spread; Confirm the results Problem Control • Mistake Proof the process (Poka-Yoke) • Tolerance the process • Measure the final capability • Place appropriate process controls on the critical X’s • Document the effort and results • Standard Work • TPM Identify Problem • Strategic Link to Business Plan defined in Project Selection Process • Defined Business Impact with Op Ex Champion support • Structured Brainstorming at all organizational levels • Cause and Effect Diagrams identifying critical factors • Primary and Secondary Metrics defined and charted • Multi-Level Pareto Charts to confirm project focus  What do you want to know?  How do you want to see what it is that you need to know?  What type of tool will generate what it is that you need to see?  What type of data is required of the selected tool?  Where can you get the required type of data? Problem Solving Plan Execute Execute Plan DMAICMethodology Based in part on Six Sigma Methodology developed by GE Medical Systems and Six Sigma Academy, Inc.