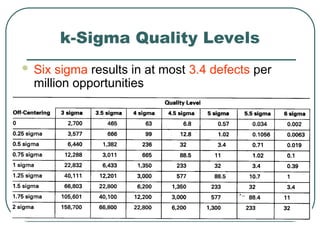
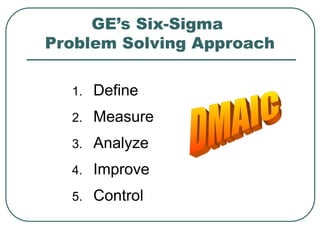
Development of
Six Sigma
 Motorola launched the Six Sigma program in
the 1980s
 General Electric initiated the implementation
of Six Sigma in the mid-1990s
 Organizations in all industries have applied
Six Sigma in recent years
 Six Sigma has replaced TQM and BPR as
the key strategy for quality improvement
Definitions
 – Standard Deviation, a measure of
variability
 Six Sigma – A quality improvement philosophy
that focuses on eliminating defects through
reduction of variation in a process
 Defect – A measurable outcome that is not
within acceptable (specification) limits
TQM Versus Six Sigma
TQM Six Sigma
A management
philosophy of quality
improvement
A philosophy that focuses
on defect reduction and
cost reduction
Encourages involvement
of all employees
Relies on a selected group
of highly-trained employees
Senior management
provides direct support
Senior management is held
accountable for results
Key Success Factors for
Six Sigma
 Committed leadership from top management
 Integration with existing initiatives, business
strategy, and performance measurement
 Process thinking
 Disciplined customer and market intelligence
gathering
 A bottom-line orientation and continuous
reinforcement and rewards
 Training
Six-Sigma Metrics –
Measuring Defect Rate
 Defects per unit (DPU) = number of defects
discovered  number of units produced
 Defects per million opportunities (DPMO) =
number of defects discovered  opportunities
for error  1,000,000
Estimating Defect Rate –
Process Capability Index (Cp)
 USL/LSL : Upper & Lower Specification Limit
 Cp = (USL –LSL) / (6
 Example : Time to process a student loan
application (Standard = 26 working days)
 Specification Limits : 20 to 32 working days
2working days
 Cp = (32 – 20)/ (6*2) = 1.00 (Three Sigma)
Cp Index and DPMO
Cp Index DPMO
1 2,700
1.33 63
1.5 6.8
2 0.002
Estimating Process Capability
Index from A Sample - Cpk Index
 XBAR : average outcome from a sample
 S : standard deviation from a sample
 Cpk = min { (USL-XBAR) / (3S),
(XBAR-LSL) / (3S) }
 Example : XBAR = 25 days, S = 3 days
 Cpk = min { (32-25)/(3*3), (25-20)/(3*3)}
= min {0.77, 0.55} = 0.55
Six-Sigma Quality (Cp =2 with
Mean Shifting from the Center)
Ensuring that process variation is half the design
tolerance (Cp = 2.0) while allowing the mean to shift as
much as 1.5 standard deviations.
k-Sigma Quality Levels
 Six sigma results in at most 3.4 defects per
million opportunities
GE’s Six-Sigma
Problem Solving Approach
1. Define
2. Measure
3. Analyze
4. Improve
5. Control
DMAIC - Define
 Identify customers and their priorities
 Identify business objectives
 Select a six sigma project team
 Define the Critical-to-Quality (CTQ’s)
characteristics that the customers consider
to have the most impact on quality
DMAIC - Measure
 Determine how to measure the processes
•Identify key internal processes that
influence CTQ’s
•Measure the defect rates currently
generated relative to those processes
DMAIC - Analyze
 Determine the most likely causes of
defects.
•Identify key factors that are most
likely to create process variation.
DMAIC - Improve
 Identify means to remove causes of the
defects.
•Confirm the key variables and quantify the
effects on CTQ’s
•Identify maximum acceptable ranges for the
key variables and a system to measure
deviations of the variable
•Modify the process to stay within the
acceptable ranges
DMAIC - Control
 Determine how to maintain the
improvement
•Put tools in place to ensure that the key
variables remain within the maximum
acceptable ranges under the modified
process
Tools for Six-Sigma
and Quality Improvement
 Elementary and advanced statistics
 Product design and reliability analysis
 Measurement
 Process control & Process improvement
 Implementation and teamwork
 Customer survey and feedback
 Lean thinking
Organization for Six Sigma
 Project Champions – project selection
and management, knowledge sharing
 Master Black Belts – instructors, coaches,
technical leaders
 Black Belts – project team leaders and
team members
 Green Belts – project team members,
temporary team members

six sigma 4

  • 1.
    Development of Six Sigma Motorola launched the Six Sigma program in the 1980s  General Electric initiated the implementation of Six Sigma in the mid-1990s  Organizations in all industries have applied Six Sigma in recent years  Six Sigma has replaced TQM and BPR as the key strategy for quality improvement
  • 2.
    Definitions  – StandardDeviation, a measure of variability  Six Sigma – A quality improvement philosophy that focuses on eliminating defects through reduction of variation in a process  Defect – A measurable outcome that is not within acceptable (specification) limits
  • 3.
    TQM Versus SixSigma TQM Six Sigma A management philosophy of quality improvement A philosophy that focuses on defect reduction and cost reduction Encourages involvement of all employees Relies on a selected group of highly-trained employees Senior management provides direct support Senior management is held accountable for results
  • 4.
    Key Success Factorsfor Six Sigma  Committed leadership from top management  Integration with existing initiatives, business strategy, and performance measurement  Process thinking  Disciplined customer and market intelligence gathering  A bottom-line orientation and continuous reinforcement and rewards  Training
  • 5.
    Six-Sigma Metrics – MeasuringDefect Rate  Defects per unit (DPU) = number of defects discovered  number of units produced  Defects per million opportunities (DPMO) = number of defects discovered  opportunities for error  1,000,000
  • 6.
    Estimating Defect Rate– Process Capability Index (Cp)  USL/LSL : Upper & Lower Specification Limit  Cp = (USL –LSL) / (6  Example : Time to process a student loan application (Standard = 26 working days)  Specification Limits : 20 to 32 working days 2working days  Cp = (32 – 20)/ (6*2) = 1.00 (Three Sigma)
  • 7.
    Cp Index andDPMO Cp Index DPMO 1 2,700 1.33 63 1.5 6.8 2 0.002
  • 8.
    Estimating Process Capability Indexfrom A Sample - Cpk Index  XBAR : average outcome from a sample  S : standard deviation from a sample  Cpk = min { (USL-XBAR) / (3S), (XBAR-LSL) / (3S) }  Example : XBAR = 25 days, S = 3 days  Cpk = min { (32-25)/(3*3), (25-20)/(3*3)} = min {0.77, 0.55} = 0.55
  • 9.
    Six-Sigma Quality (Cp=2 with Mean Shifting from the Center) Ensuring that process variation is half the design tolerance (Cp = 2.0) while allowing the mean to shift as much as 1.5 standard deviations.
  • 10.
    k-Sigma Quality Levels Six sigma results in at most 3.4 defects per million opportunities
  • 11.
    GE’s Six-Sigma Problem SolvingApproach 1. Define 2. Measure 3. Analyze 4. Improve 5. Control
  • 12.
    DMAIC - Define Identify customers and their priorities  Identify business objectives  Select a six sigma project team  Define the Critical-to-Quality (CTQ’s) characteristics that the customers consider to have the most impact on quality
  • 13.
    DMAIC - Measure Determine how to measure the processes •Identify key internal processes that influence CTQ’s •Measure the defect rates currently generated relative to those processes
  • 14.
    DMAIC - Analyze Determine the most likely causes of defects. •Identify key factors that are most likely to create process variation.
  • 15.
    DMAIC - Improve Identify means to remove causes of the defects. •Confirm the key variables and quantify the effects on CTQ’s •Identify maximum acceptable ranges for the key variables and a system to measure deviations of the variable •Modify the process to stay within the acceptable ranges
  • 16.
    DMAIC - Control Determine how to maintain the improvement •Put tools in place to ensure that the key variables remain within the maximum acceptable ranges under the modified process
  • 17.
    Tools for Six-Sigma andQuality Improvement  Elementary and advanced statistics  Product design and reliability analysis  Measurement  Process control & Process improvement  Implementation and teamwork  Customer survey and feedback  Lean thinking
  • 18.
    Organization for SixSigma  Project Champions – project selection and management, knowledge sharing  Master Black Belts – instructors, coaches, technical leaders  Black Belts – project team leaders and team members  Green Belts – project team members, temporary team members