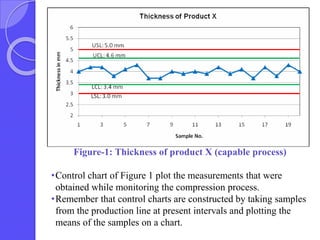
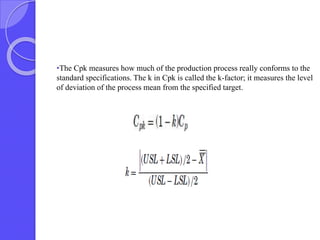
This document discusses process capability analysis, which relates a production process's variability to customer specifications to determine if the process is capable of meeting requirements. It defines key terms like critical-to-quality characteristics, control charts, process capability indices Cp and Cpk. Cp measures a process's potential capability if centered on target, while Cpk considers deviation of the mean. For a process to be capable, its natural variation (control limits) must be narrower than specifications. If Cpk=1 the process is barely capable, and if Cpk<1 the process is incapable and requires improvement. Process capability analysis assumes an in-control, stable production process.
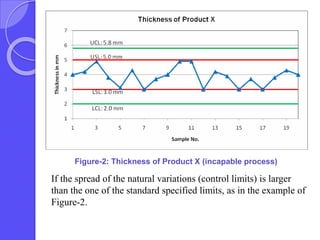


![CTEV [ clubfoot] DR ARUN LAL ,DR MOHAMED ASHRAF travancore medical college k...](https://cdn.slidesharecdn.com/ss_thumbnails/ctevclubfootdrarunlaldrmohamedashraftravancoremedicalcollegekollamkeralaindia-260208063247-18fc466c-thumbnail.jpg?width=640&height=640&fit=bounds)


