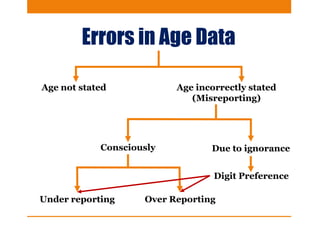
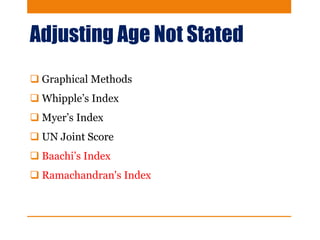
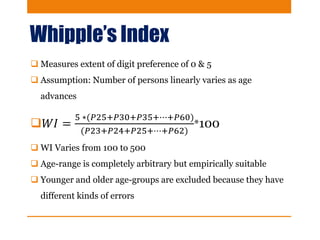
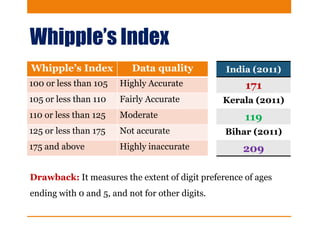
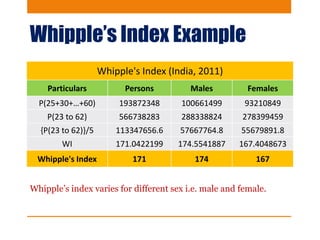
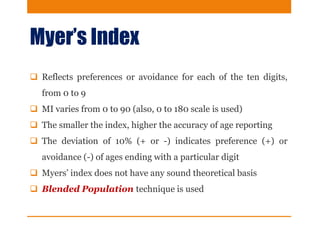
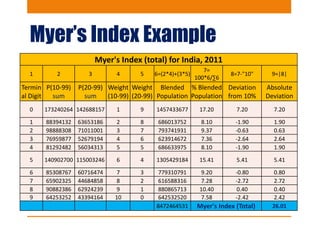
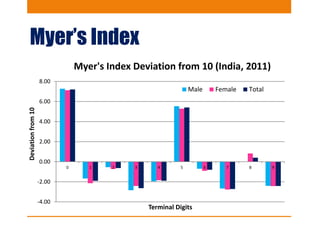
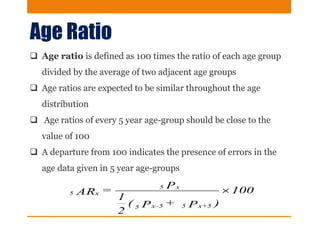
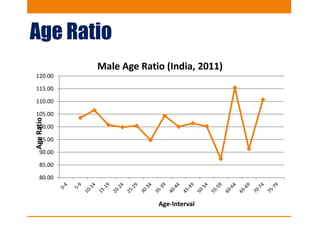
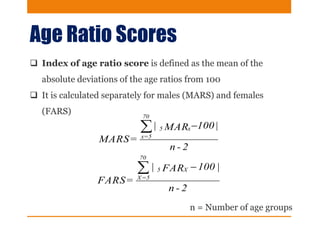
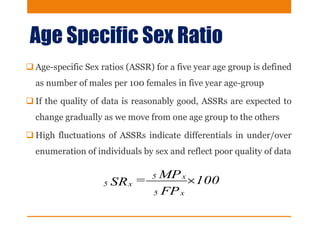
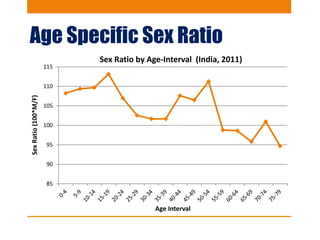
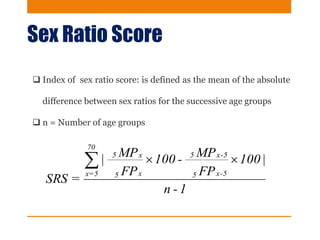
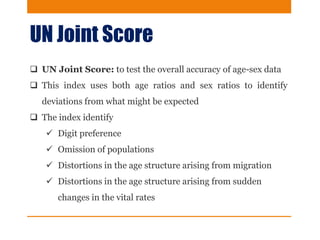
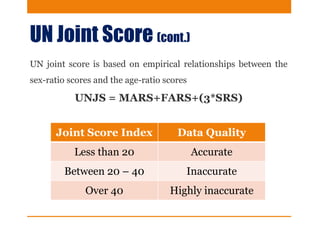
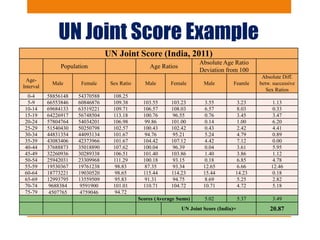
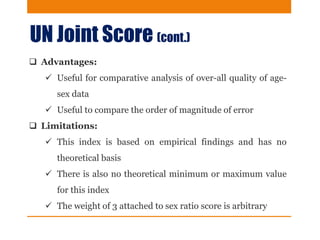
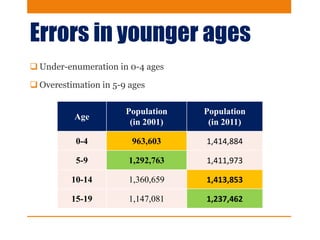
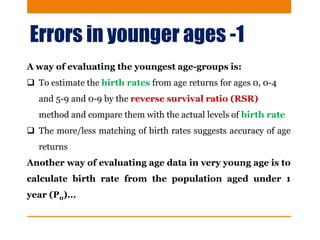
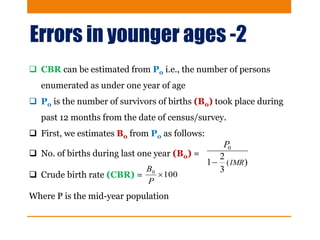
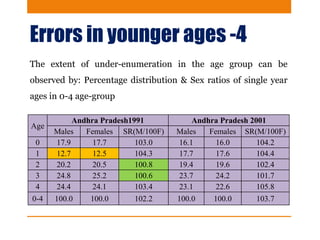
Evaluation of Age Data
Nand Lal Mishra
IIPS, Mumbai-400088
Errors in Age Data
Age not stated Age incorrectly stated
(Misreporting)
Consciously Due to ignorance
Over ReportingUnder reporting
Digit Preference
Adjusting Age Not Stated
 Graphical Methods
 Whipple’s Index
 Myer’s Index
 UN Joint Score
 Baachi’s Index
 Ramachandran's Index
Graphical Method
0
5
10
15
20
25
30
35
0 5 10 15 20 25 30 35 40 45 50 55 60 65 70 75 80 85 90 95 100+
Population(inmillions)
Age
Single Year Age Distribution of India (2011)
Persons
Whipple’s Index
 Measures extent of digit preference of 0 & 5
 Assumption: Number of persons linearly varies as age
advances
𝑊𝐼 =
5 ∗(𝑃25+𝑃30+𝑃35+⋯+𝑃60)
(𝑃23+𝑃24+𝑃25+⋯+𝑃62)
*100
 WI Varies from 100 to 500
 Age-range is completely arbitrary but empirically suitable
 Younger and older age-groups are excluded because they have
different kinds of errors
Whipple’s Index
Whipple’s Index Data quality
100 or less than 105 Highly Accurate
105 or less than 110 Fairly Accurate
110 or less than 125 Moderate
125 or less than 175 Not accurate
175 and above Highly inaccurate
Drawback: It measures the extent of digit preference of ages
ending with 0 and 5, and not for other digits.
India (2011)
171
Kerala (2011)
119
Bihar (2011)
209
Whipple’s Index Example
Whipple's Index (India, 2011)
Particulars Persons Males Females
P(25+30+…+60) 193872348 100661499 93210849
P(23 to 62) 566738283 288338824 278399459
{P(23 to 62)}/5 113347656.6 57667764.8 55679891.8
WI 171.0422199 174.5541887 167.4048673
Whipple's Index 171 174 167
Whipple’s index varies for different sex i.e. male and female.
Myer’s Index
 Reflects preferences or avoidance for each of the ten digits,
from 0 to 9
 MI varies from 0 to 90 (also, 0 to 180 scale is used)
 The smaller the index, higher the accuracy of age reporting
 The deviation of 10% (+ or -) indicates preference (+) or
avoidance (-) of ages ending with a particular digit
 Myers’ index does not have any sound theoretical basis
 Blended Population technique is used
Myer’s Index Example
Myer's Index (total) for India, 2011
1 2 3 4 5 6=(2*4)+(3*5)
7=
100*6/∑6
8=7-"10" 9=|8|
Termin
al Digit
P(10-99)
sum
P(20-99)
sum
Weight
(10-99)
Weight
(20-99)
Blended
Population
% Blended
Population
Deviation
from 10%
Absolute
Deviation
0 173240264 142688157 1 9 1457433677 17.20 7.20 7.20
1 88394132 63653186 2 8 686013752 8.10 -1.90 1.90
2 98888308 71011001 3 7 793741931 9.37 -0.63 0.63
3 76959877 52679194 4 6 623914672 7.36 -2.64 2.64
4 81292482 56034313 5 5 686633975 8.10 -1.90 1.90
5 140902700 115003246 6 4 1305429184 15.41 5.41 5.41
6 85308767 60716474 7 3 779310791 9.20 -0.80 0.80
7 65902325 44684858 8 2 616588316 7.28 -2.72 2.72
8 90882386 62924239 9 1 880865713 10.40 0.40 0.40
9 64253252 43394164 10 0 642532520 7.58 -2.42 2.42
8472464531 Myer's Index (Total) 26.01
Myer’s Index
-4.00
-2.00
0.00
2.00
4.00
6.00
8.00
0 1 2 3 4 5 6 7 8 9
Deviationfrom10
Terminal Digits
Myer's Index Deviation from 10 (India, 2011)
Male Female Total
Age Ratio
 Age ratio is defined as 100 times the ratio of each age group
divided by the average of two adjacent age groups
 Age ratios are expected to be similar throughout the age
distribution
 Age ratios of every 5 year age-group should be close to the
value of 100
 A departure from 100 indicates the presence of errors in the
age data given in 5 year age-groups
100
)P+P(
2
1
P=AR
+5x55-x5
x5
x5 
Age Ratio
80.00
85.00
90.00
95.00
100.00
105.00
110.00
115.00
120.00
AgeRatio
Age-Interval
Male Age Ratio (India, 2011)
Age Ratio Scores
 Index of age ratio score is defined as the mean of the
absolute deviations of the age ratios from 100
 It is calculated separately for males (MARS) and females
(FARS)
2-n
|100FAR|
=FARS
2-n
|100MAR|
=MARS
X5
70
5=X
x5
70
5=x




n = Number of age groups
Age Specific Sex Ratio
 Age-specific Sex ratios (ASSR) for a five year age group is defined
as number of males per 100 females in five year age-group
 If the quality of data is reasonably good, ASSRs are expected to
change gradually as we move from one age group to the others
 High fluctuations of ASSRs indicate differentials in under/over
enumeration of individuals by sex and reflect poor quality of data
100
FP
MP=SR
x5
x5
x5 
Age Specific Sex Ratio
85
90
95
100
105
110
115
SexRatio(100*M/F)
Age Interval
Sex Ratio by Age-Interval (India, 2011)
Sex Ratio Score
 Index of sex ratio score: is defined as the mean of the absolute
difference between sex ratios for the successive age groups
 n = Number of age groups
1-n
|100
FP
MP-100
FP
MP|
=SRS
5-x5
5-x5
x5
x5
70
5=x

UN Joint Score
 UN Joint Score: to test the overall accuracy of age-sex data
 This index uses both age ratios and sex ratios to identify
deviations from what might be expected
 The index identify
 Digit preference
 Omission of populations
 Distortions in the age structure arising from migration
 Distortions in the age structure arising from sudden
changes in the vital rates
UN Joint Score (cont.)
UN joint score is based on empirical relationships between the
sex-ratio scores and the age-ratio scores
UNJS = MARS+FARS+(3*SRS)
Joint Score Index Data Quality
Less than 20 Accurate
Between 20 – 40 Inaccurate
Over 40 Highly inaccurate
UN Joint Score Example
UN Joint Score (India, 2011)
Population Age Ratios
Absolute Age Ratio
Deviation from 100
Age-
Interval
Male Female Sex Ratio Male Female Male Feamle
Absolute Diff.
betw. successive
Sex Ratios
0-4 58856148 54370588 108.25
5-9 66553846 60846876 109.38 103.55 103.23 3.55 3.23 1.13
10-14 69684133 63519221 109.71 106.57 108.03 6.57 8.03 0.33
15-19 64226917 56748504 113.18 100.76 96.55 0.76 3.45 3.47
20-24 57804764 54034201 106.98 99.86 101.00 0.14 1.00 6.20
25-29 51540430 50250798 102.57 100.43 102.42 0.43 2.42 4.41
30-34 44831354 44093134 101.67 94.76 95.21 5.24 4.79 0.89
35-39 43083406 42373966 101.67 104.42 107.12 4.42 7.12 0.00
40-44 37688873 35018890 107.62 100.04 96.39 0.04 3.61 5.95
45-49 32260936 30289338 106.51 101.40 103.86 1.40 3.86 1.12
50-54 25942031 23309968 111.29 100.18 93.15 0.18 6.85 4.78
55-59 19530367 19761238 98.83 87.35 93.34 12.65 6.66 12.46
60-64 18773221 19030520 98.65 115.44 114.23 15.44 14.23 0.18
65-69 12993795 13559509 95.83 91.31 94.75 8.69 5.25 2.82
70-74 9688384 9591900 101.01 110.71 104.72 10.71 4.72 5.18
75-79 4507765 4759046 94.72
Scores (Average Sums) 5.02 5.37 3.49
UN Joint Score (India)= 20.87
UN Joint Score (cont.)
 Advantages:
 Useful for comparative analysis of over-all quality of age-
sex data
 Useful to compare the order of magnitude of error
 Limitations:
 This index is based on empirical findings and has no
theoretical basis
 There is also no theoretical minimum or maximum value
for this index
 The weight of 3 attached to sex ratio score is arbitrary
Errors in younger ages
 Under-enumeration in 0-4 ages
 Overestimation in 5-9 ages
Age
Population
(in 2001)
Population
(in 2011)
0-4 963,603 1,414,884
5-9 1,292,763 1,411,973
10-14 1,360,659 1,413,853
15-19 1,147,081 1,237,462
Errors in younger ages -1
A way of evaluating the youngest age-groups is:
 To estimate the birth rates from age returns for ages 0, 0-4
and 5-9 and 0-9 by the reverse survival ratio (RSR)
method and compare them with the actual levels of birth rate
 The more/less matching of birth rates suggests accuracy of age
returns
Another way of evaluating age data in very young age is to
calculate birth rate from the population aged under 1
year (P0)…
Errors in younger ages -2
 CBR can be estimated from P0 i.e., the number of persons
enumerated as under one year of age
 P0 is the number of survivors of births (B0) took place during
past 12 months from the date of census/survey.
 First, we estimates B0 from P0 as follows:
 No. of births during last one year (B0) =
 Crude birth rate (CBR) =
Where P is the mid-year population
)
3
2
1 (
0
IMR
P

1000

P
B
Errors in younger ages -3
 If the CBR, thus, estimated is less than the actual CBR, it
implies population under age one (P0) is under enumerated
and vice versa.
 With the help of accurate value of CBR, percentage of
under/over enumeration of P0 can also be estimated.
Errors in younger ages -4
The extent of under-enumeration in the age group can be
observed by: Percentage distribution & Sex ratios of single year
ages in 0-4 age-group
Age
Andhra Pradesh1991 Andhra Pradesh 2001
Males Females SR(M/100F) Males Females SR(M/100F)
0 17.9 17.7 103.0 16.1 16.0 104.2
1 12.7 12.5 104.3 17.7 17.6 104.4
2 20.2 20.5 100.8 19.4 19.6 102.4
3 24.8 25.2 100.6 23.7 24.2 101.7
4 24.4 24.1 103.4 23.1 22.6 105.8
0-4 100.0 100.0 102.2 100.0 100.0 103.7
Errors in older ages
 Generally, old people of age 70 tend to exaggerate their ages,
which results in a comparatively higher number of persons in
the ages 80 and above, at the cost of age group 75-79
 By taking the last age interval open as 70 and above, these
errors can be minimised
THANK YOU !
nandlal.iips@gmail.com

Evaluation of Age Data

  • 1.
    Evaluation of AgeData Nand Lal Mishra IIPS, Mumbai-400088
  • 2.
    Errors in AgeData Age not stated Age incorrectly stated (Misreporting) Consciously Due to ignorance Over ReportingUnder reporting Digit Preference
  • 3.
    Adjusting Age NotStated  Graphical Methods  Whipple’s Index  Myer’s Index  UN Joint Score  Baachi’s Index  Ramachandran's Index
  • 4.
    Graphical Method 0 5 10 15 20 25 30 35 0 510 15 20 25 30 35 40 45 50 55 60 65 70 75 80 85 90 95 100+ Population(inmillions) Age Single Year Age Distribution of India (2011) Persons
  • 5.
    Whipple’s Index  Measuresextent of digit preference of 0 & 5  Assumption: Number of persons linearly varies as age advances 𝑊𝐼 = 5 ∗(𝑃25+𝑃30+𝑃35+⋯+𝑃60) (𝑃23+𝑃24+𝑃25+⋯+𝑃62) *100  WI Varies from 100 to 500  Age-range is completely arbitrary but empirically suitable  Younger and older age-groups are excluded because they have different kinds of errors
  • 6.
    Whipple’s Index Whipple’s IndexData quality 100 or less than 105 Highly Accurate 105 or less than 110 Fairly Accurate 110 or less than 125 Moderate 125 or less than 175 Not accurate 175 and above Highly inaccurate Drawback: It measures the extent of digit preference of ages ending with 0 and 5, and not for other digits. India (2011) 171 Kerala (2011) 119 Bihar (2011) 209
  • 7.
    Whipple’s Index Example Whipple'sIndex (India, 2011) Particulars Persons Males Females P(25+30+…+60) 193872348 100661499 93210849 P(23 to 62) 566738283 288338824 278399459 {P(23 to 62)}/5 113347656.6 57667764.8 55679891.8 WI 171.0422199 174.5541887 167.4048673 Whipple's Index 171 174 167 Whipple’s index varies for different sex i.e. male and female.
  • 8.
    Myer’s Index  Reflectspreferences or avoidance for each of the ten digits, from 0 to 9  MI varies from 0 to 90 (also, 0 to 180 scale is used)  The smaller the index, higher the accuracy of age reporting  The deviation of 10% (+ or -) indicates preference (+) or avoidance (-) of ages ending with a particular digit  Myers’ index does not have any sound theoretical basis  Blended Population technique is used
  • 9.
    Myer’s Index Example Myer'sIndex (total) for India, 2011 1 2 3 4 5 6=(2*4)+(3*5) 7= 100*6/∑6 8=7-"10" 9=|8| Termin al Digit P(10-99) sum P(20-99) sum Weight (10-99) Weight (20-99) Blended Population % Blended Population Deviation from 10% Absolute Deviation 0 173240264 142688157 1 9 1457433677 17.20 7.20 7.20 1 88394132 63653186 2 8 686013752 8.10 -1.90 1.90 2 98888308 71011001 3 7 793741931 9.37 -0.63 0.63 3 76959877 52679194 4 6 623914672 7.36 -2.64 2.64 4 81292482 56034313 5 5 686633975 8.10 -1.90 1.90 5 140902700 115003246 6 4 1305429184 15.41 5.41 5.41 6 85308767 60716474 7 3 779310791 9.20 -0.80 0.80 7 65902325 44684858 8 2 616588316 7.28 -2.72 2.72 8 90882386 62924239 9 1 880865713 10.40 0.40 0.40 9 64253252 43394164 10 0 642532520 7.58 -2.42 2.42 8472464531 Myer's Index (Total) 26.01
  • 10.
    Myer’s Index -4.00 -2.00 0.00 2.00 4.00 6.00 8.00 0 12 3 4 5 6 7 8 9 Deviationfrom10 Terminal Digits Myer's Index Deviation from 10 (India, 2011) Male Female Total
  • 11.
    Age Ratio  Ageratio is defined as 100 times the ratio of each age group divided by the average of two adjacent age groups  Age ratios are expected to be similar throughout the age distribution  Age ratios of every 5 year age-group should be close to the value of 100  A departure from 100 indicates the presence of errors in the age data given in 5 year age-groups 100 )P+P( 2 1 P=AR +5x55-x5 x5 x5 
  • 12.
  • 13.
    Age Ratio Scores Index of age ratio score is defined as the mean of the absolute deviations of the age ratios from 100  It is calculated separately for males (MARS) and females (FARS) 2-n |100FAR| =FARS 2-n |100MAR| =MARS X5 70 5=X x5 70 5=x     n = Number of age groups
  • 14.
    Age Specific SexRatio  Age-specific Sex ratios (ASSR) for a five year age group is defined as number of males per 100 females in five year age-group  If the quality of data is reasonably good, ASSRs are expected to change gradually as we move from one age group to the others  High fluctuations of ASSRs indicate differentials in under/over enumeration of individuals by sex and reflect poor quality of data 100 FP MP=SR x5 x5 x5 
  • 15.
    Age Specific SexRatio 85 90 95 100 105 110 115 SexRatio(100*M/F) Age Interval Sex Ratio by Age-Interval (India, 2011)
  • 16.
    Sex Ratio Score Index of sex ratio score: is defined as the mean of the absolute difference between sex ratios for the successive age groups  n = Number of age groups 1-n |100 FP MP-100 FP MP| =SRS 5-x5 5-x5 x5 x5 70 5=x 
  • 17.
    UN Joint Score UN Joint Score: to test the overall accuracy of age-sex data  This index uses both age ratios and sex ratios to identify deviations from what might be expected  The index identify  Digit preference  Omission of populations  Distortions in the age structure arising from migration  Distortions in the age structure arising from sudden changes in the vital rates
  • 18.
    UN Joint Score(cont.) UN joint score is based on empirical relationships between the sex-ratio scores and the age-ratio scores UNJS = MARS+FARS+(3*SRS) Joint Score Index Data Quality Less than 20 Accurate Between 20 – 40 Inaccurate Over 40 Highly inaccurate
  • 19.
    UN Joint ScoreExample UN Joint Score (India, 2011) Population Age Ratios Absolute Age Ratio Deviation from 100 Age- Interval Male Female Sex Ratio Male Female Male Feamle Absolute Diff. betw. successive Sex Ratios 0-4 58856148 54370588 108.25 5-9 66553846 60846876 109.38 103.55 103.23 3.55 3.23 1.13 10-14 69684133 63519221 109.71 106.57 108.03 6.57 8.03 0.33 15-19 64226917 56748504 113.18 100.76 96.55 0.76 3.45 3.47 20-24 57804764 54034201 106.98 99.86 101.00 0.14 1.00 6.20 25-29 51540430 50250798 102.57 100.43 102.42 0.43 2.42 4.41 30-34 44831354 44093134 101.67 94.76 95.21 5.24 4.79 0.89 35-39 43083406 42373966 101.67 104.42 107.12 4.42 7.12 0.00 40-44 37688873 35018890 107.62 100.04 96.39 0.04 3.61 5.95 45-49 32260936 30289338 106.51 101.40 103.86 1.40 3.86 1.12 50-54 25942031 23309968 111.29 100.18 93.15 0.18 6.85 4.78 55-59 19530367 19761238 98.83 87.35 93.34 12.65 6.66 12.46 60-64 18773221 19030520 98.65 115.44 114.23 15.44 14.23 0.18 65-69 12993795 13559509 95.83 91.31 94.75 8.69 5.25 2.82 70-74 9688384 9591900 101.01 110.71 104.72 10.71 4.72 5.18 75-79 4507765 4759046 94.72 Scores (Average Sums) 5.02 5.37 3.49 UN Joint Score (India)= 20.87
  • 20.
    UN Joint Score(cont.)  Advantages:  Useful for comparative analysis of over-all quality of age- sex data  Useful to compare the order of magnitude of error  Limitations:  This index is based on empirical findings and has no theoretical basis  There is also no theoretical minimum or maximum value for this index  The weight of 3 attached to sex ratio score is arbitrary
  • 21.
    Errors in youngerages  Under-enumeration in 0-4 ages  Overestimation in 5-9 ages Age Population (in 2001) Population (in 2011) 0-4 963,603 1,414,884 5-9 1,292,763 1,411,973 10-14 1,360,659 1,413,853 15-19 1,147,081 1,237,462
  • 22.
    Errors in youngerages -1 A way of evaluating the youngest age-groups is:  To estimate the birth rates from age returns for ages 0, 0-4 and 5-9 and 0-9 by the reverse survival ratio (RSR) method and compare them with the actual levels of birth rate  The more/less matching of birth rates suggests accuracy of age returns Another way of evaluating age data in very young age is to calculate birth rate from the population aged under 1 year (P0)…
  • 23.
    Errors in youngerages -2  CBR can be estimated from P0 i.e., the number of persons enumerated as under one year of age  P0 is the number of survivors of births (B0) took place during past 12 months from the date of census/survey.  First, we estimates B0 from P0 as follows:  No. of births during last one year (B0) =  Crude birth rate (CBR) = Where P is the mid-year population ) 3 2 1 ( 0 IMR P  1000  P B
  • 24.
    Errors in youngerages -3  If the CBR, thus, estimated is less than the actual CBR, it implies population under age one (P0) is under enumerated and vice versa.  With the help of accurate value of CBR, percentage of under/over enumeration of P0 can also be estimated.
  • 25.
    Errors in youngerages -4 The extent of under-enumeration in the age group can be observed by: Percentage distribution & Sex ratios of single year ages in 0-4 age-group Age Andhra Pradesh1991 Andhra Pradesh 2001 Males Females SR(M/100F) Males Females SR(M/100F) 0 17.9 17.7 103.0 16.1 16.0 104.2 1 12.7 12.5 104.3 17.7 17.6 104.4 2 20.2 20.5 100.8 19.4 19.6 102.4 3 24.8 25.2 100.6 23.7 24.2 101.7 4 24.4 24.1 103.4 23.1 22.6 105.8 0-4 100.0 100.0 102.2 100.0 100.0 103.7
  • 26.
    Errors in olderages  Generally, old people of age 70 tend to exaggerate their ages, which results in a comparatively higher number of persons in the ages 80 and above, at the cost of age group 75-79  By taking the last age interval open as 70 and above, these errors can be minimised
  • 27.