Download as PDF, PPTX


![r= antilog [0.209/5.3397] – 1x100
r= antilog 0.009
r= 1.020 – 1 x 100
r= 2.02 percent
- - - - - - - - - - - - - - - - -
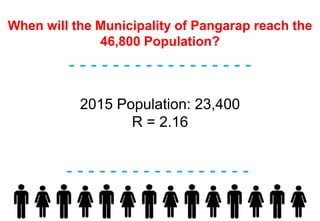
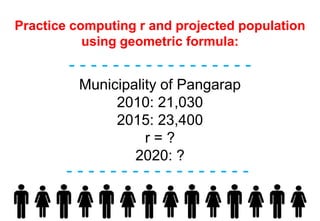
r and projected population using geometric
formula
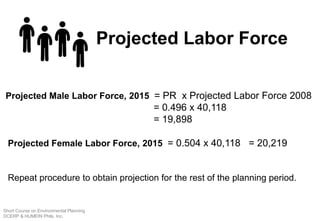
2020=23,400 (1.0202)5
= 25,861](https://image.slidesharecdn.com/jan142017demographicanalysis-170623025038/85/demographic-analysis-57-320.jpg)
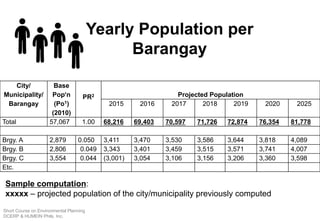
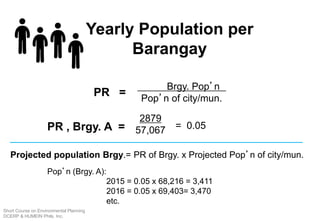
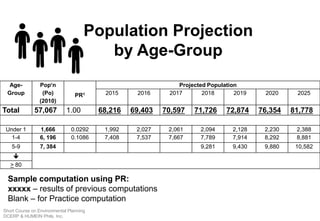


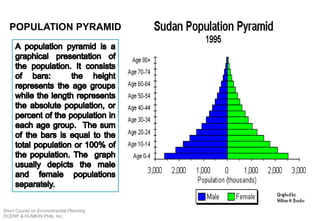
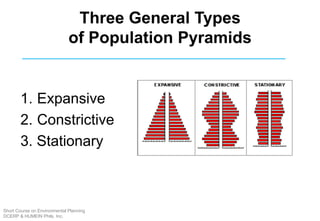
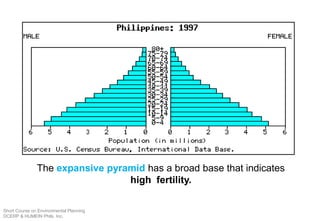
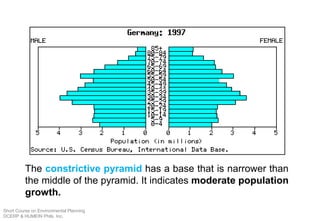
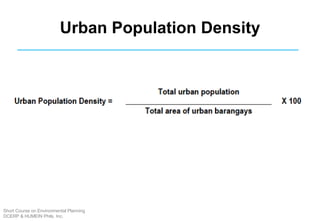
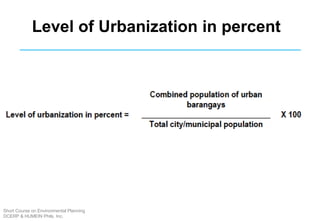
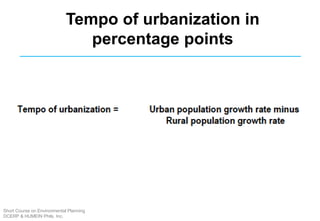


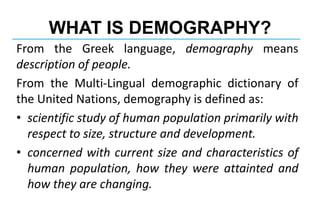
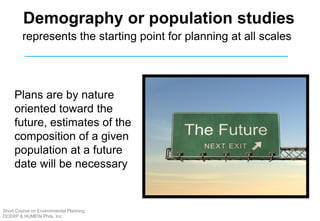
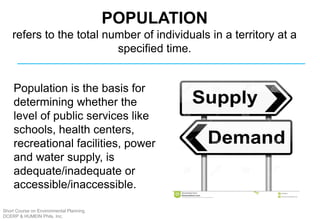
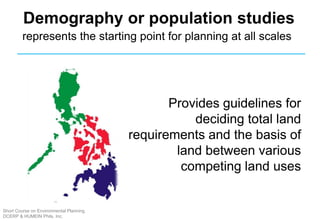
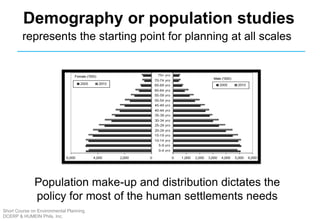
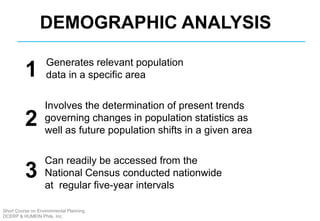
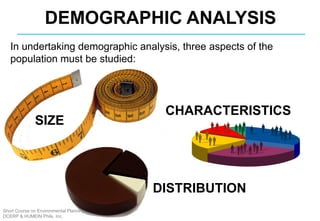
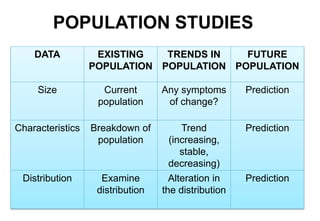
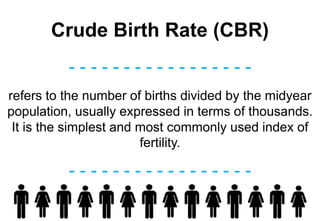
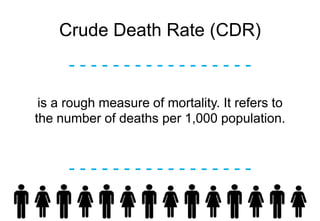
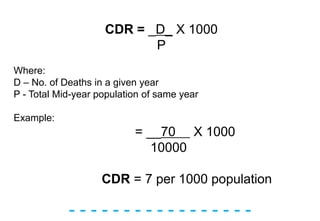
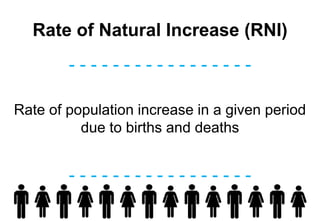
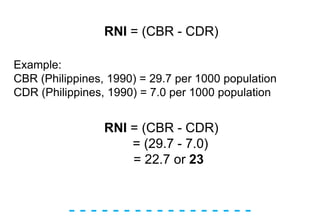
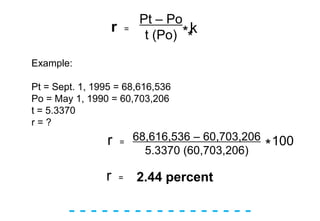
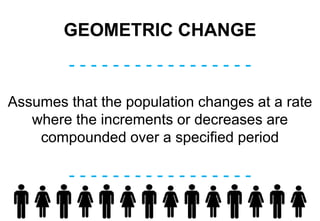
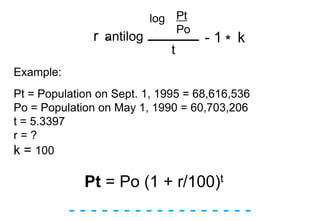
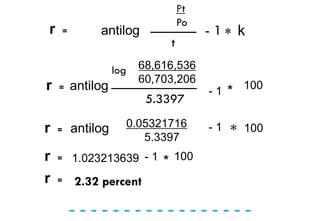
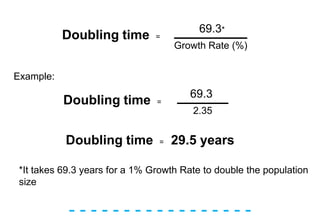
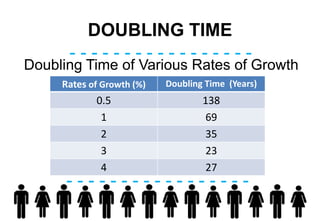
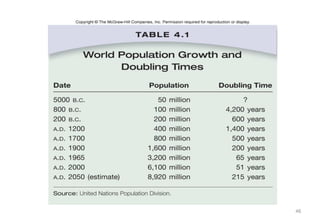
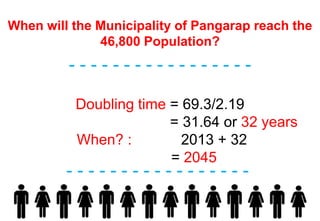
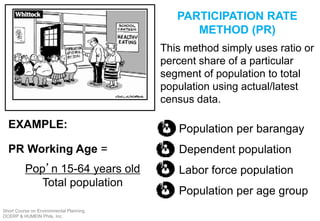
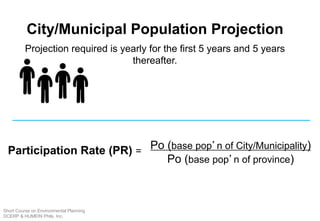
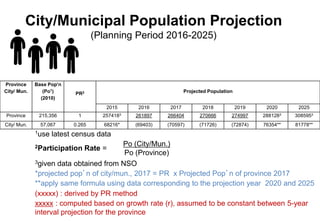
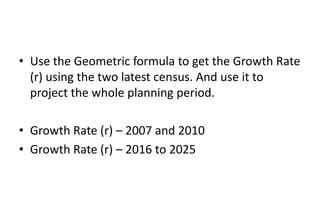
The document provides an overview of demographic analysis and population projections. It defines key demographic terms like population, fertility, mortality, migration, and population change. It discusses methods of computing population growth rates like arithmetic, geometric, and exponential change. It also covers concepts like doubling time, crude birth rate, crude death rate, and rate of natural increase. The document concludes by outlining the geometric and participation rate methods that can be used for population projections at the city/municipal level over a planning period.