SlideShare a Scribd company logo
1 of 15
Download to read offline
1QFY2011 Result Update | Banking
                                                                                                                         August 12, 2010


 State Bank of India                                                                         ACCUMULATE
                                                                                             CMP                               Rs2,784
 Performance Highlights                                                                      Target Price                      Rs3,185


                                                                                             Investment Period              12 Months


 Particulars (Rs cr)        1QFY11 4QFY10          % chg (qoq) 1QFY10        % chg (yoy)
 NII                           7,304     6,721               8.7    5,025          45.4
                                                                                             Stock Info
 Pre-Prov Profit               6,134     5,194              18.1    3,674          67.0
                                                                                             Sector                                 Banking
 PAT                           2,914     1,867              56.1    2,330          25.1
                                                                                             Market Cap (Rs cr)                 1,76,751
 Source: Company, Angel Research
                                                                                             Beta                                       1.2
 For 1QFY2011, State Bank of India’s (SBI) standalone net profit grew 25.1% yoy
                                                                                             52 Week High / Low            2,798/1,670
 and 56.1% qoq, which exceeded our estimates on account of better-than-
                                                                                             Avg. Daily Volume                  4,84,717
 estimated NII and lower operating expenses. Robust operating performance with
 reasonable asset quality was the key highlight of the result. We maintain an                Face Value (Rs)                            10
 Accumulate rating on the stock.                                                             BSE Sensex                             18,074
                                                                                             Nifty                                   5,416
 Robust operating performance: The bank’s net advances increased 20.4% yoy
 and 3.4% qoq to Rs6,53,220cr, while total deposits grew 6.8% yoy and 1.4% qoq               Reuters Code                           SBI.BO
 to Rs8,15,297cr during 1QFY2011. Reported net interest margin (NIM) improved                Bloomberg Code                     SBIN@IN
 by 22bp qoq and 88bp yoy to 3.18% during the quarter despite a hit of 12bp due
 to change in the method of calculation of SA interest. The margin expansion was
 underpinned by improvement in the CASA ratio to 47.5% as of 1QFY2011 from                   Shareholding Pattern (%)
 38.5% as of 1QFY2010 and from 46.7% as of 4QFY2010 coupled with shedding                    Promoters                                59.4
 of high-cost bulk deposits. Gross NPAs were up by 6.6% qoq and net NPAs                     MF / Banks / Indian Fls                  19.9
 increased 1.9% qoq to Rs20,825cr and Rs11,074cr, respectively. NPA provision                FII / NRIs / OCBs                        14.8
 coverage ratio including technical write-offs improved to 60.7% compared to
                                                                                             Indian Public / Others                     5.9
 59.2% as of 4QFY2010.

 Outlook and Valuation: Due to strong CASA and fee income, SBI’s core RoEs
 have improved over the past few years and unlike virtually all other PSBs, actual           Abs. (%)              3m         1yr       3yr
 FY2010 RoEs are below core levels due to low asset yields, providing scope for              Sensex                5.1     20.3       21.6
 upside as the CD ratio improves and yields normalise to sectoral averages. SBI is
                                                                                             SBI                  19.8     63.5       83.6
 trading at 2.1x FY2012E ABV while excluding value of insurance and capital
 market subsidiaries, it is trading at 1.7x FY2012E ABV v/s its 5-year range of
 1.3-2.0x and median of 1.7x. We believe this provides reasonable upside,
 especially in light of its dominant position and reach, strong growth and superior
 earnings quality. We maintain an Accumulate on the stock, with a Target Price of
 Rs3,185.

 Key Financials
 Y/E March (Rs cr)                 FY2009        FY2010            FY2011E      FY2012E
 NII                               20,873        23,671             30,834        37,558    Vaibhav Agrawal
 % chg                               22.6           13.4              30.3           21.8   022 – 4040 3800 Ext: 333
 Net Profit                         9,332          9,398            10,771        15,042    vaibhav.agrawal@angeltrade.com

 % chg                               38.7             0.7             14.6           39.6
                                                                                            Amit Rane
 NIM (%)                               2.6            2.5              2.8            2.9
                                                                                            022 – 4040 3800 Ext: 326
 EPS (Rs)                           147.0          148.0             169.7         236.9    amitn.rane@angeltrade.com
 P/E (x)                             18.9           18.8              16.4          11.8
 P/ABV (x)                             3.4            2.9              2.4            2.1   Shrinivas Bhutda
 RoA (%)                               1.1            0.9              0.9            1.1   022 – 4040 3800 Ext: 316
 RoE (%)                             18.7           16.2              16.4          20.1    shrinivas.bhutda@angeltrade.com
 Source: Company, Angel Research


Please refer to important disclosures at the end of this report                                                                          1
State Bank of India | 1QFY2011 Result Update


                  Exhibit 1: 1QFY2011 performance
                  Particulars (Rs cr)         1QFY11       4QFY10   % chg (qoq) 1QFY10 % chg (yoy)
                  Interest earned              18,452      17,966          2.7     17,473          5.6
                  Interest expenses            11,148      11,244         (0.9)    12,448       (10.4)
                  Net interest income           7,304       6,721          8.7      5,025        45.4
                  Non-interest income           3,690       4,509        (18.2)     3,569          3.4
                  Total income                 10,994      11,230         (2.1)     8,594        27.9
                  Operating expenses            4,859       6,036        (19.5)     4,920        (1.2)
                  Pre-prov. profit              6,134       5,194         18.1      3,674        67.0
                  Provisions & cont.            1,551       2,349        (34.0)       173       798.1
                  PBT                           4,583       2,844         61.1      3,501        30.9
                  Prov. for taxes               1,669         978         70.7      1,171        42.5
                  PAT                           2,914       1,867         56.1      2,330        25.1
                  EPS (Rs)                          45.9     29.4         56.1       36.7        25.1
                  Cost-to-income ratio (%)          44.2     53.7                    57.2
                  Effective tax rate (%)            36.4     34.4                    33.4
                  Net NPA (%)                        1.7      1.7                         1.6
                  Source: Company, Angel Research


                  Exhibit 2: 1QFY2011 Actual vs. Estimates
                  Particulars (Rs cr)                           Actual      Estimates           Var (%)
                  Net interest income                            7,304            6,404           14.0
                  Non-interest income                            3,690            3,848           (4.1)
                  Total income                                 10,994         10,252               7.2
                  Operating expenses                             4,859            5,374           (9.6)
                  Pre-prov. profit                               6,134            4,878           25.8
                  Provisions & cont.                             1,551            1,372           13.1
                  PBT                                            4,583            3,506           30.7
                  Prov. for taxes                                1,669            1,192           40.0
                  PAT                                            2,914            2,314           26.0
                  Source: Company, Angel Research


August 12, 2010                                                                                       2
State Bank of India | 1QFY2011 Result Update


                  Advances grow in line with industry, deposits growth lags

                  During the quarter, net advances of the bank increased 20.4% yoy and 3.4% qoq
                  to Rs6,53,220cr, underpinned by strong growth in large corporate advances of
                  34.7% yoy and growth in home loans of 29.8% yoy. Loan book of the bank
                  continues to be well diversified with no segment accounting for more than 21% of
                  the total loan book. The growth in advances was driven by the telecom related
                  lending (Rs7,000cr) and upturn in textiles, iron and steel, auto, infrastructure and
                  gems & jewellery industry. Going forward, the credit demand from the large and
                  mid corporate segments is expected to be strong, with sanctions in pipeline of
                  Rs14,798cr and Rs7,791cr, respectively.

                  Exhibit 3: Segment-wise advances yoy growth rates
                  Segment                                                                            %
                  Large Corporate                                                                 34.7
                  Mid-Corporate                                                                   14.3
                  SME                                                                             14.7
                  Agricultural                                                                    16.0
                  International                                                                   22.1
                  Home                                                                            29.8
                  Auto                                                                            48.1
                  Education                                                                       30.8
                  Overall Advances                                                                20.4
                  Source: Company, Angel Research


                  Deposits of the bank went up from Rs7,63,563cr in 1QFY2010 to Rs8,15,297cr in
                  1QFY2011 recording a yoy growth of 6.8%, driven by CASA growth of 28.9% and
                  retail term deposits growth of 10.2%, despite shedding of high-cost bulk deposits
                  by 51.4%. Current deposits increased 12.5% yoy, while savings deposits rose
                  33.9% yoy. Savings bank deposits grew at an average of Rs9,232cr per month
                  during the quarter to Rs71,806cr as of 1QFY2011 leading to an improvement in
                  CASA ratio from 38.5% as of 1QFY2010 to 47.5% as of 1QFY2011 (46.7% in
                  4QFY2010). As a result, NII increased by 45.4% yoy and 8.7% qoq to Rs7,304cr
                  in 1QFY2011.

                  Exhibit 4: Business growth trend
                           Advances YoY Growth        Deposits YoY Growth    Credit-Deposit Ratio (RHS)
                     (%)                                                                          (%)

                    40.0                                                                           84

                                                                                                   80
                    30.0

                                                                                                   76
                    20.0
                                                                                                   72

                    10.0
                                                                                                   68

                      -                                                                            64
                                 1QFY10      2QFY10        3QFY10       4QFY10      1QFY11

                  Source: Company, Angel Research


August 12, 2010                                                                                         3
State Bank of India | 1QFY2011 Result Update


                  Exhibit 5: Well-diversified loan book - 1QFY2011

                                                                   Others                   International
                                                                    3%                           16%
                                                     Retail
                                                      21%


                                                                                                     Mid-Corporate
                                        Agricultural                                                     20%
                                            9%


                                                                                              Large
                                                                                             Corporate
                                                                 SME
                                                                                               14%
                                                                 17%

                  Source: Company, Angel Research


                  NIM continues its ride on growth path

                  The bank’s reported NIM has been in an upward trend since hitting a low of
                  2.30% in 1QFY2010 from which it has improved by 88bp to 3.18% in 1QFY2011.
                  Even on a sequential basis, NIM has expanded by 22bp despite the 12bp hit due
                  to the switch in calculation method of savings deposits interest. The improvement
                  in NIMs was driven by increase in the CD ratio to 80.1% (from 78.6% in
                  4QFY2010), shedding of bulk deposits and increase in CASA ratio.

                  Exhibit 6: Trend in spreads and NIMs

                       (%)               Yield on Advances                      Cost of Deposits              Reported NIM

                    12.00    10.01        10.24       10.42        10.15        10.01      9.95     9.79        9.66      9.30
                     9.00
                              6.16        5.94         5.95            6.30     6.16       6.06     5.92        5.80      5.27
                     6.00
                              3.03         3.16        3.10                                         2.82        2.96      3.18
                                                                       2.39      2.30      2.55
                     3.00

                     0.00
                               1QFY09


                                            2QFY09


                                                        3QFY09


                                                                       4QFY09


                                                                                  1QFY10


                                                                                           2QFY10


                                                                                                     3QFY10


                                                                                                                 4QFY10


                                                                                                                          1QFY11


                  Source: Company, Angel Research

                  Reasonable asset quality

                  SBI’s asset quality suffered slightly during the quarter as gross NPAs rose 6.6% qoq
                  to Rs20,825cr, while net NPAs increased 1.9% qoq to Rs11,074cr partly due to the
                  net increase in gross NPAs from agricultural advances of Rs683cr, which included
                  Rs354cr towards the Agri Debt Waiver scheme. The gross and net NPA ratio
                  remained steady sequentially at 3.1% and 1.7%, respectively.

                  The gross slippages during the quarter were Rs4,081cr, which came primarily from
                  the agri, retail and SME portfolios. The annualised slippage ratio stood at 2.6%
                  compared to 2.2% in FY2010. The bank’s corporate and SME portfolio accounted
                  for more than 56.0% of the total gross NPAs of Rs20,825cr. The provision


August 12, 2010                                                                                                                    4
State Bank of India | 1QFY2011 Result Update


                  coverage ratio including technical write-offs improved from 59.2% as of
                  4QFY2010 to 60.7% as of 1QFY2011.

                  Out of the cumulative standard restructured assets under the RBI Special
                  Dispensation Scheme which stood at Rs16,796cr as of 4QFY2010, Rs158cr turned
                  into NPAs during the quarter taking the cumulative slippages from restructured
                  book to Rs1,774cr (10.6% of the restructured loan book). The bank’s restructured
                  loans outside the RBI scheme stood at Rs12,900cr, indicating cumulative
                  restructuring/net worth of 43.1% compared to sector average of 68.3%.

                  Exhibit 7: Trend in asset quality
                                  Gross NPAs                  Net NPAs                       Provision coverage (RHS)
                      (Rs cr)                                                                                                  (%)
                    25,000                                                                                                      70.0

                    20,000
                                                                                                                               60.0
                    15,000
                                                                                                                               50.0
                    10,000
                                                                                                                               40.0
                      5,000

                            -                                                                                                  30.0
                                 1QFY09


                                          2QFY09


                                                   3QFY09


                                                             4QFY09


                                                                      1QFY10


                                                                                    2QFY10


                                                                                              3QFY10


                                                                                                           4QFY10


                                                                                                                      1QFY11
                  Source: Company, Angel Research, Note: NPA coverage excluding technical write-offs till
                  3QFY2009

                  Provisioning expenses rose substantially on a yoy basis to Rs1,551cr in 1QFY2011,
                  on the back of higher NPA provisions (Rs1,733cr) and lower write-back of
                  investment provisions (Rs298cr).

                  Exhibit 8: Breakup of provisioning expenses
                  (Rs cr)                               1QFY11 4QFY10 % chg (qoq) 1QFY10 % chg (yoy)
                  NPA                                       1,733     2,187                   (20.7)           1,344            29.0
                  Standard Assets                            106               72              46.2                  14        656.6
                  Investments                               (298)              36                      -    (1,201)            (75.2)
                  Others                                       10              55             (81.0)                 15        (31.4)
                  Total                                     1,551     2,349                   (34.0)                173        798.1
                  Source: Company, Angel Research

                  Operating expenses under control

                  Operating expenses declined 19.5% qoq and 1.2% yoy to Rs4,859cr driven by a
                  14.4% qoq and 9.9% yoy fall in staff expenses. Decrease in operating expenses
                  coupled with robust operating performance improved the cost-to-income ratio to
                  44.2% compared to 53.7% in 4QFY2010 and 57.2% in 1QFY2010. There was a
                  write-back of Rs845cr from excess provision on wage revision during the quarter.
                  The bank made a provision of Rs1,100cr for gratuity during 1QFY2011 against
                  the estimated liability of Rs2,200cr for FY2011E for the increase in gratuity ceiling.


August 12, 2010                                                                                                                        5
State Bank of India | 1QFY2011 Result Update


                  Exhibit 9: Breakup of operating expenses
                  (Rs cr)                                     1QFY11 4QFY10 % chg (qoq) 1QFY10 % chg (yoy)
                  Staff expenses                                  3,074               3,592                  (14.4)        3,411                   (9.9)
                  Overhead expenses                               1,785               2,444                  (27.0)        1,508                   18.4
                  Total                                           4,859               6,036                  (19.5)        4,920                   (1.2)
                  Source: Company, Angel Research


                  Exhibit 10: Trend in productivity
                                Employee Expenses                   Other Expenses                           Cost-to-income ratio (RHS)
                      (Rs cr)                                                                                                                      (%)
                      7,500                                                           57                                                           60
                      6,000                                                                                             54
                                                                                                              52                                   55
                      4,500                              50
                                                                                                   47                                              50
                      3,000                 46
                                   45                               45                                                             44
                      1,500                                                                                                                        45

                            -                                                                                                                      40
                                   1QFY09


                                            2QFY09


                                                         3QFY09


                                                                    4QFY09


                                                                                      1QFY10


                                                                                                  2QFY10


                                                                                                              3QFY10


                                                                                                                        4QFY10


                                                                                                                                 1QFY11
                  Source: Company, Angel Research


                  Comfortable capital adequacy

                  The bank has continued to maintain comfortable capital adequacy ratio of above
                  13.5%. As of 1QFY2011, the overall capital adequacy stood at 13.54% with tier I
                  forming more than 72.3% of the total CAR.

                  The bank is likely to come out with a rights issue by the end of FY2011 to sustain
                  the CAR at comfortable levels. The government has already approved diluting its
                  stake to 51% from the existing stipulated dilution level of 55%. This provides
                  significant headroom for dilution with the existing government holding at 59.4%.

                  Exhibit 11: Comfortable capital adequacy
                     (%)                                           Tier I                      Tier II
                    16.0

                    12.0           4.9               4.4                     4.3                    4.1                3.9                3.8

                      8.0

                                   9.4               9.7                     9.8                    9.7                9.5                9.8
                      4.0

                       -
                                   4QFY09


                                                     1QFY10


                                                                             2QFY10


                                                                                                    3QFY10


                                                                                                                       4QFY10


                                                                                                                                          1QFY11


                  Source: Company, Angel Research


August 12, 2010                                                                                                                                          6
State Bank of India | 1QFY2011 Result Update


                  Muted non-interest income, supported strongly by fee income
                  Total non-interest income growth was muted at 3.4% yoy on account of 75.5% yoy
                  decline in profit on sale of investments. Non-interest income excluding profit on
                  sale of investments was up by 23.0% yoy. Fee income went up 29.4% yoy, driven
                  by robust growth in loan processing charges, non-fund based business,
                  government business and cross-selling. Forex income increased 6.8% yoy to
                  Rs503cr. Growth in other non-interest income was driven by the 42.0% growth in
                  recoveries from written-off accounts.

                  Exhibit 12: Breakup of non-interest income
                  (Rs cr)                           1QFY11 4QFY10 % chg (qoq) 1QFY10 % chg (yoy)
                  CEB                                2,410   3,486      (30.9)   1,862         29.4
                  Treasury                             173     426      (59.3)     709       (75.5)
                  Forex                                503     185      172.1      470          6.8
                  Dividend                             377      47      700.7      358          5.3
                  Others                               227     365      (37.8)     169         34.2
                  Total                              3,690   4,509      (18.2)   3,569          3.4
                  Source: Company, Angel Research


                  Performance of Associates and Subsidiaries

                      Advances and deposits of associate banks recorded yoy growth of 18.4% and
                      16.0%, respectively. Gross and net NPAs of the associate banks stood at 2.1%
                      and 1.0%, respectively.
                      Operating profit of associate banks increased 47.4% yoy to Rs1,881cr
                      (Rs1,276cr). However, net profit of the associate banks declined marginally by
                      0.5% yoy mainly on account of higher provisioning for NPAs taking the
                      provision coverage ratio to a healthy 66%.
                      SBI Life earned PAT of Rs114cr (Rs39cr), registering yoy growth of 192.3%.
                      AuM of the company increased by 64.0% yoy to reach Rs30,082cr. The
                      company was ranked second amongst the private insurance companies under
                      New Business Premium, as on June, 2010.
                      SBI Capital Markets posted PAT of Rs157cr for 1QFY2011, registering a yoy
                      growth of 93% after excluding provision of Rs64cr towards syndication fee
                      sharing payable to SBI.
                      SBI Funds Management posted PAT of Rs15cr in 1QFY2011 as against Rs14cr
                      for 1QFY2010.
                      SBI Cards and Payment Services turned-around in 1QFY2011 with net profit of
                      Rs3cr compared to loss of Rs24cr in 1QFY2010.
                      The overall SBI Group recorded net profit growth of 22.0% yoy to Rs3,365cr
                      (Rs2,759cr) for 1QFY2011.


August 12, 2010                                                                                   7
State Bank of India | 1QFY2011 Result Update


                  Exhibit 13: Yoy growth rates for associate banks
                  (%)                                Deposits Advances Operating Profit   Net Profit
                  State Bank of Bikaner & Jaipur        23.8      21.7            34.9       (30.0)
                  State Bank of Hyderabad               24.6      27.4            53.9        82.6
                  State Bank of Indore                   2.3       9.6            30.5       (76.6)
                  State Bank of Mysore                  17.7      16.9            55.2        35.5
                  State Bank of Patiala                  5.2      12.4            98.6        10.3
                  State Bank of Travancore              19.6      18.4            12.8       (16.6)
                  Total                                 16.0      18.4            47.4        (0.5)
                  Source: Company, Angel Research


August 12, 2010                                                                                    8
State Bank of India | 1QFY2011 Result Update


                  Investment Arguments

                  Improving savings market share

                  Up to FY2007, the bank witnessed a significant decline in CASA market share with
                  private sector banks pursuing aggressive branch expansion. However, the bank’s
                  market share of savings deposits expanded by a substantial 270bp to 23.2%
                  during FY2007-10 (one of the few PSBs to do so) driven by relatively faster branch
                  expansion (9.5% CAGR v/s 2-5% for most PSBs) leveraging its tremendous trust
                  factor in the country.

                  Strongest fee income among PSU banks

                  SBI has a relatively strong share of fee income owing to its strong corporate and
                  government business relationships. During FY2010, the bank continued its
                  dominance with non-interest income/assets at 1.3% (highest among PSU banks).

                  Asset quality concerns receding

                  SBI has a gross NPA ratio of 3.1% and net NPA ratio of 1.7%, leading to a low
                  provision coverage ratio of 60.7% (including technical write-offs) and restructured
                  loans of around Rs30,000cr, constituting 43% of its net worth, which is lower than
                  the peer average. We have factored in a slippage ratio of 2.2% for FY2011E
                  (equal to slippage ratio in FY2010) on a conservative basis. This provides sufficient
                  margin of safety to our provisions estimates.

                  Outlook and Valuation

                  Due to strong CASA and fee income, SBI’s core RoEs have improved over the past
                  few years and unlike virtually all other PSBs, FY2010 RoEs are below core levels
                  due to low asset yields, providing scope for upside as the CD ratio improves and
                  yields normalise to sectoral averages.

                  At CMP, SBI is trading at 2.1x FY2012E ABV while excluding value of insurance
                  and capital market subsidiaries, it is trading at 1.7x FY2012E ABV v/s its 5-year
                  range of 1.3-2.0x and median of 1.7x. We believe this provides reasonable
                  upside, especially in light of its dominant position and reach, strong growth and
                  superior earnings quality. We maintain an Accumulate on the stock, with a Target
                  Price of Rs3,185.


August 12, 2010                                                                                      9
State Bank of India | 1QFY2011 Result Update


                  Exhibit 14: SOTP valuation summary
                  Company (Rs)                                                                    Value per share
                  SBI & Associates                                                                          2,956
                  Life                                                                                       190
                  AMC                                                                                         12
                  Others (Cap Mkt, Cards, Factors)                                                            28
                  SOTP value                                                                                3,185
                  Source: Angel Research


                  Exhibit 15: Key Assumptions
                                                               Earlier Estimates             Revised Estimates
                  Particulars (%)
                                                             FY2011E      FY2012E          FY2011E      FY2012E
                  Credit growth                                   21.0        20.0               21.0        20.0
                  Deposit growth                                  21.0        20.0               17.0        20.0
                  CASA ratio                                      46.9        46.5               48.5        48.5
                  NIMs                                              2.7            2.7            2.8         2.9
                  Other income growth                               5.4       17.3                5.1        17.2
                  Growth in staff expenses                        15.0        19.0                7.0        20.0
                  Growth in other expenses                        15.0        19.0                7.0        20.0
                  Slippages                                         2.0            1.7            2.2         1.9
                  Coverage ratio                                  70.5        72.7               72.2        73.6
                  Treasury gain/(loss) (% of investments)           0.3            0.3            0.2         0.2
                  Source: Company, Angel Research


                  Exhibit 16: Change in estimates
                                                          FY2011E                          FY2012E
                  Particulars (Rs cr)           Earlier       Revised              Earlier   Revised
                                                                          % chg                              % chg
                                             estimates      estimates           estimates estimates
                  NII                          29,289         30,834        5.3 35,599       37,558              5.5
                  Non-interest income         16,033         15,980        (0.3)     18,784       18,731      (0.3)
                  Total income                45,322         46,815         3.3      54,383       56,290         3.5
                  Operating expenses          23,366         21,741        (7.0)     27,806       26,089      (6.2)
                  Pre-prov. profit            21,956         25,074        14.2      26,577       30,201      13.6
                  Provisions & cont.            6,860          8,885       29.5          5,569      7,554     35.6
                  PBT                         15,096         16,189         7.2      21,008       22,646         7.8
                  Prov. for taxes               5,046          5,417        7.4          7,047      7,604        7.9
                  PAT                         10,050         10,771         7.2      13,961       15,042         7.7
                  Source: Company, Angel Research


August 12, 2010                                                                                                10
State Bank of India | 1QFY2011 Result Update


                  Exhibit 17: P/ABV band
                                         Price                        1.0x                               1.5x                        2.0x                           2.5x                                 3.0x
                    (Rs)
                   4500
                   4000
                   3500
                   3000
                   2500
                   2000
                   1500
                   1000
                    500
                          0


                                                             Dec-03


                                                                                                                          Dec-06


                                                                                                                                                                        Apr-09
                                                                         Jul-04


                                                                                                                                     Jul-07
                               Mar-02

                                          Oct-02


                                                                                       Mar-05

                                                                                                    Oct-05


                                                                                                                                                 Feb-08

                                                                                                                                                           Sep-08


                                                                                                                                                                                      Nov-09
                                                   May-03


                                                                                                               May-06


                                                                                                                                                                                                   Jun-10

                                                                                                                                                                                                                   Jan-11
                  Source: Company, Angel Research


                  Exhibit 18: State Bank of India - P/E Band
                                                                         Price                      5x                  10x                   15x               20x
                   3,600

                   3,000

                   2,400

                   1,800

                   1,200

                     600

                          0
                              Apr-01

                                          Dec-01


                                                                Apr-03

                                                                              Dec-03


                                                                                                             Apr-05

                                                                                                                         Dec-05


                                                                                                                                                  Apr-07

                                                                                                                                                               Dec-07


                                                                                                                                                                                               Apr-09

                                                                                                                                                                                                                 Dec-09
                                                    Aug-02


                                                                                                Aug-04


                                                                                                                                     Aug-06


                                                                                                                                                                             Aug-08


                                                                                                                                                                                                                                   Aug-10
                  Source: Company, Angel Research


                  Exhibit 19: Discount to Sensex - State Bank of India
                                                                 Discount to Sensex                                                 Avg. Historical Discount
                     0

                   (10)

                   (20)

                   (30)

                   (40)

                   (50)

                   (60)

                   (70)
                                                                             Aug-07


                                                                                                                           Aug-08


                                                                                                                                                                    Aug-09


                                                                                                                                                                                                                          Aug-10
                                        Jul-06

                                                   Dec-06


                                                                                                Dec-07


                                                                                                                                        Dec-08


                                                                                                                                                                                  Dec-09
                                                               Apr-07


                                                                                                              Apr-08


                                                                                                                                                      Apr-09


                                                                                                                                                                                                        Apr-10
                          Mar-06


                  Source: Company, Angel Research


August 12, 2010                                                                                                                                                                                                                11
State Bank of India | 1QFY2011 Result Update


                                                     Exhibit 20: Angel EPS forecast v/s consensus
                                                      Year                       Angel Forecast             Bloomberg Consensus       Var.(%)
                                                      FY2011E                              169.7                           172.0         (1.4)
                                                      FY2012E                              236.9                           216.3          9.5
                                                      Source: Company, Angel Research, Bloomberg


Exhibit 21: Recommendation summary
                              CMP       Tgt. Price   Upside      FY2012E       FY2012E     FY2012E            FY10-12E     FY2012E    FY2012E
Company      Reco
                               (Rs)           (Rs)      (%)      P/ABV (x) Tgt P/ABV (x)     P/E (x)     CAGR in EPS (%)    RoA (%)    RoE (%)
AxisBk      Buy              1,317         1,688      28.2            2.5           3.2       13.1                 27.4        1.6       20.5
FedBk       Buy                324           409       26.3           0.9           1.2            7.0             30.7         1.4      14.4
HDFCBk      Buy              2,075         2,514       21.2           3.3           4.0        17.3                36.5         1.7      20.6
ICICIBk     Buy                964         1,211       25.6           1.9           2.5        15.6                31.0         1.4      15.5
SIB         Neutral            200               -           -        1.2              -           7.0             17.1         1.0      17.8
YesBk       Neutral            306               -           -        2.5              -       15.4                18.7         1.3      17.1
BOI         Neutral            462               -           -        1.4              -           7.3             38.0         0.9      20.5
CorpBk       Neutral           594               -           -        1.1              -           5.7             13.4         1.0      20.5
DenaBk       Accumulate        101           109        7.8           0.9           1.0            4.8              7.3         0.8      19.2
IndBk        Accumulate        230           256       11.1           1.1           1.2            5.7              7.6         1.3      21.0
IOB         Buy                127           147       15.6           0.9           1.1            6.3             25.1         0.7      14.9
OBC         Neutral            403               -           -        1.0              -           6.0             21.6         0.9      18.3
PNB          Neutral         1,132               -           -        1.6              -           7.6              9.3         1.2      21.9
SBI          Accumulate      2,784         3,185       14.4           1.7           2.0        11.8                26.5         1.1      20.1
UcoBk        Accumulate        102           111        9.4           0.9           1.0            4.2             15.1         0.8      25.5
UnionBk      Accumulate        329           355        7.8           1.3           1.4            5.8             17.1         1.1      24.1
Source: Company, Angel Research; Note: P/ABVs of the core banks.


August 12, 2010                                                                                                                            12
State Bank of India | 1QFY2011 Result Update


                  Income statement
                  Y/E March (Rs cr)             FY06        FY07        FY08      FY09      FY10       FY11E    FY12E
                  Net Interest Income         15,636      15,058      17,021    20,873     23,671     30,834    37,558
                  - YoY Growth (%)              12.1        (3.7)       13.0      22.6       13.4       30.3      21.8
                  Other Income                 7,447       7,406       9,398    12,902     15,200     15,980    18,731
                  - YoY Growth (%)               4.6        (0.6)       26.9      37.3       17.8        5.1      17.2
                  Operating Income            23,083      22,464      26,420    33,775     38,872     46,815    56,290
                  - YoY Growth (%)               9.6        (2.7)       17.6      27.8       15.1       20.4      20.2
                  Operating Expenses          11,725      11,824      12,609    15,649     20,319     21,741    26,089
                  - YoY Growth (%)              16.4         0.8         6.6      24.1       29.8        7.0      20.0
                  Pre - Provision Profit      11,358      10,641      13,811    18,127     18,553     25,074    30,201
                  - YoY Growth (%)               3.3        (6.3)       29.8      31.2        2.4       35.1      20.4
                  Prov. & Cont.                4,452       3,016       3,373     3,736      4,396      8,885     7,554
                  - YoY Growth (%)              (0.4)      (32.3)       11.8      10.8       17.7      102.1     (15.0)
                  Profit Before Tax            6,905       7,625      10,438    14,391     14,157     16,189    22,646
                  - YoY Growth (%)               5.9        10.4        36.9      37.9       (1.6)      14.4      39.9
                  Prov. for Taxation           2,499       3,083       3,709     5,058      4,759      5,417     7,604
                  - as a % of PBT               36.2        40.4        35.5      35.2       33.6       33.5      33.6
                  PAT                          4,407       4,541       6,729     9,332      9,398     10,771    15,042
                  - YoY Growth (%)               2.4         3.1        48.2      38.7        0.7       14.6      39.6


                  Balance sheet
                  Y/E March (Rs cr)          FY06        FY07        FY08      FY09        FY10       FY11E     FY12E
                  Share Capital               526         526         631       635         635         635       635
                  Reserves & Surplus        27,118      30,772      48,401   57,313       65,314      73,618    85,238
                  Deposits                 380,046 435,521 537,404 742,073               804,116     940,816 1,128,979
                  - Growth (%)                 3.5        14.6        23.4      38.1         8.4        17.0      20.0
                  Borrowings                30,641      39,703      51,727   53,714       71,031      83,107    99,728
                  Tier 2 Capital             4,986      16,169      21,289   30,344       31,980      38,696    46,435
                  Other Liab & Prov.        50,552      43,389      62,073   80,353       80,337      95,224   116,873
                  Total Liabilities        493,870 566,082 721,526 964,432 1,053,414 1,232,096 1,477,889
                  Cash balances             21,653      29,076      51,535   55,546       61,291      65,857    79,029
                  Bank balances             22,907      22,892      15,932   48,858       34,893      40,825    48,990
                  Investments              162,534 149,149 189,501 275,954               285,790     314,708   377,204
                  Advances                 261,642 337,336 416,768 542,503               631,914     764,616   917,539
                  - Growth (%)                29.3        28.9        23.5      30.2        16.5        21.0      20.0
                  Fixed Assets               2,753       2,819       3,373     3,838       4,413       5,008     5,830
                  Other Assets              22,381      24,809      44,417   37,733       35,113      41,082    49,298
                  Total Assets             493,870 566,082 721,526 964,432 1,053,414 1,232,096 1,477,889
                  - Growth (%)                 7.3        14.7        27.3      33.8         9.2        17.0      20.0


August 12, 2010                                                                                                    13
State Bank of India | 1QFY2011 Result Update


                  Ratio analysis
                   Particulars                   FY06    FY07    FY08    FY09    FY10     FY11E     FY12E
                   Profitability ratios (%)
                   NIMs                            3.5     3.0     2.8     2.6     2.5       2.8       2.9
                   Cost to Income Ratio           50.8    52.6    47.7    46.3    52.3     46.4      46.3
                   RoA                             0.9     0.8     1.0     1.1     0.9       0.9       1.1
                   RoE                            17.7    15.7    18.1    18.7    16.2     16.4      20.1
                   B/S ratios (%)
                   CASA Ratio                     47.6    48.5    47.0    41.6    47.3     48.5      48.5
                   Credit/Deposit Ratio           68.8    77.5    77.6    73.1    78.6     81.3      81.3
                   CAR                            11.9    12.3    13.5    13.2    12.3     10.7      10.6
                   - Tier I                        9.4     8.0     9.1     8.7     8.7       7.3       7.0
                   Asset Quality (%)
                   Gross NPAs                      3.6     2.9     3.0     2.9     3.0       2.5       2.1
                   Net NPAs                        1.9     1.6     1.8     1.8     1.7       0.7       0.6
                   Slippages                       2.1     1.9     2.3     2.6     2.2       2.2       1.9
                   Loan Loss Prov./Avg. Assets     0.0     0.3     0.3     0.3     0.5       0.7       0.5
                   Provision Coverage             49.0    47.4    42.2    39.2    44.4     72.2      73.6
                   Per Share Data (Rs)
                   EPS                            83.7    86.3   106.6   147.0   148.0    169.7     236.9
                   ABVPS                         477.8   542.3   709.7   824.2   944.5   1,160.8   1,348.2
                   DPS                            14.0    14.0    21.5    29.0    30.0     31.0      44.0
                   Valuation Ratios
                   PER (x)                        33.3    32.3    26.1    18.9    18.8     16.4      11.8
                   P/ABVPS (x)                     5.8     5.1     3.9     3.4     2.9       2.4       2.1
                   Dividend Yield                  0.5     0.5     0.8     1.0     1.1       1.1       1.6
                   DuPont Analysis (%)
                   NII                             3.3     2.9     2.7     2.5     2.4       2.7       2.8
                   (-) Prov. Exp.                  0.9     0.6     0.5     0.4     0.4       0.8       0.6
                   Adj. NII                        2.4     2.3     2.1     2.0     1.9       1.9       2.2
                   Treasury                        0.1     0.1     0.3     0.3     0.2       0.1       0.0
                   Int. Sens. Inc.                 2.5     2.4     2.4     2.4     2.1       2.0       2.3
                   Other Inc.                      1.4     1.2     1.2     1.2     1.3       1.3       1.3
                   Op. Inc.                        3.9     3.6     3.6     3.6     3.4       3.3       3.6
                   Opex                            2.5     2.2     2.0     1.9     2.0       1.9       1.9
                   PBT                             1.4     1.4     1.6     1.7     1.4       1.4       1.7
                   Taxes                           0.5     0.6     0.6     0.6     0.5       0.5       0.6
                   RoA                             0.9     0.8     1.0     1.1     0.9       0.9       1.1
                   Leverage (x)                   20.0    19.5    17.5    17.2    17.7     17.7      18.3
                   RoE                            17.7    15.7    18.1    18.7    16.2     16.4      20.1


August 12, 2010                                                                                        14
State Bank of India | 1QFY2011 Result Update


  Research Team Tel: 022 - 4040 3800                E-mail: research@angeltrade.com                   Website: www.angeltrade.com

  DISCLAIMER
  This document is solely for the personal information of the recipient, and must not be singularly used as the basis of any investment
  decision. Nothing in this document should be construed as investment or financial advice. Each recipient of this document should make
  such investigations as they deem necessary to arrive at an independent evaluation of an investment in the securities of the companies
  referred to in this document (including the merits and risks involved), and should consult their own advisors to determine the merits and
  risks of such an investment.

  Angel Broking Limited, its affiliates, directors, its proprietary trading and investment businesses may, from time to time, make
  investment decisions that are inconsistent with or contradictory to the recommendations expressed herein. The views contained in this
  document are those of the analyst, and the company may or may not subscribe to all the views expressed within.

  Reports based on technical and derivative analysis center on studying charts of a stock's price movement, outstanding positions and
  trading volume, as opposed to focusing on a company's fundamentals and, as such, may not match with a report on a company's
  fundamentals.

  The information in this document has been printed on the basis of publicly available information, internal data and other reliable
  sources believed to be true, but we do not represent that it is accurate or complete and it should not be relied on as such, as this
  document is for general guidance only. Angel Broking Limited or any of its affiliates/ group companies shall not be in any way
  responsible for any loss or damage that may arise to any person from any inadvertent error in the information contained in this report.
  Angel Broking Limited has not independently verified all the information contained within this document. Accordingly, we cannot testify,
  nor make any representation or warranty, express or implied, to the accuracy, contents or data contained within this document. While
  Angel Broking Limited endeavours to update on a reasonable basis the information discussed in this material, there may be regulatory,
  compliance, or other reasons that prevent us from doing so.
  This document is being supplied to you solely for your information, and its contents, information or data may not be reproduced,
  redistributed or passed on, directly or indirectly.

  Angel Broking Limited and its affiliates may seek to provide or have engaged in providing corporate finance, investment banking or
  other advisory services in a merger or specific transaction to the companies referred to in this report, as on the date of this report or in
  the past.

  Neither Angel Broking Limited, nor its directors, employees or affiliates shall be liable for any loss or damage that may arise from or in
  connection with the use of this information.

  Note: Please refer to the important `Stock Holding Disclosure' report on the Angel website (Research Section). Also, please
  refer to the latest update on respective stocks for the disclosure status in respect of those stocks. Angel Broking Limited and
  its affiliates may have investment positions in the stocks recommended in this report.


  Disclosure of Interest Statement                                          State Bank of India
  1. Analyst ownership of the stock                                                 No
  2. Angel and its Group companies ownership of the stock                           Yes
  3. Angel and its Group companies' Directors ownership of the stock                No
  4. Broking relationship with company covered                                      No

  Note: We have not considered any Exposure below Rs 1 lakh for Angel, its Group companies and Directors.


  Ratings (Returns):              Buy (> 15%)                      Accumulate (5% to 15%)                 Neutral (-5 to 5%)
                                  Reduce (-5% to 15%)              Sell (< -15%)


August 12, 2010                                                                                                                           15

More Related Content

What's hot (18)

HDFC Bank - Result Update
HDFC Bank - Result UpdateHDFC Bank - Result Update
HDFC Bank - Result Update
 
ICICI Bank
ICICI BankICICI Bank
ICICI Bank
 
Bank of India
Bank of India Bank of India
Bank of India
 
Corporation Bank
Corporation BankCorporation Bank
Corporation Bank
 
Hdfc bank ru2 qfy2011-191010
Hdfc bank ru2 qfy2011-191010Hdfc bank ru2 qfy2011-191010
Hdfc bank ru2 qfy2011-191010
 
Indian Overseas Bank
Indian Overseas BankIndian Overseas Bank
Indian Overseas Bank
 
Corporation Bank Result Update
Corporation Bank Result UpdateCorporation Bank Result Update
Corporation Bank Result Update
 
Icici bank ru4 qfy2010-230410
Icici bank ru4 qfy2010-230410Icici bank ru4 qfy2010-230410
Icici bank ru4 qfy2010-230410
 
South Indian Bank
 South Indian Bank South Indian Bank
South Indian Bank
 
Axis%20 bank ru1qfy2012-220711
Axis%20 bank ru1qfy2012-220711Axis%20 bank ru1qfy2012-220711
Axis%20 bank ru1qfy2012-220711
 
Yes Bank - Result Update
Yes Bank - Result UpdateYes Bank - Result Update
Yes Bank - Result Update
 
Federal Bank
Federal BankFederal Bank
Federal Bank
 
Orchid
Orchid Orchid
Orchid
 
Punj Lloyd
Punj LloydPunj Lloyd
Punj Lloyd
 
Hindustan Zinc
Hindustan ZincHindustan Zinc
Hindustan Zinc
 
NMDC
NMDCNMDC
NMDC
 
JISL
JISLJISL
JISL
 
Axis Bank - Q4 2010 Result Update
Axis Bank - Q4 2010 Result UpdateAxis Bank - Q4 2010 Result Update
Axis Bank - Q4 2010 Result Update
 

Viewers also liked

Inox ru4 qfy2010-240510
Inox ru4 qfy2010-240510Inox ru4 qfy2010-240510
Inox ru4 qfy2010-240510Angel Broking
 
Educomp ru4 qfy2010-240510
Educomp ru4 qfy2010-240510Educomp ru4 qfy2010-240510
Educomp ru4 qfy2010-240510Angel Broking
 
Weekly review 29-05-10
Weekly review   29-05-10Weekly review   29-05-10
Weekly review 29-05-10Angel Broking
 
Derivatives report 03 may-2010
Derivatives report 03 may-2010Derivatives report 03 may-2010
Derivatives report 03 may-2010Angel Broking
 
Tech report 25.05.2010
Tech report 25.05.2010Tech report 25.05.2010
Tech report 25.05.2010Angel Broking
 
Tech report 29.10.2010
Tech report 29.10.2010Tech report 29.10.2010
Tech report 29.10.2010Angel Broking
 
Sterlite 2 qfy2011 271010
Sterlite 2 qfy2011 271010Sterlite 2 qfy2011 271010
Sterlite 2 qfy2011 271010Angel Broking
 
Derivatives report 28 apr-2010
Derivatives report 28 apr-2010Derivatives report 28 apr-2010
Derivatives report 28 apr-2010Angel Broking
 
Anant raj ru4 qfy2010-280510
Anant raj ru4 qfy2010-280510Anant raj ru4 qfy2010-280510
Anant raj ru4 qfy2010-280510Angel Broking
 
Ntpc 2 qfy11 result update - 271010
Ntpc   2 qfy11 result update - 271010Ntpc   2 qfy11 result update - 271010
Ntpc 2 qfy11 result update - 271010Angel Broking
 
Tech Mahindra Result Update 4qfy2010-040510
Tech Mahindra Result Update 4qfy2010-040510Tech Mahindra Result Update 4qfy2010-040510
Tech Mahindra Result Update 4qfy2010-040510Angel Broking
 
Apm gas price de regulation - event update - 20-05-10
Apm gas price de regulation - event update - 20-05-10Apm gas price de regulation - event update - 20-05-10
Apm gas price de regulation - event update - 20-05-10Angel Broking
 
Derivatives Report - August 19, 2010
Derivatives Report - August 19, 2010Derivatives Report - August 19, 2010
Derivatives Report - August 19, 2010Angel Broking
 
Hero Honda Q4 Results Update
Hero Honda Q4 Results UpdateHero Honda Q4 Results Update
Hero Honda Q4 Results UpdateAngel Broking
 
Market outlook 12 08-10
Market outlook 12 08-10Market outlook 12 08-10
Market outlook 12 08-10Angel Broking
 
Ceat ru2 qfy2011-221010
Ceat ru2 qfy2011-221010Ceat ru2 qfy2011-221010
Ceat ru2 qfy2011-221010Angel Broking
 
Tech report 03.05.2010
Tech report 03.05.2010Tech report 03.05.2010
Tech report 03.05.2010Angel Broking
 

Viewers also liked (20)

Inox ru4 qfy2010-240510
Inox ru4 qfy2010-240510Inox ru4 qfy2010-240510
Inox ru4 qfy2010-240510
 
Educomp ru4 qfy2010-240510
Educomp ru4 qfy2010-240510Educomp ru4 qfy2010-240510
Educomp ru4 qfy2010-240510
 
Weekly review 29-05-10
Weekly review   29-05-10Weekly review   29-05-10
Weekly review 29-05-10
 
Derivatives report 03 may-2010
Derivatives report 03 may-2010Derivatives report 03 may-2010
Derivatives report 03 may-2010
 
Finolex Cables
Finolex CablesFinolex Cables
Finolex Cables
 
Tech report 25.05.2010
Tech report 25.05.2010Tech report 25.05.2010
Tech report 25.05.2010
 
Tech report 29.10.2010
Tech report 29.10.2010Tech report 29.10.2010
Tech report 29.10.2010
 
Ceat
Ceat Ceat
Ceat
 
Sterlite 2 qfy2011 271010
Sterlite 2 qfy2011 271010Sterlite 2 qfy2011 271010
Sterlite 2 qfy2011 271010
 
Derivatives report 28 apr-2010
Derivatives report 28 apr-2010Derivatives report 28 apr-2010
Derivatives report 28 apr-2010
 
Anant raj ru4 qfy2010-280510
Anant raj ru4 qfy2010-280510Anant raj ru4 qfy2010-280510
Anant raj ru4 qfy2010-280510
 
Ntpc 2 qfy11 result update - 271010
Ntpc   2 qfy11 result update - 271010Ntpc   2 qfy11 result update - 271010
Ntpc 2 qfy11 result update - 271010
 
Tech Mahindra Result Update 4qfy2010-040510
Tech Mahindra Result Update 4qfy2010-040510Tech Mahindra Result Update 4qfy2010-040510
Tech Mahindra Result Update 4qfy2010-040510
 
Hero Honda
Hero Honda Hero Honda
Hero Honda
 
Apm gas price de regulation - event update - 20-05-10
Apm gas price de regulation - event update - 20-05-10Apm gas price de regulation - event update - 20-05-10
Apm gas price de regulation - event update - 20-05-10
 
Derivatives Report - August 19, 2010
Derivatives Report - August 19, 2010Derivatives Report - August 19, 2010
Derivatives Report - August 19, 2010
 
Hero Honda Q4 Results Update
Hero Honda Q4 Results UpdateHero Honda Q4 Results Update
Hero Honda Q4 Results Update
 
Market outlook 12 08-10
Market outlook 12 08-10Market outlook 12 08-10
Market outlook 12 08-10
 
Ceat ru2 qfy2011-221010
Ceat ru2 qfy2011-221010Ceat ru2 qfy2011-221010
Ceat ru2 qfy2011-221010
 
Tech report 03.05.2010
Tech report 03.05.2010Tech report 03.05.2010
Tech report 03.05.2010
 

Similar to SBI Beats 1QFY2011 Estimates on Strong NII, Lower Costs

Similar to SBI Beats 1QFY2011 Estimates on Strong NII, Lower Costs (19)

Bank of India
Bank of IndiaBank of India
Bank of India
 
ICICI Bank
ICICI BankICICI Bank
ICICI Bank
 
Union Bank of India
Union Bank of India Union Bank of India
Union Bank of India
 
ICICI Bank Result Update
ICICI Bank Result UpdateICICI Bank Result Update
ICICI Bank Result Update
 
Hindalco
Hindalco Hindalco
Hindalco
 
Bajaj Auto
Bajaj AutoBajaj Auto
Bajaj Auto
 
Tech Mahindra
Tech Mahindra Tech Mahindra
Tech Mahindra
 
RIL - result Update
RIL - result UpdateRIL - result Update
RIL - result Update
 
Union bank result update 4 qfy2010 100510
Union bank result update 4 qfy2010 100510Union bank result update 4 qfy2010 100510
Union bank result update 4 qfy2010 100510
 
Union bank result update 4 qfy2010 100510
Union bank result update 4 qfy2010 100510Union bank result update 4 qfy2010 100510
Union bank result update 4 qfy2010 100510
 
Subros
Subros Subros
Subros
 
Bharat Forge
Bharat ForgeBharat Forge
Bharat Forge
 
Hindalco Novelis
Hindalco Novelis Hindalco Novelis
Hindalco Novelis
 
Ashok leyland ru4 qfy2010-300410
Ashok leyland ru4 qfy2010-300410Ashok leyland ru4 qfy2010-300410
Ashok leyland ru4 qfy2010-300410
 
Ptc India
Ptc India   Ptc India
Ptc India
 
Tata Motors
Tata Motors Tata Motors
Tata Motors
 
IRB
IRBIRB
IRB
 
Yes bank ru4 qfy2010-290410
Yes bank ru4 qfy2010-290410Yes bank ru4 qfy2010-290410
Yes bank ru4 qfy2010-290410
 
Bajaj electricals ru4-qfy2010-280510
Bajaj electricals ru4-qfy2010-280510Bajaj electricals ru4-qfy2010-280510
Bajaj electricals ru4-qfy2010-280510
 

More from Angel Broking

Market outlook 110612
Market outlook 110612Market outlook 110612
Market outlook 110612Angel Broking
 
Electrosteel castings
Electrosteel castingsElectrosteel castings
Electrosteel castingsAngel Broking
 
Derivative report 19th July 2011
Derivative report 19th July 2011Derivative report 19th July 2011
Derivative report 19th July 2011Angel Broking
 
Market outlook 19th July 2011
Market outlook 19th July 2011Market outlook 19th July 2011
Market outlook 19th July 2011Angel Broking
 
Weekly Report 18th July 2011
Weekly Report 18th July 2011Weekly Report 18th July 2011
Weekly Report 18th July 2011Angel Broking
 
Derivative Report 18th July 2011
Derivative Report 18th July 2011Derivative Report 18th July 2011
Derivative Report 18th July 2011Angel Broking
 
Technical Report 18th July 2011
Technical Report 18th July 2011Technical Report 18th July 2011
Technical Report 18th July 2011Angel Broking
 
Market Outlook 18th July 2011
Market Outlook 18th July 2011Market Outlook 18th July 2011
Market Outlook 18th July 2011Angel Broking
 
Bajaj auto Result Updated
Bajaj auto Result UpdatedBajaj auto Result Updated
Bajaj auto Result UpdatedAngel Broking
 
Tata consultancy services
Tata consultancy services Tata consultancy services
Tata consultancy services Angel Broking
 
Derivatives Report 15th July 2011
Derivatives Report 15th July 2011Derivatives Report 15th July 2011
Derivatives Report 15th July 2011Angel Broking
 
Technical Report 15th July 2011
Technical Report 15th July 2011Technical Report 15th July 2011
Technical Report 15th July 2011Angel Broking
 
Infosys Result Updated
Infosys Result UpdatedInfosys Result Updated
Infosys Result UpdatedAngel Broking
 
Derivative Report 13th July 2011
Derivative Report 13th July 2011Derivative Report 13th July 2011
Derivative Report 13th July 2011Angel Broking
 
Technical Report 13th July 2011
Technical Report 13th July 2011Technical Report 13th July 2011
Technical Report 13th July 2011Angel Broking
 
Market Outlook 13th July 2011
Market Outlook 13th July 2011Market Outlook 13th July 2011
Market Outlook 13th July 2011Angel Broking
 

More from Angel Broking (20)

Market outlook 110612
Market outlook 110612Market outlook 110612
Market outlook 110612
 
Electrosteel castings
Electrosteel castingsElectrosteel castings
Electrosteel castings
 
Persistent systems
Persistent systemsPersistent systems
Persistent systems
 
Ht media
Ht mediaHt media
Ht media
 
Derivative report 19th July 2011
Derivative report 19th July 2011Derivative report 19th July 2011
Derivative report 19th July 2011
 
Market outlook 19th July 2011
Market outlook 19th July 2011Market outlook 19th July 2011
Market outlook 19th July 2011
 
Telecom sector
Telecom sectorTelecom sector
Telecom sector
 
Weekly Report 18th July 2011
Weekly Report 18th July 2011Weekly Report 18th July 2011
Weekly Report 18th July 2011
 
Derivative Report 18th July 2011
Derivative Report 18th July 2011Derivative Report 18th July 2011
Derivative Report 18th July 2011
 
Technical Report 18th July 2011
Technical Report 18th July 2011Technical Report 18th July 2011
Technical Report 18th July 2011
 
Market Outlook 18th July 2011
Market Outlook 18th July 2011Market Outlook 18th July 2011
Market Outlook 18th July 2011
 
Bajaj auto Result Updated
Bajaj auto Result UpdatedBajaj auto Result Updated
Bajaj auto Result Updated
 
Tata consultancy services
Tata consultancy services Tata consultancy services
Tata consultancy services
 
Fc4 e63c4d01
Fc4 e63c4d01Fc4 e63c4d01
Fc4 e63c4d01
 
Derivatives Report 15th July 2011
Derivatives Report 15th July 2011Derivatives Report 15th July 2011
Derivatives Report 15th July 2011
 
Technical Report 15th July 2011
Technical Report 15th July 2011Technical Report 15th July 2011
Technical Report 15th July 2011
 
Infosys Result Updated
Infosys Result UpdatedInfosys Result Updated
Infosys Result Updated
 
Derivative Report 13th July 2011
Derivative Report 13th July 2011Derivative Report 13th July 2011
Derivative Report 13th July 2011
 
Technical Report 13th July 2011
Technical Report 13th July 2011Technical Report 13th July 2011
Technical Report 13th July 2011
 
Market Outlook 13th July 2011
Market Outlook 13th July 2011Market Outlook 13th July 2011
Market Outlook 13th July 2011
 

Recently uploaded

Financial institutions facilitate financing, economic transactions, issue fun...
Financial institutions facilitate financing, economic transactions, issue fun...Financial institutions facilitate financing, economic transactions, issue fun...
Financial institutions facilitate financing, economic transactions, issue fun...Avanish Goel
 
(办理原版一样)QUT毕业证昆士兰科技大学毕业证学位证留信学历认证成绩单补办
(办理原版一样)QUT毕业证昆士兰科技大学毕业证学位证留信学历认证成绩单补办(办理原版一样)QUT毕业证昆士兰科技大学毕业证学位证留信学历认证成绩单补办
(办理原版一样)QUT毕业证昆士兰科技大学毕业证学位证留信学历认证成绩单补办fqiuho152
 
call girls in Nand Nagri (DELHI) 🔝 >༒9953330565🔝 genuine Escort Service 🔝✔️✔️
call girls in  Nand Nagri (DELHI) 🔝 >༒9953330565🔝 genuine Escort Service 🔝✔️✔️call girls in  Nand Nagri (DELHI) 🔝 >༒9953330565🔝 genuine Escort Service 🔝✔️✔️
call girls in Nand Nagri (DELHI) 🔝 >༒9953330565🔝 genuine Escort Service 🔝✔️✔️9953056974 Low Rate Call Girls In Saket, Delhi NCR
 
House of Commons ; CDC schemes overview document
House of Commons ; CDC schemes overview documentHouse of Commons ; CDC schemes overview document
House of Commons ; CDC schemes overview documentHenry Tapper
 
Call Girls In Yusuf Sarai Women Seeking Men 9654467111
Call Girls In Yusuf Sarai Women Seeking Men 9654467111Call Girls In Yusuf Sarai Women Seeking Men 9654467111
Call Girls In Yusuf Sarai Women Seeking Men 9654467111Sapana Sha
 
fca-bsps-decision-letter-redacted (1).pdf
fca-bsps-decision-letter-redacted (1).pdffca-bsps-decision-letter-redacted (1).pdf
fca-bsps-decision-letter-redacted (1).pdfHenry Tapper
 
letter-from-the-chair-to-the-fca-relating-to-british-steel-pensions-scheme-15...
letter-from-the-chair-to-the-fca-relating-to-british-steel-pensions-scheme-15...letter-from-the-chair-to-the-fca-relating-to-british-steel-pensions-scheme-15...
letter-from-the-chair-to-the-fca-relating-to-british-steel-pensions-scheme-15...Henry Tapper
 
VIP Kolkata Call Girl Jodhpur Park 👉 8250192130 Available With Room
VIP Kolkata Call Girl Jodhpur Park 👉 8250192130  Available With RoomVIP Kolkata Call Girl Jodhpur Park 👉 8250192130  Available With Room
VIP Kolkata Call Girl Jodhpur Park 👉 8250192130 Available With Roomdivyansh0kumar0
 
Quantitative Analysis of Retail Sector Companies
Quantitative Analysis of Retail Sector CompaniesQuantitative Analysis of Retail Sector Companies
Quantitative Analysis of Retail Sector Companiesprashantbhati354
 
Unveiling the Top Chartered Accountants in India and Their Staggering Net Worth
Unveiling the Top Chartered Accountants in India and Their Staggering Net WorthUnveiling the Top Chartered Accountants in India and Their Staggering Net Worth
Unveiling the Top Chartered Accountants in India and Their Staggering Net WorthShaheen Kumar
 
AfRESFullPaper22018EmpiricalPerformanceofRealEstateInvestmentTrustsandShareho...
AfRESFullPaper22018EmpiricalPerformanceofRealEstateInvestmentTrustsandShareho...AfRESFullPaper22018EmpiricalPerformanceofRealEstateInvestmentTrustsandShareho...
AfRESFullPaper22018EmpiricalPerformanceofRealEstateInvestmentTrustsandShareho...yordanosyohannes2
 
How Automation is Driving Efficiency Through the Last Mile of Reporting
How Automation is Driving Efficiency Through the Last Mile of ReportingHow Automation is Driving Efficiency Through the Last Mile of Reporting
How Automation is Driving Efficiency Through the Last Mile of ReportingAggregage
 
government_intervention_in_business_ownership[1].pdf
government_intervention_in_business_ownership[1].pdfgovernment_intervention_in_business_ownership[1].pdf
government_intervention_in_business_ownership[1].pdfshaunmashale756
 
Instant Issue Debit Cards - School Designs
Instant Issue Debit Cards - School DesignsInstant Issue Debit Cards - School Designs
Instant Issue Debit Cards - School Designsegoetzinger
 
Russian Call Girls In Gtb Nagar (Delhi) 9711199012 💋✔💕😘 Naughty Call Girls Se...
Russian Call Girls In Gtb Nagar (Delhi) 9711199012 💋✔💕😘 Naughty Call Girls Se...Russian Call Girls In Gtb Nagar (Delhi) 9711199012 💋✔💕😘 Naughty Call Girls Se...
Russian Call Girls In Gtb Nagar (Delhi) 9711199012 💋✔💕😘 Naughty Call Girls Se...shivangimorya083
 
VIP Call Girls LB Nagar ( Hyderabad ) Phone 8250192130 | ₹5k To 25k With Room...
VIP Call Girls LB Nagar ( Hyderabad ) Phone 8250192130 | ₹5k To 25k With Room...VIP Call Girls LB Nagar ( Hyderabad ) Phone 8250192130 | ₹5k To 25k With Room...
VIP Call Girls LB Nagar ( Hyderabad ) Phone 8250192130 | ₹5k To 25k With Room...Suhani Kapoor
 
Bladex Earnings Call Presentation 1Q2024
Bladex Earnings Call Presentation 1Q2024Bladex Earnings Call Presentation 1Q2024
Bladex Earnings Call Presentation 1Q2024Bladex
 
Attachment Of Assets......................
Attachment Of Assets......................Attachment Of Assets......................
Attachment Of Assets......................AmanBajaj36
 

Recently uploaded (20)

Financial institutions facilitate financing, economic transactions, issue fun...
Financial institutions facilitate financing, economic transactions, issue fun...Financial institutions facilitate financing, economic transactions, issue fun...
Financial institutions facilitate financing, economic transactions, issue fun...
 
(办理原版一样)QUT毕业证昆士兰科技大学毕业证学位证留信学历认证成绩单补办
(办理原版一样)QUT毕业证昆士兰科技大学毕业证学位证留信学历认证成绩单补办(办理原版一样)QUT毕业证昆士兰科技大学毕业证学位证留信学历认证成绩单补办
(办理原版一样)QUT毕业证昆士兰科技大学毕业证学位证留信学历认证成绩单补办
 
call girls in Nand Nagri (DELHI) 🔝 >༒9953330565🔝 genuine Escort Service 🔝✔️✔️
call girls in  Nand Nagri (DELHI) 🔝 >༒9953330565🔝 genuine Escort Service 🔝✔️✔️call girls in  Nand Nagri (DELHI) 🔝 >༒9953330565🔝 genuine Escort Service 🔝✔️✔️
call girls in Nand Nagri (DELHI) 🔝 >༒9953330565🔝 genuine Escort Service 🔝✔️✔️
 
House of Commons ; CDC schemes overview document
House of Commons ; CDC schemes overview documentHouse of Commons ; CDC schemes overview document
House of Commons ; CDC schemes overview document
 
Call Girls In Yusuf Sarai Women Seeking Men 9654467111
Call Girls In Yusuf Sarai Women Seeking Men 9654467111Call Girls In Yusuf Sarai Women Seeking Men 9654467111
Call Girls In Yusuf Sarai Women Seeking Men 9654467111
 
fca-bsps-decision-letter-redacted (1).pdf
fca-bsps-decision-letter-redacted (1).pdffca-bsps-decision-letter-redacted (1).pdf
fca-bsps-decision-letter-redacted (1).pdf
 
letter-from-the-chair-to-the-fca-relating-to-british-steel-pensions-scheme-15...
letter-from-the-chair-to-the-fca-relating-to-british-steel-pensions-scheme-15...letter-from-the-chair-to-the-fca-relating-to-british-steel-pensions-scheme-15...
letter-from-the-chair-to-the-fca-relating-to-british-steel-pensions-scheme-15...
 
Commercial Bank Economic Capsule - April 2024
Commercial Bank Economic Capsule - April 2024Commercial Bank Economic Capsule - April 2024
Commercial Bank Economic Capsule - April 2024
 
VIP Kolkata Call Girl Jodhpur Park 👉 8250192130 Available With Room
VIP Kolkata Call Girl Jodhpur Park 👉 8250192130  Available With RoomVIP Kolkata Call Girl Jodhpur Park 👉 8250192130  Available With Room
VIP Kolkata Call Girl Jodhpur Park 👉 8250192130 Available With Room
 
Quantitative Analysis of Retail Sector Companies
Quantitative Analysis of Retail Sector CompaniesQuantitative Analysis of Retail Sector Companies
Quantitative Analysis of Retail Sector Companies
 
🔝+919953056974 🔝young Delhi Escort service Pusa Road
🔝+919953056974 🔝young Delhi Escort service Pusa Road🔝+919953056974 🔝young Delhi Escort service Pusa Road
🔝+919953056974 🔝young Delhi Escort service Pusa Road
 
Unveiling the Top Chartered Accountants in India and Their Staggering Net Worth
Unveiling the Top Chartered Accountants in India and Their Staggering Net WorthUnveiling the Top Chartered Accountants in India and Their Staggering Net Worth
Unveiling the Top Chartered Accountants in India and Their Staggering Net Worth
 
AfRESFullPaper22018EmpiricalPerformanceofRealEstateInvestmentTrustsandShareho...
AfRESFullPaper22018EmpiricalPerformanceofRealEstateInvestmentTrustsandShareho...AfRESFullPaper22018EmpiricalPerformanceofRealEstateInvestmentTrustsandShareho...
AfRESFullPaper22018EmpiricalPerformanceofRealEstateInvestmentTrustsandShareho...
 
How Automation is Driving Efficiency Through the Last Mile of Reporting
How Automation is Driving Efficiency Through the Last Mile of ReportingHow Automation is Driving Efficiency Through the Last Mile of Reporting
How Automation is Driving Efficiency Through the Last Mile of Reporting
 
government_intervention_in_business_ownership[1].pdf
government_intervention_in_business_ownership[1].pdfgovernment_intervention_in_business_ownership[1].pdf
government_intervention_in_business_ownership[1].pdf
 
Instant Issue Debit Cards - School Designs
Instant Issue Debit Cards - School DesignsInstant Issue Debit Cards - School Designs
Instant Issue Debit Cards - School Designs
 
Russian Call Girls In Gtb Nagar (Delhi) 9711199012 💋✔💕😘 Naughty Call Girls Se...
Russian Call Girls In Gtb Nagar (Delhi) 9711199012 💋✔💕😘 Naughty Call Girls Se...Russian Call Girls In Gtb Nagar (Delhi) 9711199012 💋✔💕😘 Naughty Call Girls Se...
Russian Call Girls In Gtb Nagar (Delhi) 9711199012 💋✔💕😘 Naughty Call Girls Se...
 
VIP Call Girls LB Nagar ( Hyderabad ) Phone 8250192130 | ₹5k To 25k With Room...
VIP Call Girls LB Nagar ( Hyderabad ) Phone 8250192130 | ₹5k To 25k With Room...VIP Call Girls LB Nagar ( Hyderabad ) Phone 8250192130 | ₹5k To 25k With Room...
VIP Call Girls LB Nagar ( Hyderabad ) Phone 8250192130 | ₹5k To 25k With Room...
 
Bladex Earnings Call Presentation 1Q2024
Bladex Earnings Call Presentation 1Q2024Bladex Earnings Call Presentation 1Q2024
Bladex Earnings Call Presentation 1Q2024
 
Attachment Of Assets......................
Attachment Of Assets......................Attachment Of Assets......................
Attachment Of Assets......................
 

SBI Beats 1QFY2011 Estimates on Strong NII, Lower Costs

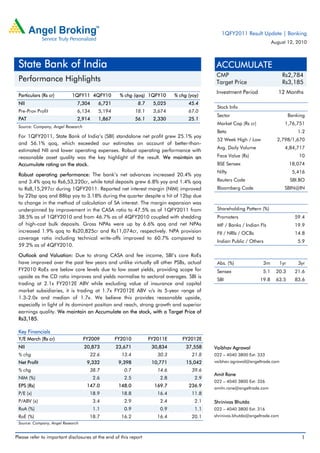
  • 1. 1QFY2011 Result Update | Banking August 12, 2010 State Bank of India ACCUMULATE CMP Rs2,784 Performance Highlights Target Price Rs3,185   Investment Period 12 Months       Particulars (Rs cr) 1QFY11 4QFY10 % chg (qoq) 1QFY10 % chg (yoy) NII 7,304 6,721 8.7 5,025 45.4 Stock Info Pre-Prov Profit 6,134 5,194 18.1 3,674 67.0 Sector Banking PAT 2,914 1,867 56.1 2,330 25.1 Market Cap (Rs cr) 1,76,751 Source: Company, Angel Research Beta 1.2 For 1QFY2011, State Bank of India’s (SBI) standalone net profit grew 25.1% yoy 52 Week High / Low 2,798/1,670 and 56.1% qoq, which exceeded our estimates on account of better-than- Avg. Daily Volume 4,84,717 estimated NII and lower operating expenses. Robust operating performance with reasonable asset quality was the key highlight of the result. We maintain an Face Value (Rs) 10 Accumulate rating on the stock. BSE Sensex 18,074 Nifty 5,416 Robust operating performance: The bank’s net advances increased 20.4% yoy and 3.4% qoq to Rs6,53,220cr, while total deposits grew 6.8% yoy and 1.4% qoq Reuters Code SBI.BO to Rs8,15,297cr during 1QFY2011. Reported net interest margin (NIM) improved Bloomberg Code SBIN@IN by 22bp qoq and 88bp yoy to 3.18% during the quarter despite a hit of 12bp due to change in the method of calculation of SA interest. The margin expansion was underpinned by improvement in the CASA ratio to 47.5% as of 1QFY2011 from Shareholding Pattern (%) 38.5% as of 1QFY2010 and from 46.7% as of 4QFY2010 coupled with shedding Promoters 59.4 of high-cost bulk deposits. Gross NPAs were up by 6.6% qoq and net NPAs MF / Banks / Indian Fls 19.9 increased 1.9% qoq to Rs20,825cr and Rs11,074cr, respectively. NPA provision FII / NRIs / OCBs 14.8 coverage ratio including technical write-offs improved to 60.7% compared to Indian Public / Others 5.9 59.2% as of 4QFY2010. Outlook and Valuation: Due to strong CASA and fee income, SBI’s core RoEs have improved over the past few years and unlike virtually all other PSBs, actual Abs. (%) 3m 1yr 3yr FY2010 RoEs are below core levels due to low asset yields, providing scope for Sensex 5.1 20.3 21.6 upside as the CD ratio improves and yields normalise to sectoral averages. SBI is SBI 19.8 63.5 83.6 trading at 2.1x FY2012E ABV while excluding value of insurance and capital market subsidiaries, it is trading at 1.7x FY2012E ABV v/s its 5-year range of 1.3-2.0x and median of 1.7x. We believe this provides reasonable upside, especially in light of its dominant position and reach, strong growth and superior earnings quality. We maintain an Accumulate on the stock, with a Target Price of Rs3,185. Key Financials Y/E March (Rs cr) FY2009 FY2010 FY2011E FY2012E NII 20,873 23,671 30,834 37,558 Vaibhav Agrawal % chg 22.6 13.4 30.3 21.8 022 – 4040 3800 Ext: 333 Net Profit 9,332 9,398 10,771 15,042 vaibhav.agrawal@angeltrade.com % chg 38.7 0.7 14.6 39.6 Amit Rane NIM (%) 2.6 2.5 2.8 2.9 022 – 4040 3800 Ext: 326 EPS (Rs) 147.0 148.0 169.7 236.9 amitn.rane@angeltrade.com P/E (x) 18.9 18.8 16.4 11.8 P/ABV (x) 3.4 2.9 2.4 2.1 Shrinivas Bhutda RoA (%) 1.1 0.9 0.9 1.1 022 – 4040 3800 Ext: 316 RoE (%) 18.7 16.2 16.4 20.1 shrinivas.bhutda@angeltrade.com Source: Company, Angel Research Please refer to important disclosures at the end of this report 1
  • 2. State Bank of India | 1QFY2011 Result Update Exhibit 1: 1QFY2011 performance Particulars (Rs cr) 1QFY11 4QFY10 % chg (qoq) 1QFY10 % chg (yoy) Interest earned 18,452 17,966 2.7 17,473 5.6 Interest expenses 11,148 11,244 (0.9) 12,448 (10.4) Net interest income 7,304 6,721 8.7 5,025 45.4 Non-interest income 3,690 4,509 (18.2) 3,569 3.4 Total income 10,994 11,230 (2.1) 8,594 27.9 Operating expenses 4,859 6,036 (19.5) 4,920 (1.2) Pre-prov. profit 6,134 5,194 18.1 3,674 67.0 Provisions & cont. 1,551 2,349 (34.0) 173 798.1 PBT 4,583 2,844 61.1 3,501 30.9 Prov. for taxes 1,669 978 70.7 1,171 42.5 PAT 2,914 1,867 56.1 2,330 25.1 EPS (Rs) 45.9 29.4 56.1 36.7 25.1 Cost-to-income ratio (%) 44.2 53.7 57.2 Effective tax rate (%) 36.4 34.4 33.4 Net NPA (%) 1.7 1.7 1.6 Source: Company, Angel Research Exhibit 2: 1QFY2011 Actual vs. Estimates Particulars (Rs cr) Actual Estimates Var (%) Net interest income 7,304 6,404 14.0 Non-interest income 3,690 3,848 (4.1) Total income 10,994 10,252 7.2 Operating expenses 4,859 5,374 (9.6) Pre-prov. profit 6,134 4,878 25.8 Provisions & cont. 1,551 1,372 13.1 PBT 4,583 3,506 30.7 Prov. for taxes 1,669 1,192 40.0 PAT 2,914 2,314 26.0 Source: Company, Angel Research August 12, 2010 2
  • 3. State Bank of India | 1QFY2011 Result Update Advances grow in line with industry, deposits growth lags During the quarter, net advances of the bank increased 20.4% yoy and 3.4% qoq to Rs6,53,220cr, underpinned by strong growth in large corporate advances of 34.7% yoy and growth in home loans of 29.8% yoy. Loan book of the bank continues to be well diversified with no segment accounting for more than 21% of the total loan book. The growth in advances was driven by the telecom related lending (Rs7,000cr) and upturn in textiles, iron and steel, auto, infrastructure and gems & jewellery industry. Going forward, the credit demand from the large and mid corporate segments is expected to be strong, with sanctions in pipeline of Rs14,798cr and Rs7,791cr, respectively. Exhibit 3: Segment-wise advances yoy growth rates Segment % Large Corporate 34.7 Mid-Corporate 14.3 SME 14.7 Agricultural 16.0 International 22.1 Home 29.8 Auto 48.1 Education 30.8 Overall Advances 20.4 Source: Company, Angel Research Deposits of the bank went up from Rs7,63,563cr in 1QFY2010 to Rs8,15,297cr in 1QFY2011 recording a yoy growth of 6.8%, driven by CASA growth of 28.9% and retail term deposits growth of 10.2%, despite shedding of high-cost bulk deposits by 51.4%. Current deposits increased 12.5% yoy, while savings deposits rose 33.9% yoy. Savings bank deposits grew at an average of Rs9,232cr per month during the quarter to Rs71,806cr as of 1QFY2011 leading to an improvement in CASA ratio from 38.5% as of 1QFY2010 to 47.5% as of 1QFY2011 (46.7% in 4QFY2010). As a result, NII increased by 45.4% yoy and 8.7% qoq to Rs7,304cr in 1QFY2011. Exhibit 4: Business growth trend Advances YoY Growth Deposits YoY Growth Credit-Deposit Ratio (RHS) (%) (%) 40.0 84 80 30.0 76 20.0 72 10.0 68 - 64 1QFY10 2QFY10 3QFY10 4QFY10 1QFY11 Source: Company, Angel Research August 12, 2010 3
  • 4. State Bank of India | 1QFY2011 Result Update Exhibit 5: Well-diversified loan book - 1QFY2011 Others International 3% 16% Retail 21% Mid-Corporate Agricultural 20% 9% Large Corporate SME 14% 17% Source: Company, Angel Research NIM continues its ride on growth path The bank’s reported NIM has been in an upward trend since hitting a low of 2.30% in 1QFY2010 from which it has improved by 88bp to 3.18% in 1QFY2011. Even on a sequential basis, NIM has expanded by 22bp despite the 12bp hit due to the switch in calculation method of savings deposits interest. The improvement in NIMs was driven by increase in the CD ratio to 80.1% (from 78.6% in 4QFY2010), shedding of bulk deposits and increase in CASA ratio. Exhibit 6: Trend in spreads and NIMs (%) Yield on Advances Cost of Deposits Reported NIM 12.00 10.01 10.24 10.42 10.15 10.01 9.95 9.79 9.66 9.30 9.00 6.16 5.94 5.95 6.30 6.16 6.06 5.92 5.80 5.27 6.00 3.03 3.16 3.10 2.82 2.96 3.18 2.39 2.30 2.55 3.00 0.00 1QFY09 2QFY09 3QFY09 4QFY09 1QFY10 2QFY10 3QFY10 4QFY10 1QFY11 Source: Company, Angel Research Reasonable asset quality SBI’s asset quality suffered slightly during the quarter as gross NPAs rose 6.6% qoq to Rs20,825cr, while net NPAs increased 1.9% qoq to Rs11,074cr partly due to the net increase in gross NPAs from agricultural advances of Rs683cr, which included Rs354cr towards the Agri Debt Waiver scheme. The gross and net NPA ratio remained steady sequentially at 3.1% and 1.7%, respectively. The gross slippages during the quarter were Rs4,081cr, which came primarily from the agri, retail and SME portfolios. The annualised slippage ratio stood at 2.6% compared to 2.2% in FY2010. The bank’s corporate and SME portfolio accounted for more than 56.0% of the total gross NPAs of Rs20,825cr. The provision August 12, 2010 4
  • 5. State Bank of India | 1QFY2011 Result Update coverage ratio including technical write-offs improved from 59.2% as of 4QFY2010 to 60.7% as of 1QFY2011. Out of the cumulative standard restructured assets under the RBI Special Dispensation Scheme which stood at Rs16,796cr as of 4QFY2010, Rs158cr turned into NPAs during the quarter taking the cumulative slippages from restructured book to Rs1,774cr (10.6% of the restructured loan book). The bank’s restructured loans outside the RBI scheme stood at Rs12,900cr, indicating cumulative restructuring/net worth of 43.1% compared to sector average of 68.3%. Exhibit 7: Trend in asset quality Gross NPAs Net NPAs Provision coverage (RHS) (Rs cr) (%) 25,000 70.0 20,000 60.0 15,000 50.0 10,000 40.0 5,000 - 30.0 1QFY09 2QFY09 3QFY09 4QFY09 1QFY10 2QFY10 3QFY10 4QFY10 1QFY11 Source: Company, Angel Research, Note: NPA coverage excluding technical write-offs till 3QFY2009 Provisioning expenses rose substantially on a yoy basis to Rs1,551cr in 1QFY2011, on the back of higher NPA provisions (Rs1,733cr) and lower write-back of investment provisions (Rs298cr). Exhibit 8: Breakup of provisioning expenses (Rs cr) 1QFY11 4QFY10 % chg (qoq) 1QFY10 % chg (yoy) NPA 1,733 2,187 (20.7) 1,344 29.0 Standard Assets 106 72 46.2 14 656.6 Investments (298) 36 - (1,201) (75.2) Others 10 55 (81.0) 15 (31.4) Total 1,551 2,349 (34.0) 173 798.1 Source: Company, Angel Research Operating expenses under control Operating expenses declined 19.5% qoq and 1.2% yoy to Rs4,859cr driven by a 14.4% qoq and 9.9% yoy fall in staff expenses. Decrease in operating expenses coupled with robust operating performance improved the cost-to-income ratio to 44.2% compared to 53.7% in 4QFY2010 and 57.2% in 1QFY2010. There was a write-back of Rs845cr from excess provision on wage revision during the quarter. The bank made a provision of Rs1,100cr for gratuity during 1QFY2011 against the estimated liability of Rs2,200cr for FY2011E for the increase in gratuity ceiling. August 12, 2010 5
  • 6. State Bank of India | 1QFY2011 Result Update Exhibit 9: Breakup of operating expenses (Rs cr) 1QFY11 4QFY10 % chg (qoq) 1QFY10 % chg (yoy) Staff expenses 3,074 3,592 (14.4) 3,411 (9.9) Overhead expenses 1,785 2,444 (27.0) 1,508 18.4 Total 4,859 6,036 (19.5) 4,920 (1.2) Source: Company, Angel Research Exhibit 10: Trend in productivity Employee Expenses Other Expenses Cost-to-income ratio (RHS) (Rs cr) (%) 7,500 57 60 6,000 54 52 55 4,500 50 47 50 3,000 46 45 45 44 1,500 45 - 40 1QFY09 2QFY09 3QFY09 4QFY09 1QFY10 2QFY10 3QFY10 4QFY10 1QFY11 Source: Company, Angel Research Comfortable capital adequacy The bank has continued to maintain comfortable capital adequacy ratio of above 13.5%. As of 1QFY2011, the overall capital adequacy stood at 13.54% with tier I forming more than 72.3% of the total CAR. The bank is likely to come out with a rights issue by the end of FY2011 to sustain the CAR at comfortable levels. The government has already approved diluting its stake to 51% from the existing stipulated dilution level of 55%. This provides significant headroom for dilution with the existing government holding at 59.4%. Exhibit 11: Comfortable capital adequacy (%) Tier I Tier II 16.0 12.0 4.9 4.4 4.3 4.1 3.9 3.8 8.0 9.4 9.7 9.8 9.7 9.5 9.8 4.0 - 4QFY09 1QFY10 2QFY10 3QFY10 4QFY10 1QFY11 Source: Company, Angel Research August 12, 2010 6
  • 7. State Bank of India | 1QFY2011 Result Update Muted non-interest income, supported strongly by fee income Total non-interest income growth was muted at 3.4% yoy on account of 75.5% yoy decline in profit on sale of investments. Non-interest income excluding profit on sale of investments was up by 23.0% yoy. Fee income went up 29.4% yoy, driven by robust growth in loan processing charges, non-fund based business, government business and cross-selling. Forex income increased 6.8% yoy to Rs503cr. Growth in other non-interest income was driven by the 42.0% growth in recoveries from written-off accounts. Exhibit 12: Breakup of non-interest income (Rs cr) 1QFY11 4QFY10 % chg (qoq) 1QFY10 % chg (yoy) CEB 2,410 3,486 (30.9) 1,862 29.4 Treasury 173 426 (59.3) 709 (75.5) Forex 503 185 172.1 470 6.8 Dividend 377 47 700.7 358 5.3 Others 227 365 (37.8) 169 34.2 Total 3,690 4,509 (18.2) 3,569 3.4 Source: Company, Angel Research Performance of Associates and Subsidiaries Advances and deposits of associate banks recorded yoy growth of 18.4% and 16.0%, respectively. Gross and net NPAs of the associate banks stood at 2.1% and 1.0%, respectively. Operating profit of associate banks increased 47.4% yoy to Rs1,881cr (Rs1,276cr). However, net profit of the associate banks declined marginally by 0.5% yoy mainly on account of higher provisioning for NPAs taking the provision coverage ratio to a healthy 66%. SBI Life earned PAT of Rs114cr (Rs39cr), registering yoy growth of 192.3%. AuM of the company increased by 64.0% yoy to reach Rs30,082cr. The company was ranked second amongst the private insurance companies under New Business Premium, as on June, 2010. SBI Capital Markets posted PAT of Rs157cr for 1QFY2011, registering a yoy growth of 93% after excluding provision of Rs64cr towards syndication fee sharing payable to SBI. SBI Funds Management posted PAT of Rs15cr in 1QFY2011 as against Rs14cr for 1QFY2010. SBI Cards and Payment Services turned-around in 1QFY2011 with net profit of Rs3cr compared to loss of Rs24cr in 1QFY2010. The overall SBI Group recorded net profit growth of 22.0% yoy to Rs3,365cr (Rs2,759cr) for 1QFY2011. August 12, 2010 7
  • 8. State Bank of India | 1QFY2011 Result Update Exhibit 13: Yoy growth rates for associate banks (%) Deposits Advances Operating Profit Net Profit State Bank of Bikaner & Jaipur 23.8 21.7 34.9 (30.0) State Bank of Hyderabad 24.6 27.4 53.9 82.6 State Bank of Indore 2.3 9.6 30.5 (76.6) State Bank of Mysore 17.7 16.9 55.2 35.5 State Bank of Patiala 5.2 12.4 98.6 10.3 State Bank of Travancore 19.6 18.4 12.8 (16.6) Total 16.0 18.4 47.4 (0.5) Source: Company, Angel Research August 12, 2010 8
  • 9. State Bank of India | 1QFY2011 Result Update Investment Arguments Improving savings market share Up to FY2007, the bank witnessed a significant decline in CASA market share with private sector banks pursuing aggressive branch expansion. However, the bank’s market share of savings deposits expanded by a substantial 270bp to 23.2% during FY2007-10 (one of the few PSBs to do so) driven by relatively faster branch expansion (9.5% CAGR v/s 2-5% for most PSBs) leveraging its tremendous trust factor in the country. Strongest fee income among PSU banks SBI has a relatively strong share of fee income owing to its strong corporate and government business relationships. During FY2010, the bank continued its dominance with non-interest income/assets at 1.3% (highest among PSU banks). Asset quality concerns receding SBI has a gross NPA ratio of 3.1% and net NPA ratio of 1.7%, leading to a low provision coverage ratio of 60.7% (including technical write-offs) and restructured loans of around Rs30,000cr, constituting 43% of its net worth, which is lower than the peer average. We have factored in a slippage ratio of 2.2% for FY2011E (equal to slippage ratio in FY2010) on a conservative basis. This provides sufficient margin of safety to our provisions estimates. Outlook and Valuation Due to strong CASA and fee income, SBI’s core RoEs have improved over the past few years and unlike virtually all other PSBs, FY2010 RoEs are below core levels due to low asset yields, providing scope for upside as the CD ratio improves and yields normalise to sectoral averages. At CMP, SBI is trading at 2.1x FY2012E ABV while excluding value of insurance and capital market subsidiaries, it is trading at 1.7x FY2012E ABV v/s its 5-year range of 1.3-2.0x and median of 1.7x. We believe this provides reasonable upside, especially in light of its dominant position and reach, strong growth and superior earnings quality. We maintain an Accumulate on the stock, with a Target Price of Rs3,185. August 12, 2010 9
  • 10. State Bank of India | 1QFY2011 Result Update Exhibit 14: SOTP valuation summary Company (Rs) Value per share SBI & Associates 2,956 Life 190 AMC 12 Others (Cap Mkt, Cards, Factors) 28 SOTP value 3,185 Source: Angel Research Exhibit 15: Key Assumptions Earlier Estimates Revised Estimates Particulars (%) FY2011E FY2012E FY2011E FY2012E Credit growth 21.0 20.0 21.0 20.0 Deposit growth 21.0 20.0 17.0 20.0 CASA ratio 46.9 46.5 48.5 48.5 NIMs 2.7 2.7 2.8 2.9 Other income growth 5.4 17.3 5.1 17.2 Growth in staff expenses 15.0 19.0 7.0 20.0 Growth in other expenses 15.0 19.0 7.0 20.0 Slippages 2.0 1.7 2.2 1.9 Coverage ratio 70.5 72.7 72.2 73.6 Treasury gain/(loss) (% of investments) 0.3 0.3 0.2 0.2 Source: Company, Angel Research Exhibit 16: Change in estimates FY2011E FY2012E Particulars (Rs cr) Earlier Revised Earlier Revised % chg % chg estimates estimates estimates estimates NII 29,289 30,834 5.3 35,599 37,558 5.5 Non-interest income 16,033 15,980 (0.3) 18,784 18,731 (0.3) Total income 45,322 46,815 3.3 54,383 56,290 3.5 Operating expenses 23,366 21,741 (7.0) 27,806 26,089 (6.2) Pre-prov. profit 21,956 25,074 14.2 26,577 30,201 13.6 Provisions & cont. 6,860 8,885 29.5 5,569 7,554 35.6 PBT 15,096 16,189 7.2 21,008 22,646 7.8 Prov. for taxes 5,046 5,417 7.4 7,047 7,604 7.9 PAT 10,050 10,771 7.2 13,961 15,042 7.7 Source: Company, Angel Research August 12, 2010 10
  • 11. State Bank of India | 1QFY2011 Result Update Exhibit 17: P/ABV band Price 1.0x 1.5x 2.0x 2.5x 3.0x (Rs) 4500 4000 3500 3000 2500 2000 1500 1000 500 0 Dec-03 Dec-06 Apr-09 Jul-04 Jul-07 Mar-02 Oct-02 Mar-05 Oct-05 Feb-08 Sep-08 Nov-09 May-03 May-06 Jun-10 Jan-11 Source: Company, Angel Research Exhibit 18: State Bank of India - P/E Band Price 5x 10x 15x 20x 3,600 3,000 2,400 1,800 1,200 600 0 Apr-01 Dec-01 Apr-03 Dec-03 Apr-05 Dec-05 Apr-07 Dec-07 Apr-09 Dec-09 Aug-02 Aug-04 Aug-06 Aug-08 Aug-10 Source: Company, Angel Research Exhibit 19: Discount to Sensex - State Bank of India Discount to Sensex Avg. Historical Discount 0 (10) (20) (30) (40) (50) (60) (70) Aug-07 Aug-08 Aug-09 Aug-10 Jul-06 Dec-06 Dec-07 Dec-08 Dec-09 Apr-07 Apr-08 Apr-09 Apr-10 Mar-06 Source: Company, Angel Research August 12, 2010 11
  • 12. State Bank of India | 1QFY2011 Result Update Exhibit 20: Angel EPS forecast v/s consensus Year Angel Forecast Bloomberg Consensus Var.(%) FY2011E 169.7 172.0 (1.4) FY2012E 236.9 216.3 9.5 Source: Company, Angel Research, Bloomberg Exhibit 21: Recommendation summary CMP Tgt. Price Upside FY2012E FY2012E FY2012E FY10-12E FY2012E FY2012E Company Reco (Rs) (Rs) (%) P/ABV (x) Tgt P/ABV (x) P/E (x) CAGR in EPS (%) RoA (%) RoE (%) AxisBk Buy 1,317 1,688 28.2 2.5 3.2 13.1 27.4 1.6 20.5 FedBk Buy 324 409 26.3 0.9 1.2 7.0 30.7 1.4 14.4 HDFCBk Buy 2,075 2,514 21.2 3.3 4.0 17.3 36.5 1.7 20.6 ICICIBk Buy 964 1,211 25.6 1.9 2.5 15.6 31.0 1.4 15.5 SIB Neutral 200 - - 1.2 - 7.0 17.1 1.0 17.8 YesBk Neutral 306 - - 2.5 - 15.4 18.7 1.3 17.1 BOI Neutral 462 - - 1.4 - 7.3 38.0 0.9 20.5 CorpBk Neutral 594 - - 1.1 - 5.7 13.4 1.0 20.5 DenaBk Accumulate 101 109 7.8 0.9 1.0 4.8 7.3 0.8 19.2 IndBk Accumulate 230 256 11.1 1.1 1.2 5.7 7.6 1.3 21.0 IOB Buy 127 147 15.6 0.9 1.1 6.3 25.1 0.7 14.9 OBC Neutral 403 - - 1.0 - 6.0 21.6 0.9 18.3 PNB Neutral 1,132 - - 1.6 - 7.6 9.3 1.2 21.9 SBI Accumulate 2,784 3,185 14.4 1.7 2.0 11.8 26.5 1.1 20.1 UcoBk Accumulate 102 111 9.4 0.9 1.0 4.2 15.1 0.8 25.5 UnionBk Accumulate 329 355 7.8 1.3 1.4 5.8 17.1 1.1 24.1 Source: Company, Angel Research; Note: P/ABVs of the core banks. August 12, 2010 12
  • 13. State Bank of India | 1QFY2011 Result Update Income statement Y/E March (Rs cr) FY06 FY07 FY08 FY09 FY10 FY11E FY12E Net Interest Income 15,636 15,058 17,021 20,873 23,671 30,834 37,558 - YoY Growth (%) 12.1 (3.7) 13.0 22.6 13.4 30.3 21.8 Other Income 7,447 7,406 9,398 12,902 15,200 15,980 18,731 - YoY Growth (%) 4.6 (0.6) 26.9 37.3 17.8 5.1 17.2 Operating Income 23,083 22,464 26,420 33,775 38,872 46,815 56,290 - YoY Growth (%) 9.6 (2.7) 17.6 27.8 15.1 20.4 20.2 Operating Expenses 11,725 11,824 12,609 15,649 20,319 21,741 26,089 - YoY Growth (%) 16.4 0.8 6.6 24.1 29.8 7.0 20.0 Pre - Provision Profit 11,358 10,641 13,811 18,127 18,553 25,074 30,201 - YoY Growth (%) 3.3 (6.3) 29.8 31.2 2.4 35.1 20.4 Prov. & Cont. 4,452 3,016 3,373 3,736 4,396 8,885 7,554 - YoY Growth (%) (0.4) (32.3) 11.8 10.8 17.7 102.1 (15.0) Profit Before Tax 6,905 7,625 10,438 14,391 14,157 16,189 22,646 - YoY Growth (%) 5.9 10.4 36.9 37.9 (1.6) 14.4 39.9 Prov. for Taxation 2,499 3,083 3,709 5,058 4,759 5,417 7,604 - as a % of PBT 36.2 40.4 35.5 35.2 33.6 33.5 33.6 PAT 4,407 4,541 6,729 9,332 9,398 10,771 15,042 - YoY Growth (%) 2.4 3.1 48.2 38.7 0.7 14.6 39.6 Balance sheet Y/E March (Rs cr) FY06 FY07 FY08 FY09 FY10 FY11E FY12E Share Capital 526 526 631 635 635 635 635 Reserves & Surplus 27,118 30,772 48,401 57,313 65,314 73,618 85,238 Deposits 380,046 435,521 537,404 742,073 804,116 940,816 1,128,979 - Growth (%) 3.5 14.6 23.4 38.1 8.4 17.0 20.0 Borrowings 30,641 39,703 51,727 53,714 71,031 83,107 99,728 Tier 2 Capital 4,986 16,169 21,289 30,344 31,980 38,696 46,435 Other Liab & Prov. 50,552 43,389 62,073 80,353 80,337 95,224 116,873 Total Liabilities 493,870 566,082 721,526 964,432 1,053,414 1,232,096 1,477,889 Cash balances 21,653 29,076 51,535 55,546 61,291 65,857 79,029 Bank balances 22,907 22,892 15,932 48,858 34,893 40,825 48,990 Investments 162,534 149,149 189,501 275,954 285,790 314,708 377,204 Advances 261,642 337,336 416,768 542,503 631,914 764,616 917,539 - Growth (%) 29.3 28.9 23.5 30.2 16.5 21.0 20.0 Fixed Assets 2,753 2,819 3,373 3,838 4,413 5,008 5,830 Other Assets 22,381 24,809 44,417 37,733 35,113 41,082 49,298 Total Assets 493,870 566,082 721,526 964,432 1,053,414 1,232,096 1,477,889 - Growth (%) 7.3 14.7 27.3 33.8 9.2 17.0 20.0 August 12, 2010 13
  • 14. State Bank of India | 1QFY2011 Result Update Ratio analysis Particulars FY06 FY07 FY08 FY09 FY10 FY11E FY12E Profitability ratios (%) NIMs 3.5 3.0 2.8 2.6 2.5 2.8 2.9 Cost to Income Ratio 50.8 52.6 47.7 46.3 52.3 46.4 46.3 RoA 0.9 0.8 1.0 1.1 0.9 0.9 1.1 RoE 17.7 15.7 18.1 18.7 16.2 16.4 20.1 B/S ratios (%) CASA Ratio 47.6 48.5 47.0 41.6 47.3 48.5 48.5 Credit/Deposit Ratio 68.8 77.5 77.6 73.1 78.6 81.3 81.3 CAR 11.9 12.3 13.5 13.2 12.3 10.7 10.6 - Tier I 9.4 8.0 9.1 8.7 8.7 7.3 7.0 Asset Quality (%) Gross NPAs 3.6 2.9 3.0 2.9 3.0 2.5 2.1 Net NPAs 1.9 1.6 1.8 1.8 1.7 0.7 0.6 Slippages 2.1 1.9 2.3 2.6 2.2 2.2 1.9 Loan Loss Prov./Avg. Assets 0.0 0.3 0.3 0.3 0.5 0.7 0.5 Provision Coverage 49.0 47.4 42.2 39.2 44.4 72.2 73.6 Per Share Data (Rs) EPS 83.7 86.3 106.6 147.0 148.0 169.7 236.9 ABVPS 477.8 542.3 709.7 824.2 944.5 1,160.8 1,348.2 DPS 14.0 14.0 21.5 29.0 30.0 31.0 44.0 Valuation Ratios PER (x) 33.3 32.3 26.1 18.9 18.8 16.4 11.8 P/ABVPS (x) 5.8 5.1 3.9 3.4 2.9 2.4 2.1 Dividend Yield 0.5 0.5 0.8 1.0 1.1 1.1 1.6 DuPont Analysis (%) NII 3.3 2.9 2.7 2.5 2.4 2.7 2.8 (-) Prov. Exp. 0.9 0.6 0.5 0.4 0.4 0.8 0.6 Adj. NII 2.4 2.3 2.1 2.0 1.9 1.9 2.2 Treasury 0.1 0.1 0.3 0.3 0.2 0.1 0.0 Int. Sens. Inc. 2.5 2.4 2.4 2.4 2.1 2.0 2.3 Other Inc. 1.4 1.2 1.2 1.2 1.3 1.3 1.3 Op. Inc. 3.9 3.6 3.6 3.6 3.4 3.3 3.6 Opex 2.5 2.2 2.0 1.9 2.0 1.9 1.9 PBT 1.4 1.4 1.6 1.7 1.4 1.4 1.7 Taxes 0.5 0.6 0.6 0.6 0.5 0.5 0.6 RoA 0.9 0.8 1.0 1.1 0.9 0.9 1.1 Leverage (x) 20.0 19.5 17.5 17.2 17.7 17.7 18.3 RoE 17.7 15.7 18.1 18.7 16.2 16.4 20.1 August 12, 2010 14
  • 15. State Bank of India | 1QFY2011 Result Update Research Team Tel: 022 - 4040 3800 E-mail: research@angeltrade.com Website: www.angeltrade.com DISCLAIMER This document is solely for the personal information of the recipient, and must not be singularly used as the basis of any investment decision. Nothing in this document should be construed as investment or financial advice. Each recipient of this document should make such investigations as they deem necessary to arrive at an independent evaluation of an investment in the securities of the companies referred to in this document (including the merits and risks involved), and should consult their own advisors to determine the merits and risks of such an investment. Angel Broking Limited, its affiliates, directors, its proprietary trading and investment businesses may, from time to time, make investment decisions that are inconsistent with or contradictory to the recommendations expressed herein. The views contained in this document are those of the analyst, and the company may or may not subscribe to all the views expressed within. Reports based on technical and derivative analysis center on studying charts of a stock's price movement, outstanding positions and trading volume, as opposed to focusing on a company's fundamentals and, as such, may not match with a report on a company's fundamentals. The information in this document has been printed on the basis of publicly available information, internal data and other reliable sources believed to be true, but we do not represent that it is accurate or complete and it should not be relied on as such, as this document is for general guidance only. Angel Broking Limited or any of its affiliates/ group companies shall not be in any way responsible for any loss or damage that may arise to any person from any inadvertent error in the information contained in this report. Angel Broking Limited has not independently verified all the information contained within this document. Accordingly, we cannot testify, nor make any representation or warranty, express or implied, to the accuracy, contents or data contained within this document. While Angel Broking Limited endeavours to update on a reasonable basis the information discussed in this material, there may be regulatory, compliance, or other reasons that prevent us from doing so. This document is being supplied to you solely for your information, and its contents, information or data may not be reproduced, redistributed or passed on, directly or indirectly. Angel Broking Limited and its affiliates may seek to provide or have engaged in providing corporate finance, investment banking or other advisory services in a merger or specific transaction to the companies referred to in this report, as on the date of this report or in the past. Neither Angel Broking Limited, nor its directors, employees or affiliates shall be liable for any loss or damage that may arise from or in connection with the use of this information. Note: Please refer to the important `Stock Holding Disclosure' report on the Angel website (Research Section). Also, please refer to the latest update on respective stocks for the disclosure status in respect of those stocks. Angel Broking Limited and its affiliates may have investment positions in the stocks recommended in this report. Disclosure of Interest Statement State Bank of India 1. Analyst ownership of the stock No 2. Angel and its Group companies ownership of the stock Yes 3. Angel and its Group companies' Directors ownership of the stock No 4. Broking relationship with company covered No Note: We have not considered any Exposure below Rs 1 lakh for Angel, its Group companies and Directors. Ratings (Returns): Buy (> 15%) Accumulate (5% to 15%) Neutral (-5 to 5%) Reduce (-5% to 15%) Sell (< -15%) August 12, 2010 15