1. Rollover Report
India Research
Aug 27, 2010
BANKNIFTY (73.36%) has witnessed less rollovers compared to 3-months average and also in absolute
open interest terms whereas Nifty (76.35%) has observed high rolls in both the form. Market wide
rollover also has been healthy at 82.73%. Options data suggest that there is no significant deviation of
trading range which prevailed in August series except that the range has widen to 5200 on lower side
and 5600 on the higher side. FIIs have pumped in significant liquidity in last two series and are now
showing signs of exhaustion. We don’t expect fund flow from them to continue at same pace. The
reason for the same being weak western markets, bounce in dollar, fall in crude which are barometers
of movement in liquidity and also they have now started shorting index futures along with put buying
which was not the case earlier. Having said this, we are not expecting a crash in the market and will
stick to the range of 5200-5600 and trade accordingly. Less rollovers in banking index indicates that its
time to take profit in this space.
Indices Change NIFTY & PCR Graph
Price
Change 3 month
INDEX Price (%) Rollover avg.
NIFTY 5477.90 1.28 76.35 70.94
BANKNIFTY 10981.70 7.88 73.36 76.58
MINIFTY 5477.90 1.28 70.22 67.55
NFTYMCAP50 2858.60 2.41 0.00 -
CNXIT 6116.15 (0.59) 47.51 56.32
Monthly Gainers Monthly Losers
Price Ol Price Ol
Change Open Change Change Open Change
Scrip Price (%) Interest (%) Scrip Price (%) Interest (%)
RUCHISOYA 131.35 30.05 13458000 40.60 STER 151.65 (15.11) 44950000 38.23
VIDEOIND 265.50 26.85 5795000 (1.24) SUZLON 48.20 (14.46) 89040000 (3.70)
TATACOMM 333.45 23.32 2139000 5.16 PUNJLLOYD 110.50 (13.44) 27124000 47.16
UCOBANK 112.85 22.33 14880000 15.74 SESAGOA 320.95 (13.14) 15409500 (1.18)
HINDPETRO 525.40 21.40 11353000 (15.95) NAGARCONST 152.90 (12.73) 5550000 52.39
Note: Stocks which have more than 1000 contract in Futures OI. Note: Stocks which have more than 1000 contract in Futures OI.
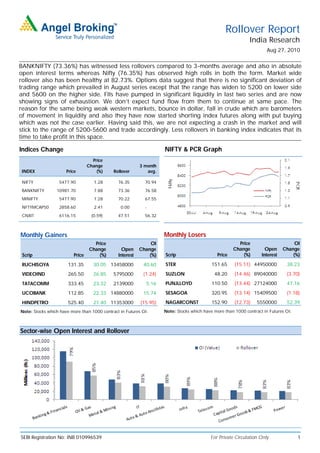
Sector-wise Open Interest and Rollover
SEBI Registration No: INB 010996539 For Private Circulation Only 1
2. Derivative Report | India Research
Banking and Financials
Counters where long positions are not rolled over
to next series in this space are INDIANB (68.32%),
BANKINDIA (70.02%) and PFC (77.24%).
Midcap Banks which witnessed rise in OI along
with healthy rolls are VIJAYABANK (86.03%), UCO
(84.60%), SYNDIBANK (83.98%) and DENABANK
(83.75%). Expect long unwinding in them at every
rise.
All the large-cap counters have added substantial
open interest month-on-month with rise in prices.
Aggressive traders can adopt buying puts strategy
in them.
Oil and Gas
RELIANCE (85.98%) has seen very high rollovers.
The increase in positions and fall in prices
indicates shorts have got rolled over. Stock is on
the lower side of the trading range. Square off
shorts and form long positions.
Long traders have not rolled their positions in
PETRONET (57.28%) as rollover figures are very
less. 115-120 is strong resistance zone. We would
advise shorting in this range.
GTOFFSHORE (92.12%) and ESSAROIL (89.22%)
have underperformed and have seen significant
addition in OI. 360 and 120 are tentative
supports. Avoid fresh shorts and risk takers can
take contra call in them around supports.
Metal and Mining
Heavy weights of this space viz. STER (84.97%),
SAIL (79.47%) and TATASTEEL (79.89%) have
accumulated substantial short positions as their
prices corrected. Their support levels are around
148, 180 and 485 respectively. Buy near support.
JINDALSAW (92.28%) and ISPATIND (91.84%)
witnessed very high rollovers while HINDZINC
(60.34%) has shown very less rollover with decline
in open interest.
Counters like BHUSANSTL (76.58%) and
JINDALSTEL (77.78%) have shown good price
action but have not rolled over long positions.
Both are near their resistance zone.
For Private Circulation Only SEBI Registration No: INB 010996539 2
3. Derivative Report | India Research
Information Technology
Combination of high rollovers and rise in open
interest with rising volumes indicates that MPHASIS
(92.27%) may have a good series. Dips till 600
should be used to accumulate this stock.
In heavy weights WIPRO (83.94%) has been
underperformer and TCS (74.95%) is near to its
strong resistance of 880. Avoid these counters.
INFOSYSTCH (79.05%) has strong support around
2720 levels; keep eye on it.
HCLTECH (68.81%) has reduced open interest
while rollovers are very less. We suggest booking
profits in long positions in this counter.
Auto and Auto Ancillary
BAJAJAUTO (88.08%) and TATAMOTORS
(79.72%) have outperformed in respective spaces
and shown good rollovers. Positions are slightly on
the heavier side so use declines to enter.
MARUTI (76.38%) has reduced open interest
substantially and rollovers are marginally less. We
believe contra buying can wait in this counter.
1260-1280 is good resistance zone, short around
those levels.
APOLLOTYRE (81.55%) has strong resistance
around 78-80 zone. Long unwinding is visible at
higher levels. Square off longs in it. Near
resistance aggressive traders can go short.
Infrastructure
Major underperformer in market, this space has
added lots of short positions in names like
RELINFRA (91.39%), NAGARCONST (89.66%) and
PATELENG (86.70%). RELINFRA is good buy in the
range of 970-980 levels while PATELENG too may
witness short covering around 360 levels.
HCC (93.29%) and GMRINFRA (92.81%) have
witnessed significant rollovers.
JPASSOCIAT (86.99%) and PUNJLLOYD (84.01%)
too have accumulated shorts positions but we don’t
expect any meaningful covering in them.
For Private Circulation Only SEBI Registration No: INB 010996539 3
10. Derivative Report | India Research
DISCLAIMER:
This document is not for public distribution and has been furnished to you solely for your information and must not be reproduced or redistributed to any other person.
Persons into whose possession this document may come are required to observe these restrictions.
Opinion expressed is our current opinion as of the date appearing on this material only. While we endeavor to update on a reasonable basis the information discussed in
this material, there may be regulatory, compliance, or other reasons that prevent us from doing so. Prospective investors and others are cautioned that any forward-
looking statements are not predictions and may be subject to change without notice. Our proprietary trading and investment businesses may make investment decisions
that are inconsistent with the recommendations expressed herein.
The information in this document has been printed on the basis of publicly available information, internal data and other reliable sources believed to be true and are for
general guidance only. While every effort is made to ensure the accuracy and completeness of information contained, the company takes no guarantee and assumes no
liability for any errors or omissions of the information. No one can use the information as the basis for any claim, demand or cause of action.
Recipients of this material should rely on their own investigations and take their own professional advice. Each recipient of this document should make such investigations
as it deems necessary to arrive at an independent evaluation of an investment in the securities of companies referred to in this document (including the merits and risks
involved), and should consult their own advisors to determine the merits and risks of such an investment. Price and value of the investments referred to in this material may
go up or down. Past performance is not a guide for future performance.
Certain transactions - futures, options and other derivatives as well as non-investment grade securities - involve substantial risks and are not suitable for all investors.
Reports based on technical analysis centers on studying charts of a stock's price movement and trading volume, as opposed to focusing on a company's fundamentals and
as such, may not match with a report on a company's fundamentals.
We do not undertake to advise you as to any change of our views expressed in this document. While we would endeavor to update the information herein on a reasonable
basis, Angel Broking, its subsidiaries and associated companies, their directors and employees are under no obligation to update or keep the information current. Also
there may be regulatory, compliance, or other reasons that may prevent Angel Broking and affiliates from doing so. Prospective investors and others are cautioned that
any forward-looking statements are not predictions and may be subject to change without notice.
Angel Broking Limited and affiliates, including the analyst who has issued this report, may, on the date of this report, and from time to time, have long or short positions
in, and buy or sell the securities of the companies mentioned herein or engage in any other transaction involving such securities and earn brokerage or compensation or
act as advisor or have other potential conflict of interest with respect to company/ies mentioned herein or inconsistent with any recommendation and related information
and opinions.
Angel Broking Limited and affiliates may seek to provide or have engaged in providing corporate finance, investment banking or other advisory services in a merger or
specific transaction to the companies referred to in this report, as on the date of this report or in the past.
Sebi Registration No.: INB 010996539
Derivative Research Team derivatives.desk@angeltrade.com
For Private Circulation Only SEBI Registration No: INB 010996539 10