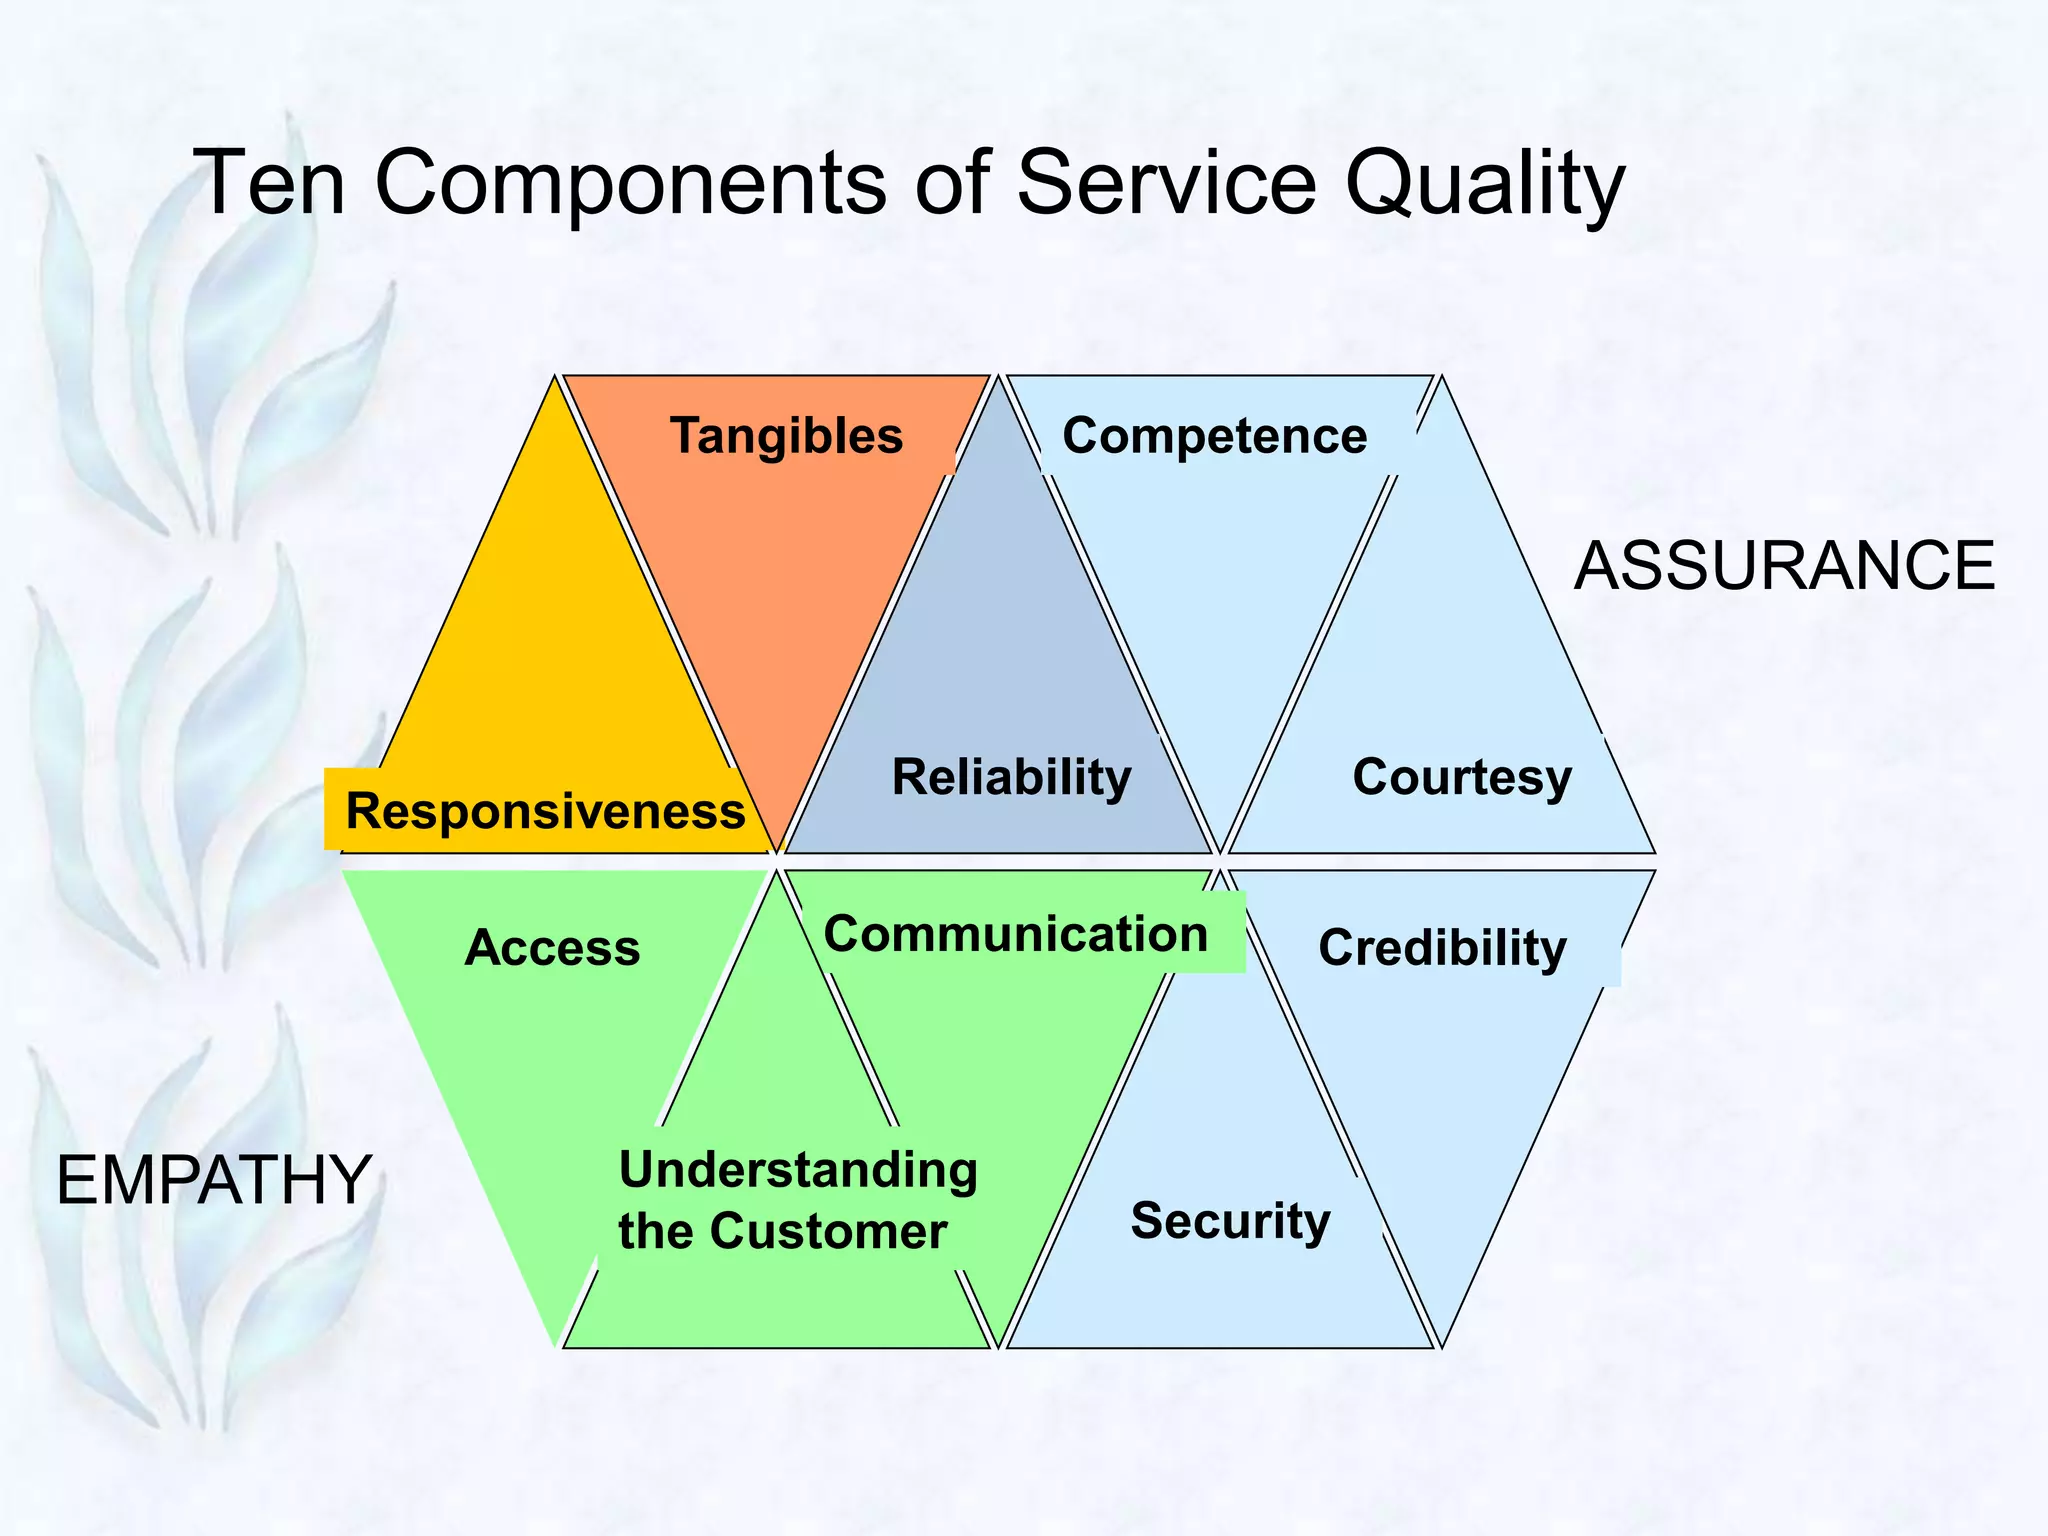
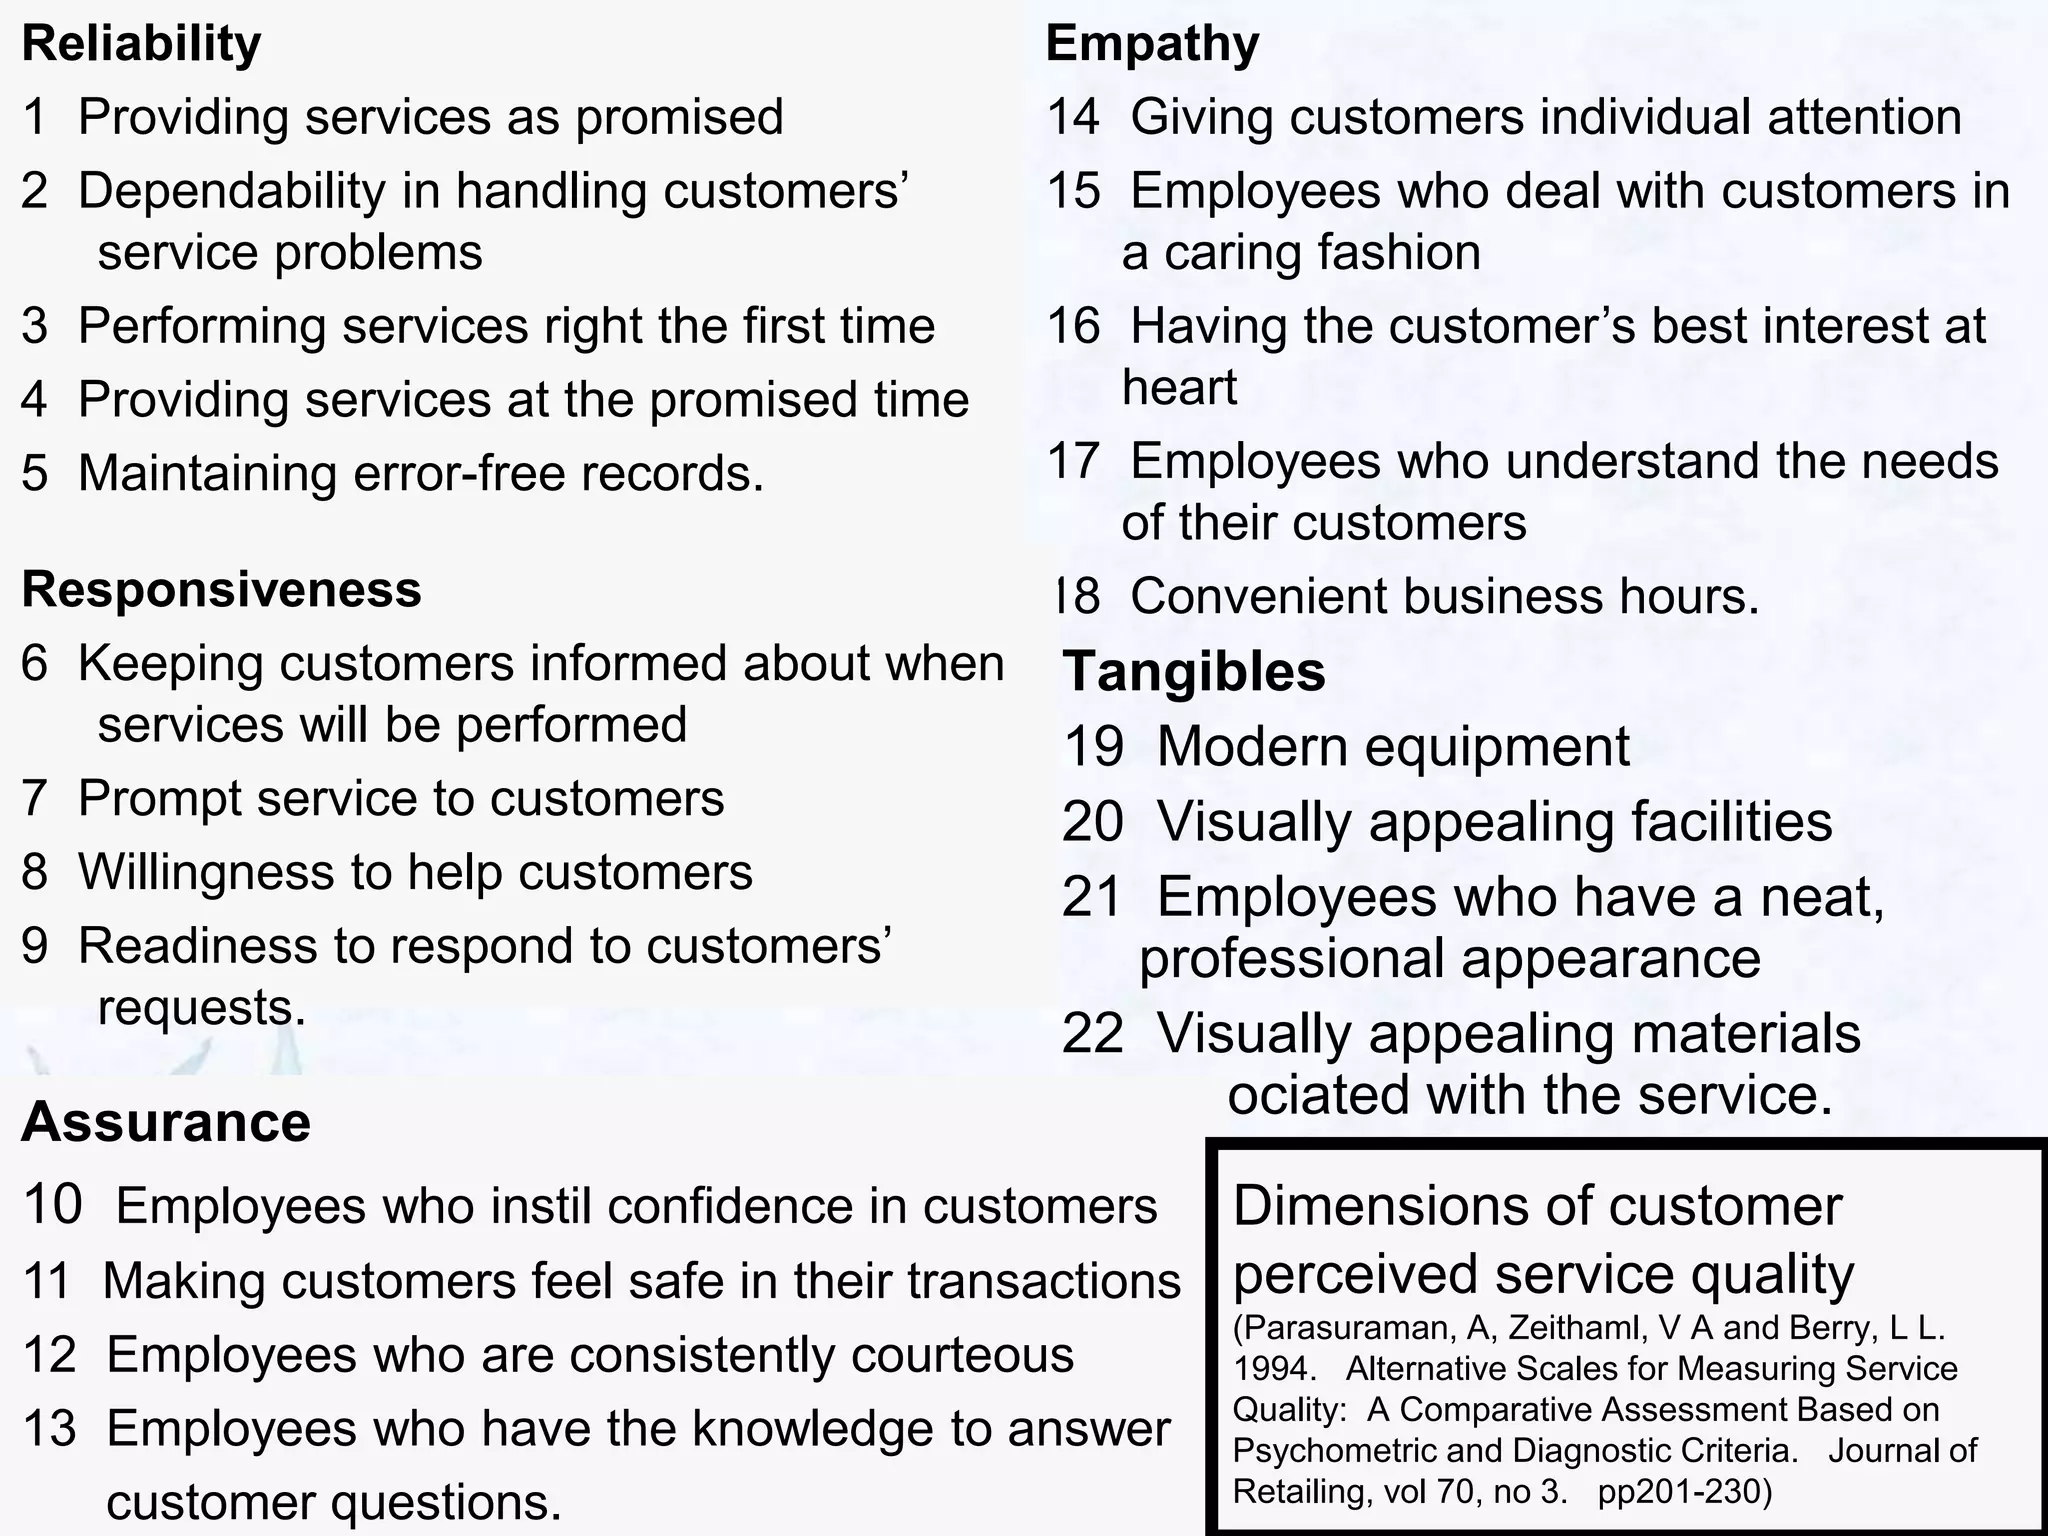
Service Quality
Aijaz Ahmed Rather
I.K Gujral P.T University
Ever wonder what 99.9% meant?
Is a goal of 99.9% good enough?
•1 hour of unsafe drinking water every month
•2 unsafe plane landings per day at O’Hare
Airport in Chicago
•16,000 pieces of mail lost by the U.S. Post
Office every hour.
•20,000 incorrect prescriptions every year
•500 incorrect operations each week
•22,000 cheques deducted from the
wrong bank account each hour
•32,000 missed heart beats per person
each year
Ever wonder what 99.9% meant?
Determinants of Service
Quality?
• The word quality means different
things to different people:
– Credibility
– Security
– Access
– Communication
– Understanding the customer
– Tangibles
– Reliability
– Responsiveness
– Competence
– Courtesy
Source: Valarie A.Zeithaaml, A. Parsuram and
Ten Components of Service Quality
Reliability
Responsiveness
Tangibles
Security
Credibility
Courtesy
Competence
ASSURANCE
CommunicationAccess
Understanding
the Customer
EMPATHY
Tangibles
19 Modern equipment
20 Visually appealing facilities
21 Employees who have a neat,
professional appearance
22 Visually appealing materials
associated with the service.
Empathy
14 Giving customers individual attention
15 Employees who deal with customers in
a caring fashion
16 Having the customer’s best interest at
heart
17 Employees who understand the needs
of their customers
18 Convenient business hours.
Assurance
10 Employees who instil confidence in customers
11 Making customers feel safe in their transactions
12 Employees who are consistently courteous
13 Employees who have the knowledge to answer
customer questions.
Responsiveness
6 Keeping customers informed about when
services will be performed
7 Prompt service to customers
8 Willingness to help customers
9 Readiness to respond to customers’
requests.
Reliability
1 Providing services as promised
2 Dependability in handling customers’
service problems
3 Performing services right the first time
4 Providing services at the promised time
5 Maintaining error-free records.
Dimensions of customer
perceived service quality
(Parasuraman, A, Zeithaml, V A and Berry, L L.
1994. Alternative Scales for Measuring Service
Quality: A Comparative Assessment Based on
Psychometric and Diagnostic Criteria. Journal of
Retailing, vol 70, no 3. pp201-230)
Service Quality
• Customer needs go on changing. Expectations continue
to increase. Quality level needs to be improved
accordingly.
• Quality in a product or service is not what the supplier puts
in. It is the value the customer perceives.
• Quality in customer service requires awareness of needs,
problems, fears and aspirations of the customer
• It is extremely important to deliver what is promised
– Demand generation is always easier than demand
fulfillment
– Strive to give customers more than what they expect
• Dissatisfied customers like to talk to A real, live,
responsive person who will listen and help them get
satisfaction
Importance of Productivity and
Quality for Service Marketers
Productivity
• Helps to keep costs down
– lower prices to develop market, compete better
– increase margins to permit larger marketing budgets
– raise profits to invest in service innovation
• May impact service experience (must avoid negatives)
• May require customer involvement, cooperation
Quality
• Gain competitive advantage, maintain loyalty
• Increase value (may permit higher margins)
• Improve profits
Perspectives on Service Quality
Transcendental: Quality = excellence. Recognized only through
experience
Quality is precise and measurable
Quality lies in the eyes of the beholder
Quality is conformance to the firm’s developed
specifications
Quality is a trade-off between price and value
Product-Based:
User-Based:
Manufacturing-
Based:
Value-Based:
Definition of Gap Analysis
• Formal means to identify and correct gaps
between desired levels and actual levels of
performance
• Used by organizations to analyze certain
processes of any division of their company
3
Service Gap Analysis
• Expected level of service vs. Actual
level of service provided
• SERVQUAL
- 5 gaps
- 5 dimensions
4
The Gaps Model of Service
Quality
• Customer Gap
• Provider Gaps
• Factors Leading to the Gaps
Expectations and Perceptions
• CUSTOMER EXPECTATIONS
– are what a customer believes should or will
happen
– sources of expectations:
• pricing, advertising, word-of-mouth
communications
• CUSTOMER PERCEPTIONS
– are subjective assessments of actual
service experiences.
The Customer Gap
Expected
Service
Perceived
Service
Customer Gap Components
Customer expectations Customer
perceptions
Gaps Model of Service Quality
• Customer Gap:
– difference between customer expectations
and perceptions
• Provider Gap 1
– not knowing what customers expect
• Provider Gap 2
– not having the right service designs and
standards
• Provider Gap 3
– not delivering to service standards
• Provider Gap 4
COMPANY
Perceived
Service
Expected
Service
CUSTOMER
Customer
Gap
GAP 2
Customer-Driven
Service Designs and
Standards
GAP 4
External
Communications
to Customers
GAP 1
Company Perceptions
of Consumer
Expectations
GAP 3
Service
Delivery
Gaps Model of Service Quality
Company
Perceptions of
Consumer
Expectations
Expected
Service
CUSTOMER
COMPANY
GAP 1
Provider Gap 1
CUSTOMER
COMPANY
GAP 2
Customer-Driven
Service Designs and
Standards
Company
Perceptions of
Consumer
Expectations
Provider Gap 2
CUSTOMER
COMPANY Service Delivery
GAP 3
Customer-Driven
Service Designs and
Standards
Provider Gap 3
Provider Gap 4
CUSTOMER
COMPANY
External
Communications
to CustomersGAP 4
Service Delivery
The Gaps Model
• The key to closing the Customer Gap is
to close Provider Gaps 1-4
 Provider Gap 1: Not knowing what customers expect
 Provider Gap 2: Not selecting the right service designs and standards
 Provider Gap 3: Not delivering to service standards
 Provider Gap 4: Not matching performance to promises
Customer
Expectations
Customer
Perceptions
Key Factors Leading to the
Customer Gap
Customer
Gap
Customer Expectations
Company Perceptions of
Customer Expectations
 Inadequate marketing research orientation
Insufficient marketing research
Research not focused on service quality
Inadequate use of market research
 Lack of upward communication
Lack of interaction between management and customers
Insufficient communication between contact employees and managers
Too many layers between contact personnel and top management
 Insufficient relationship focus
Lack of market segmentation
Focus on transactions rather than relationships
Focus on new customers rather than relationship customers
 Inadequate service recovery
Lack of encouragement to listen to customer complaints
Failure to make amends when things go wrong
No appropriate recovery mechanisms in place for service failures
Key Factors Leading to Provider Gap
1
Gap
1
Customer-Driven Service
Designs and Standards
Management Perceptions of
Customer Expectations
 Poor service design
Unsystematic new service development process
Vague, undefined service designs
Failure to connect service design to service positioning
 Absence of customer-driven standards
Lack of customer-driven service standards
Absence of process management to focus on customer
requirements
Absence of formal process for setting service quality goals
 Inappropriate physical evidence and servicescape
Failure to develop tangibles in line with customer expectations
Servicescape design that does not meet customer and
employee needs
Inadequate maintenance and updating of the servicescape
Key Factors Leading to Provider
Gap 2
Gap
2
Service Delivery
Customer-Driven Service
Designs and Standards
 Deficiencies in human resource policies
Ineffective recruitment
Role ambiguity and role conflict
Poor employee-technology job fit
Inappropriate evaluation and compensation systems
Lack of empowerment, perceived control, and teamwork
 Customers who do not fulfill roles
Customers who lack knowledge of their roles and responsibilities
Customers who negatively impact each other
 Problems with service intermediaries
Channel conflict over objectives and performance
Difficulty controlling quality and consistency
Tension between empowerment and control
 Failure to match supply and demand
Failure to smooth peaks and valleys of demand
Inappropriate customer mix
Overreliance on price to smooth demand
Key Factors Leading to Provider
Gap 3
Gap
3
Service Delivery
 Lack of integrated services marketing communications
Tendency to view each external communication as independent
Not including interactive marketing in communications plan
Absence of strong internal marketing program
 Ineffective management of customer expectations
Absence of customer expectation management through all forms of
communication
Lack of adequate education for customers
 Overpromising
Overpromising in advertising
Overpromising in personal selling
Overpromising through physical evidence cues
 Inadequate horizontal communications
Insufficient communication between sales and operations
Insufficient communication between advertising and operations
Differences in policies and procedures across branches or units
External Communications to
Customers
Key Factors Leading to Provider
Gap 4
Gap
4
Poor
Good
HighLowRelative
Importance
Customer
Perceptions
Relative
strength
Wasted
time
Minor
annoyances
IV I
III
Areas for
improvement
II
Two- dimension Gap Model

Service Quality by Aijaz Aryan

  • 1.
    Service Quality Aijaz AhmedRather I.K Gujral P.T University
  • 2.
    Ever wonder what99.9% meant? Is a goal of 99.9% good enough? •1 hour of unsafe drinking water every month •2 unsafe plane landings per day at O’Hare Airport in Chicago •16,000 pieces of mail lost by the U.S. Post Office every hour.
  • 3.
    •20,000 incorrect prescriptionsevery year •500 incorrect operations each week •22,000 cheques deducted from the wrong bank account each hour •32,000 missed heart beats per person each year Ever wonder what 99.9% meant?
  • 4.
    Determinants of Service Quality? •The word quality means different things to different people: – Credibility – Security – Access – Communication – Understanding the customer – Tangibles – Reliability – Responsiveness – Competence – Courtesy Source: Valarie A.Zeithaaml, A. Parsuram and
  • 5.
    Ten Components ofService Quality Reliability Responsiveness Tangibles Security Credibility Courtesy Competence ASSURANCE CommunicationAccess Understanding the Customer EMPATHY
  • 6.
    Tangibles 19 Modern equipment 20Visually appealing facilities 21 Employees who have a neat, professional appearance 22 Visually appealing materials associated with the service. Empathy 14 Giving customers individual attention 15 Employees who deal with customers in a caring fashion 16 Having the customer’s best interest at heart 17 Employees who understand the needs of their customers 18 Convenient business hours. Assurance 10 Employees who instil confidence in customers 11 Making customers feel safe in their transactions 12 Employees who are consistently courteous 13 Employees who have the knowledge to answer customer questions. Responsiveness 6 Keeping customers informed about when services will be performed 7 Prompt service to customers 8 Willingness to help customers 9 Readiness to respond to customers’ requests. Reliability 1 Providing services as promised 2 Dependability in handling customers’ service problems 3 Performing services right the first time 4 Providing services at the promised time 5 Maintaining error-free records. Dimensions of customer perceived service quality (Parasuraman, A, Zeithaml, V A and Berry, L L. 1994. Alternative Scales for Measuring Service Quality: A Comparative Assessment Based on Psychometric and Diagnostic Criteria. Journal of Retailing, vol 70, no 3. pp201-230)
  • 7.
    Service Quality • Customerneeds go on changing. Expectations continue to increase. Quality level needs to be improved accordingly. • Quality in a product or service is not what the supplier puts in. It is the value the customer perceives. • Quality in customer service requires awareness of needs, problems, fears and aspirations of the customer • It is extremely important to deliver what is promised – Demand generation is always easier than demand fulfillment – Strive to give customers more than what they expect • Dissatisfied customers like to talk to A real, live, responsive person who will listen and help them get satisfaction
  • 8.
    Importance of Productivityand Quality for Service Marketers Productivity • Helps to keep costs down – lower prices to develop market, compete better – increase margins to permit larger marketing budgets – raise profits to invest in service innovation • May impact service experience (must avoid negatives) • May require customer involvement, cooperation Quality • Gain competitive advantage, maintain loyalty • Increase value (may permit higher margins) • Improve profits
  • 9.
    Perspectives on ServiceQuality Transcendental: Quality = excellence. Recognized only through experience Quality is precise and measurable Quality lies in the eyes of the beholder Quality is conformance to the firm’s developed specifications Quality is a trade-off between price and value Product-Based: User-Based: Manufacturing- Based: Value-Based:
  • 10.
    Definition of GapAnalysis • Formal means to identify and correct gaps between desired levels and actual levels of performance • Used by organizations to analyze certain processes of any division of their company 3
  • 11.
    Service Gap Analysis •Expected level of service vs. Actual level of service provided • SERVQUAL - 5 gaps - 5 dimensions 4
  • 12.
    The Gaps Modelof Service Quality • Customer Gap • Provider Gaps • Factors Leading to the Gaps
  • 13.
    Expectations and Perceptions •CUSTOMER EXPECTATIONS – are what a customer believes should or will happen – sources of expectations: • pricing, advertising, word-of-mouth communications • CUSTOMER PERCEPTIONS – are subjective assessments of actual service experiences.
  • 14.
  • 15.
    Customer Gap Components Customerexpectations Customer perceptions
  • 16.
    Gaps Model ofService Quality • Customer Gap: – difference between customer expectations and perceptions • Provider Gap 1 – not knowing what customers expect • Provider Gap 2 – not having the right service designs and standards • Provider Gap 3 – not delivering to service standards • Provider Gap 4
  • 17.
    COMPANY Perceived Service Expected Service CUSTOMER Customer Gap GAP 2 Customer-Driven Service Designsand Standards GAP 4 External Communications to Customers GAP 1 Company Perceptions of Consumer Expectations GAP 3 Service Delivery Gaps Model of Service Quality
  • 18.
  • 19.
    CUSTOMER COMPANY GAP 2 Customer-Driven Service Designsand Standards Company Perceptions of Consumer Expectations Provider Gap 2
  • 20.
    CUSTOMER COMPANY Service Delivery GAP3 Customer-Driven Service Designs and Standards Provider Gap 3
  • 21.
  • 22.
    The Gaps Model •The key to closing the Customer Gap is to close Provider Gaps 1-4
  • 23.
     Provider Gap1: Not knowing what customers expect  Provider Gap 2: Not selecting the right service designs and standards  Provider Gap 3: Not delivering to service standards  Provider Gap 4: Not matching performance to promises Customer Expectations Customer Perceptions Key Factors Leading to the Customer Gap Customer Gap
  • 24.
    Customer Expectations Company Perceptionsof Customer Expectations  Inadequate marketing research orientation Insufficient marketing research Research not focused on service quality Inadequate use of market research  Lack of upward communication Lack of interaction between management and customers Insufficient communication between contact employees and managers Too many layers between contact personnel and top management  Insufficient relationship focus Lack of market segmentation Focus on transactions rather than relationships Focus on new customers rather than relationship customers  Inadequate service recovery Lack of encouragement to listen to customer complaints Failure to make amends when things go wrong No appropriate recovery mechanisms in place for service failures Key Factors Leading to Provider Gap 1 Gap 1
  • 25.
    Customer-Driven Service Designs andStandards Management Perceptions of Customer Expectations  Poor service design Unsystematic new service development process Vague, undefined service designs Failure to connect service design to service positioning  Absence of customer-driven standards Lack of customer-driven service standards Absence of process management to focus on customer requirements Absence of formal process for setting service quality goals  Inappropriate physical evidence and servicescape Failure to develop tangibles in line with customer expectations Servicescape design that does not meet customer and employee needs Inadequate maintenance and updating of the servicescape Key Factors Leading to Provider Gap 2 Gap 2
  • 26.
    Service Delivery Customer-Driven Service Designsand Standards  Deficiencies in human resource policies Ineffective recruitment Role ambiguity and role conflict Poor employee-technology job fit Inappropriate evaluation and compensation systems Lack of empowerment, perceived control, and teamwork  Customers who do not fulfill roles Customers who lack knowledge of their roles and responsibilities Customers who negatively impact each other  Problems with service intermediaries Channel conflict over objectives and performance Difficulty controlling quality and consistency Tension between empowerment and control  Failure to match supply and demand Failure to smooth peaks and valleys of demand Inappropriate customer mix Overreliance on price to smooth demand Key Factors Leading to Provider Gap 3 Gap 3
  • 27.
    Service Delivery  Lackof integrated services marketing communications Tendency to view each external communication as independent Not including interactive marketing in communications plan Absence of strong internal marketing program  Ineffective management of customer expectations Absence of customer expectation management through all forms of communication Lack of adequate education for customers  Overpromising Overpromising in advertising Overpromising in personal selling Overpromising through physical evidence cues  Inadequate horizontal communications Insufficient communication between sales and operations Insufficient communication between advertising and operations Differences in policies and procedures across branches or units External Communications to Customers Key Factors Leading to Provider Gap 4 Gap 4
  • 28.