The document presents a study on measuring service quality gaps at UIIC, Durgapur using the SERVQUAL model. Key findings include:
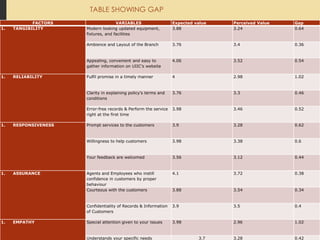
- The maximum gap exists in fulfilling promises in a timely manner and giving special attention to issues. The minimum gap exists in ambience and layout.
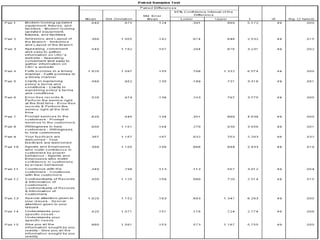
- Paired t-tests found significant differences between expected and perceived service scores for all 22 items, indicating gaps across the five SERVQUAL dimensions.
- The study aims to identify gaps to help UIIC improve service quality and customer satisfaction.