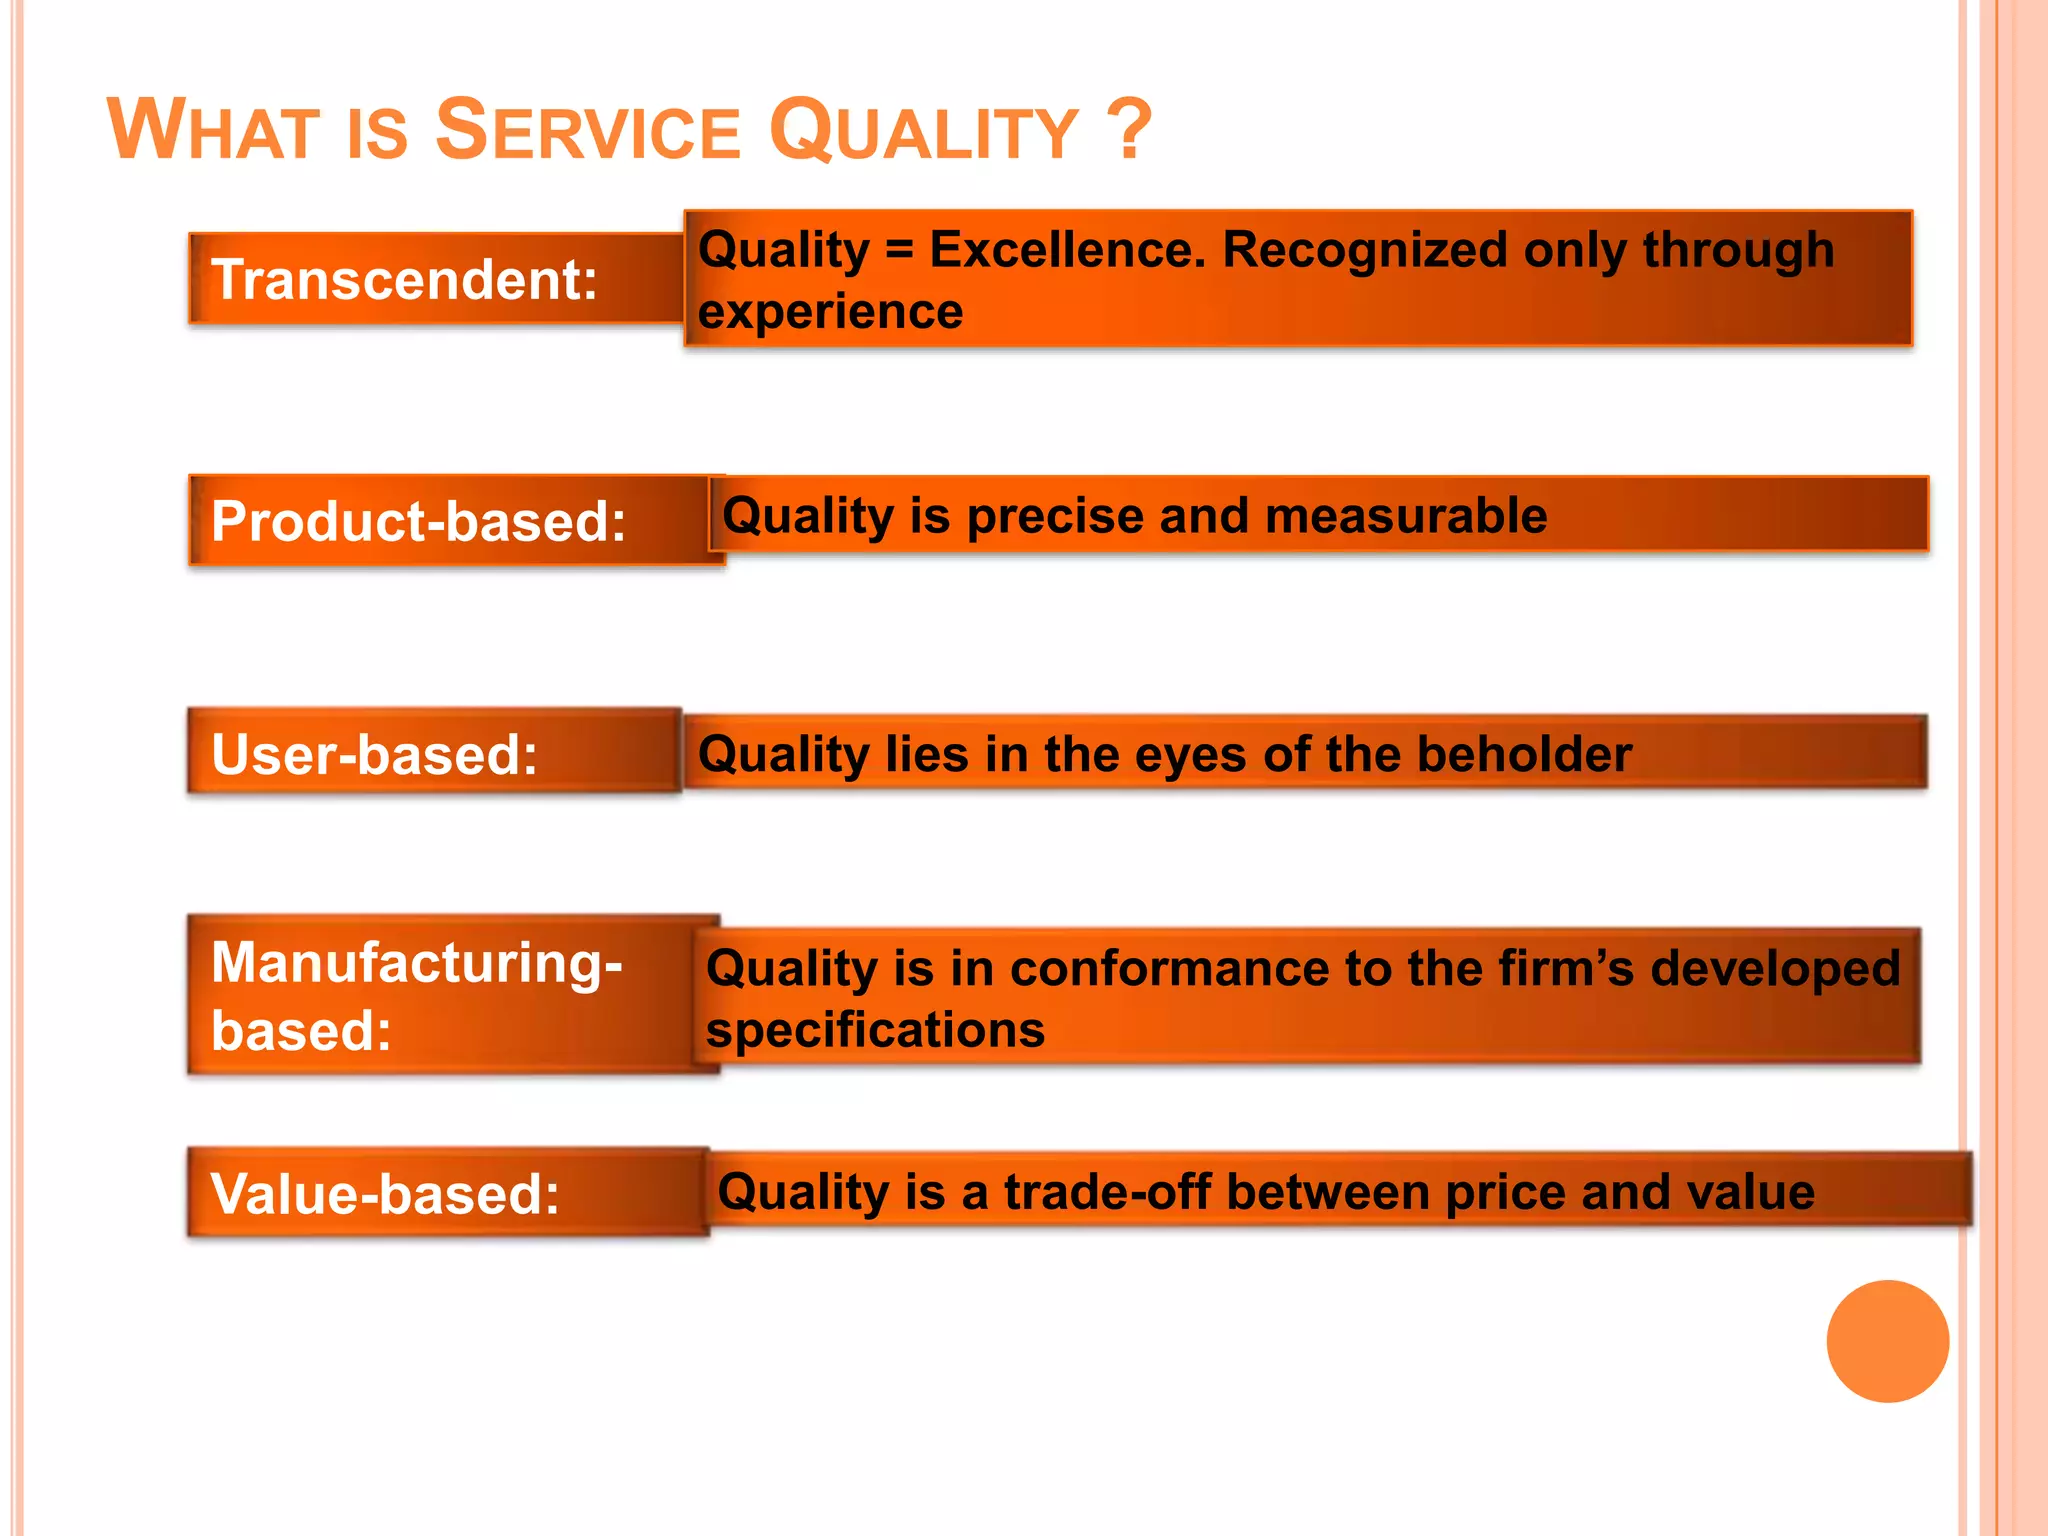
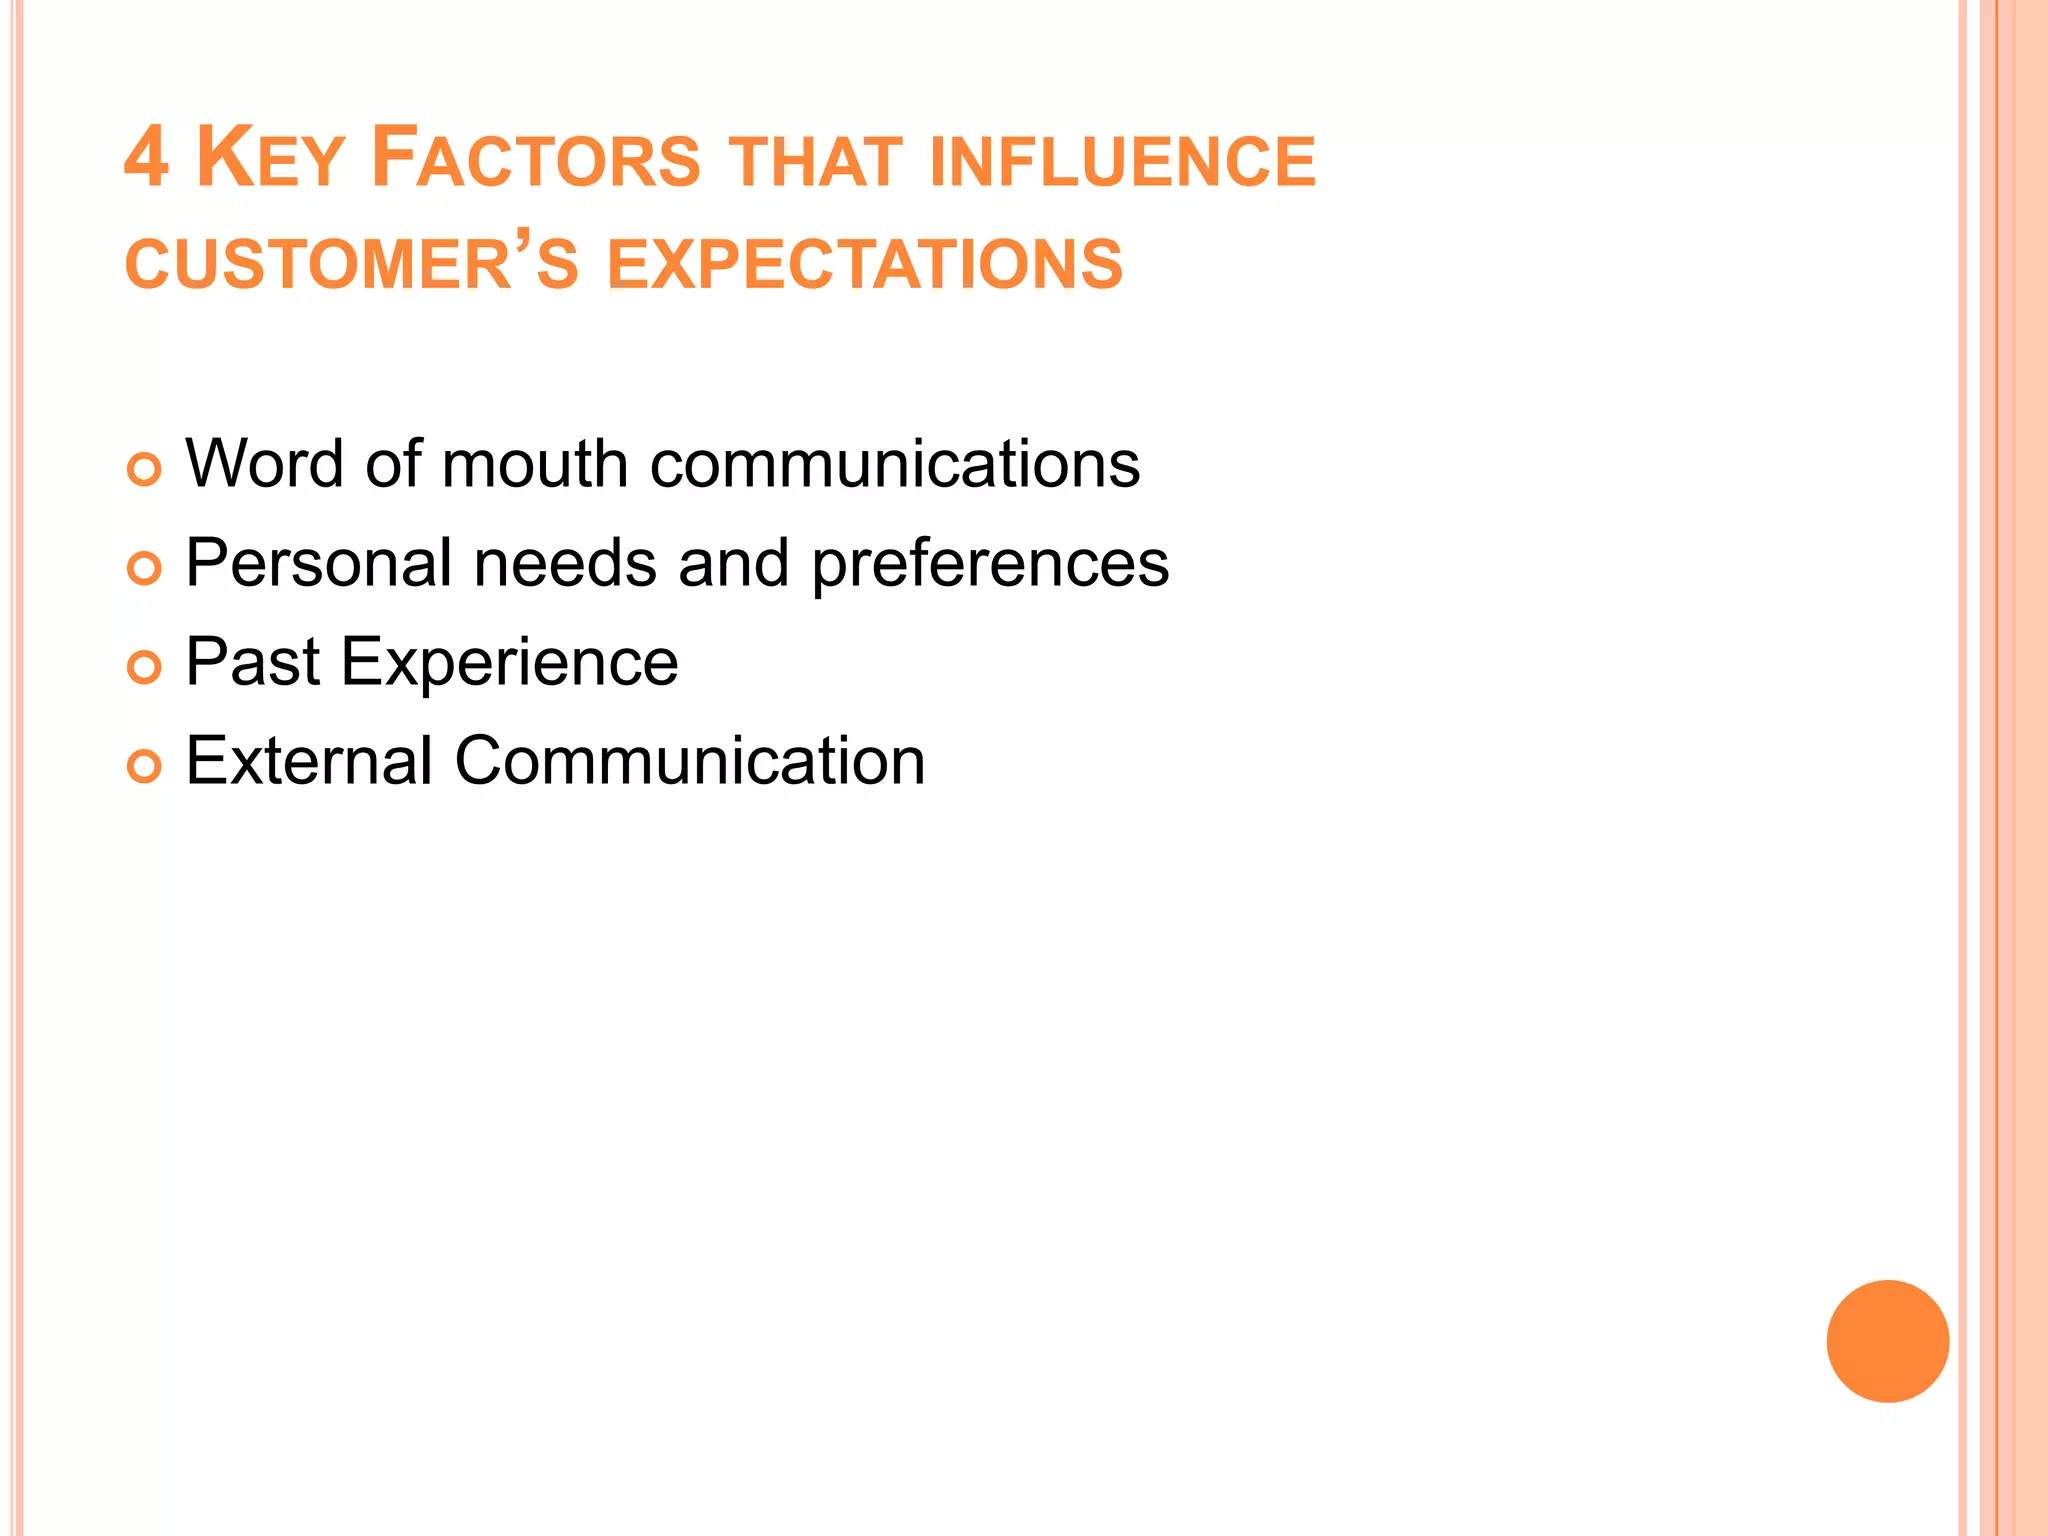
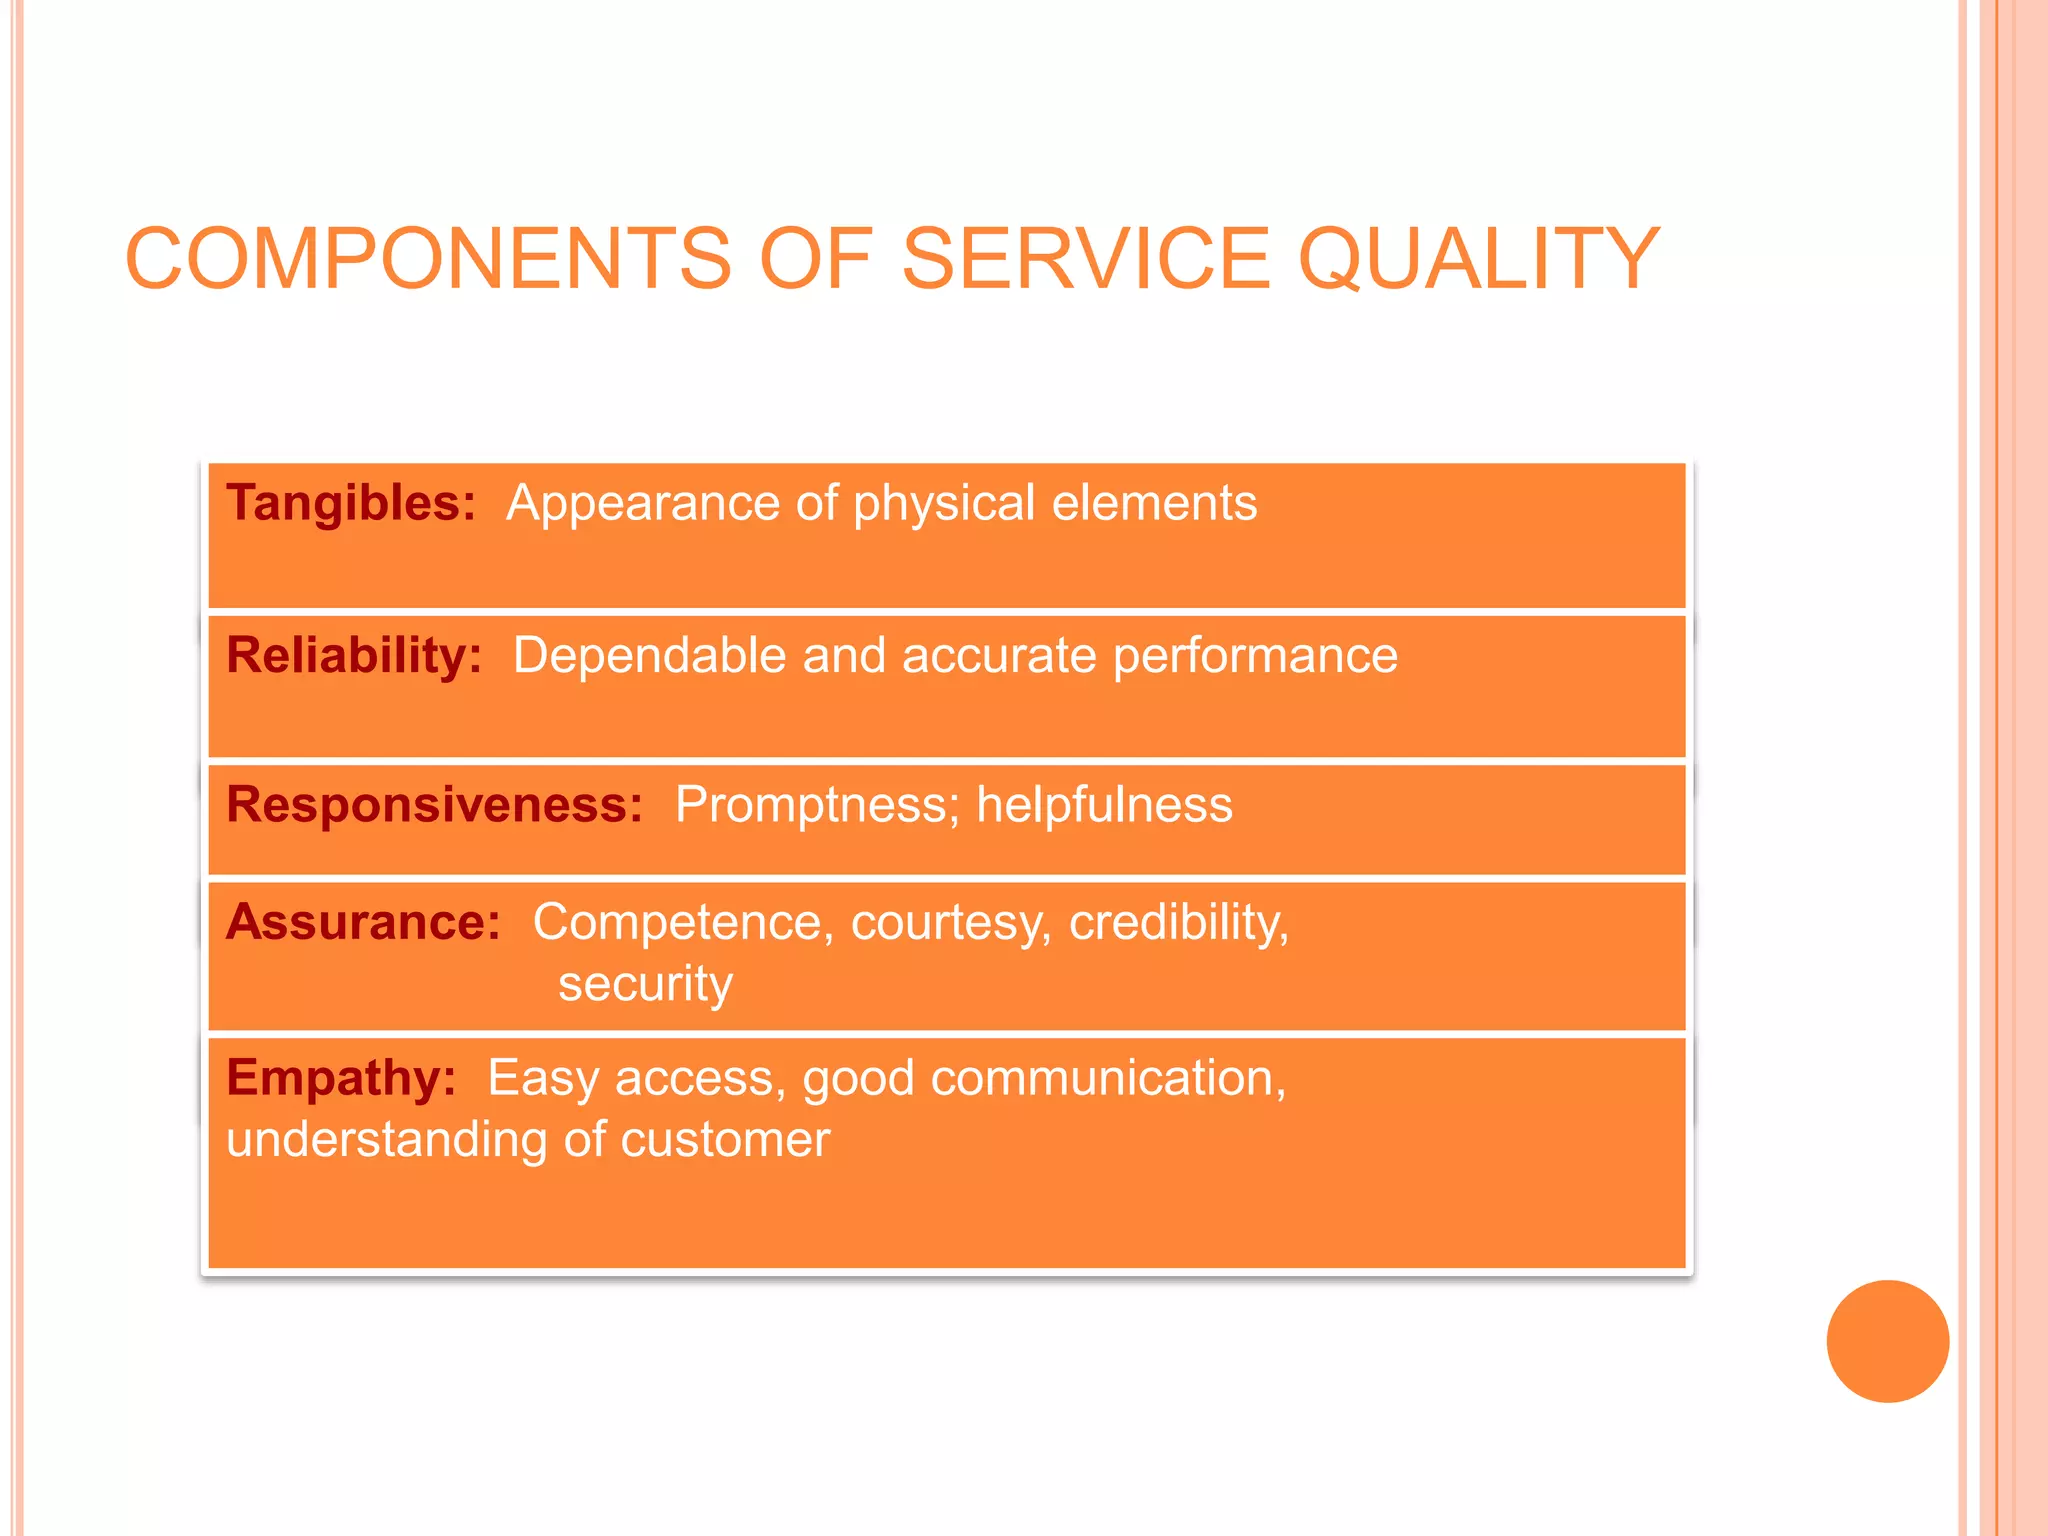
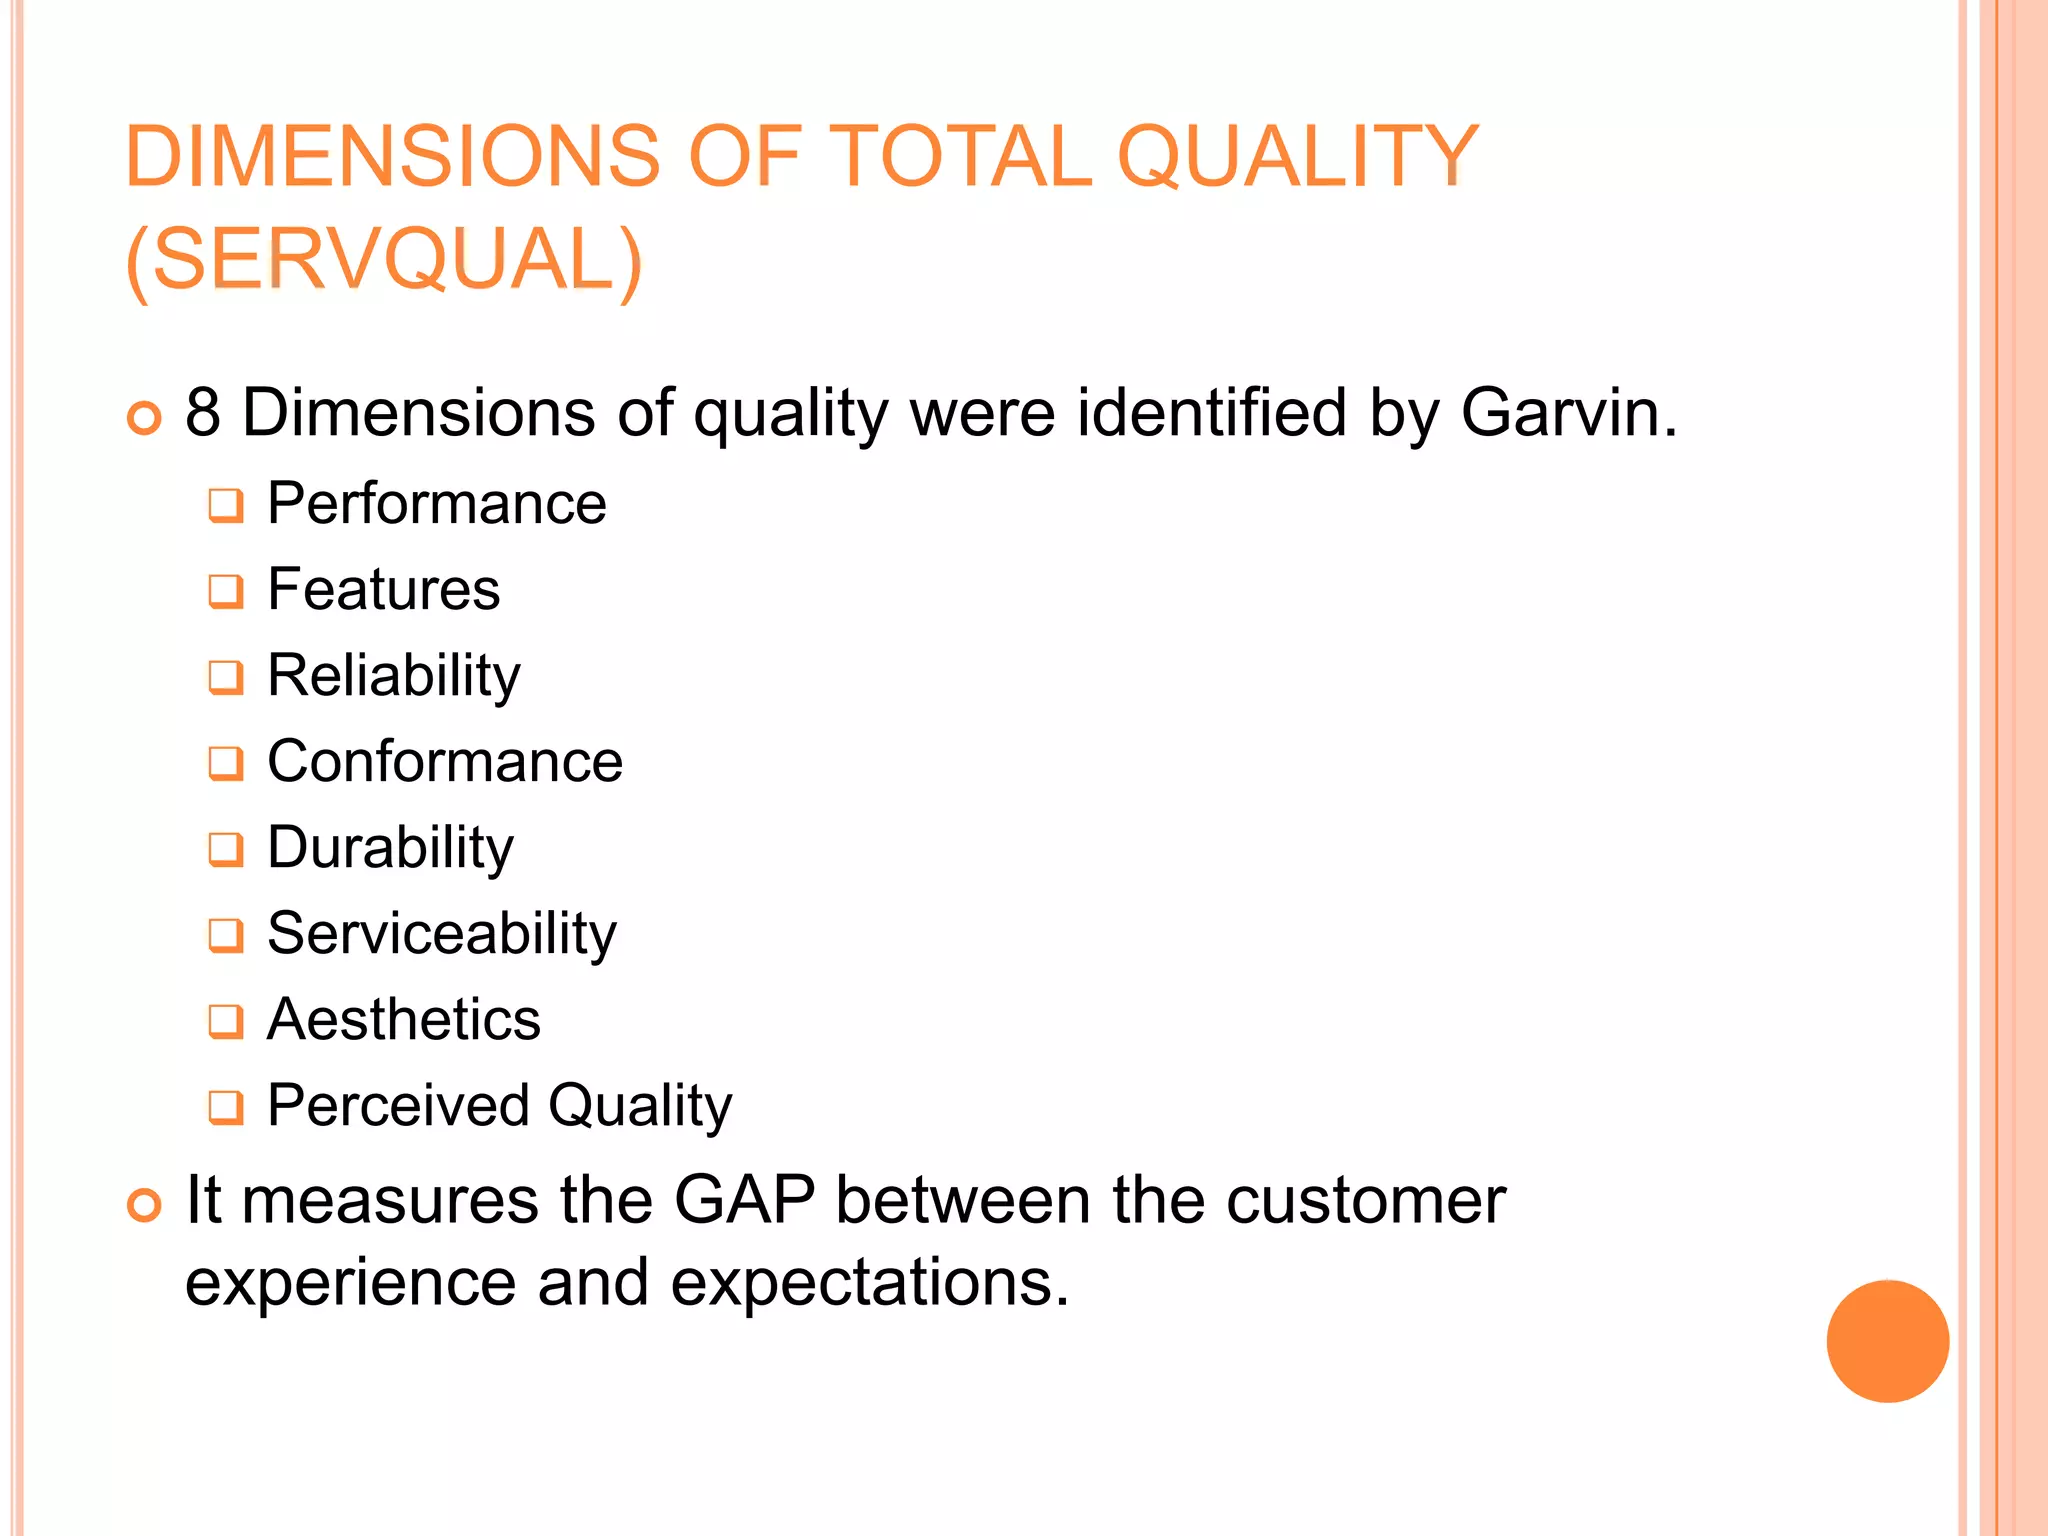
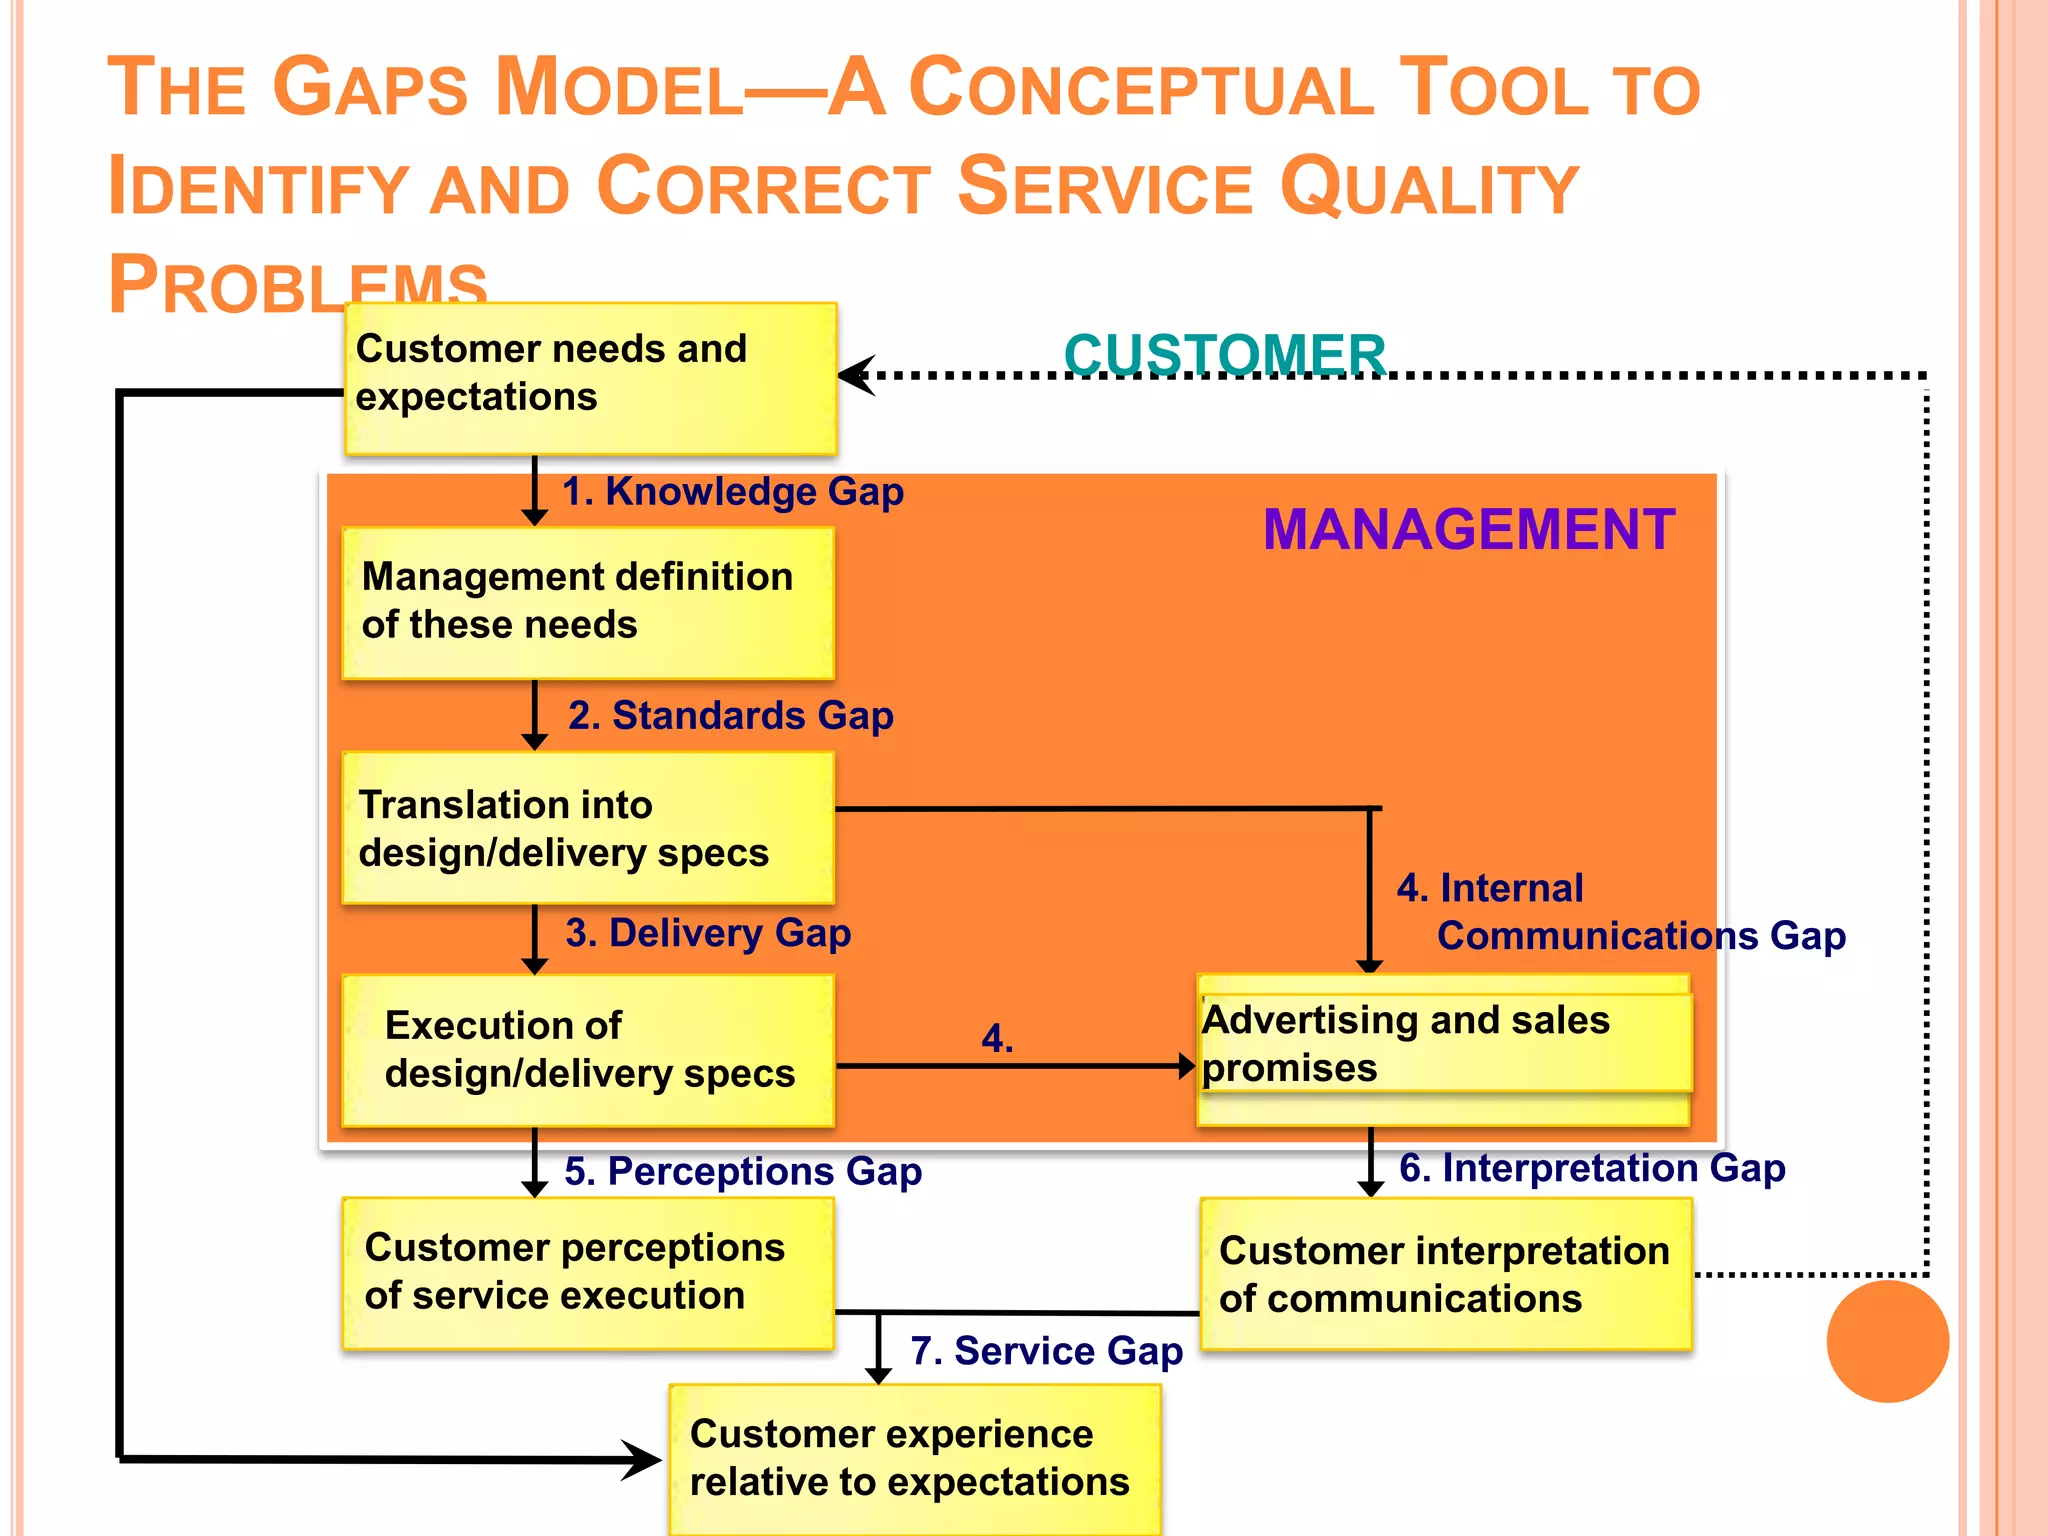
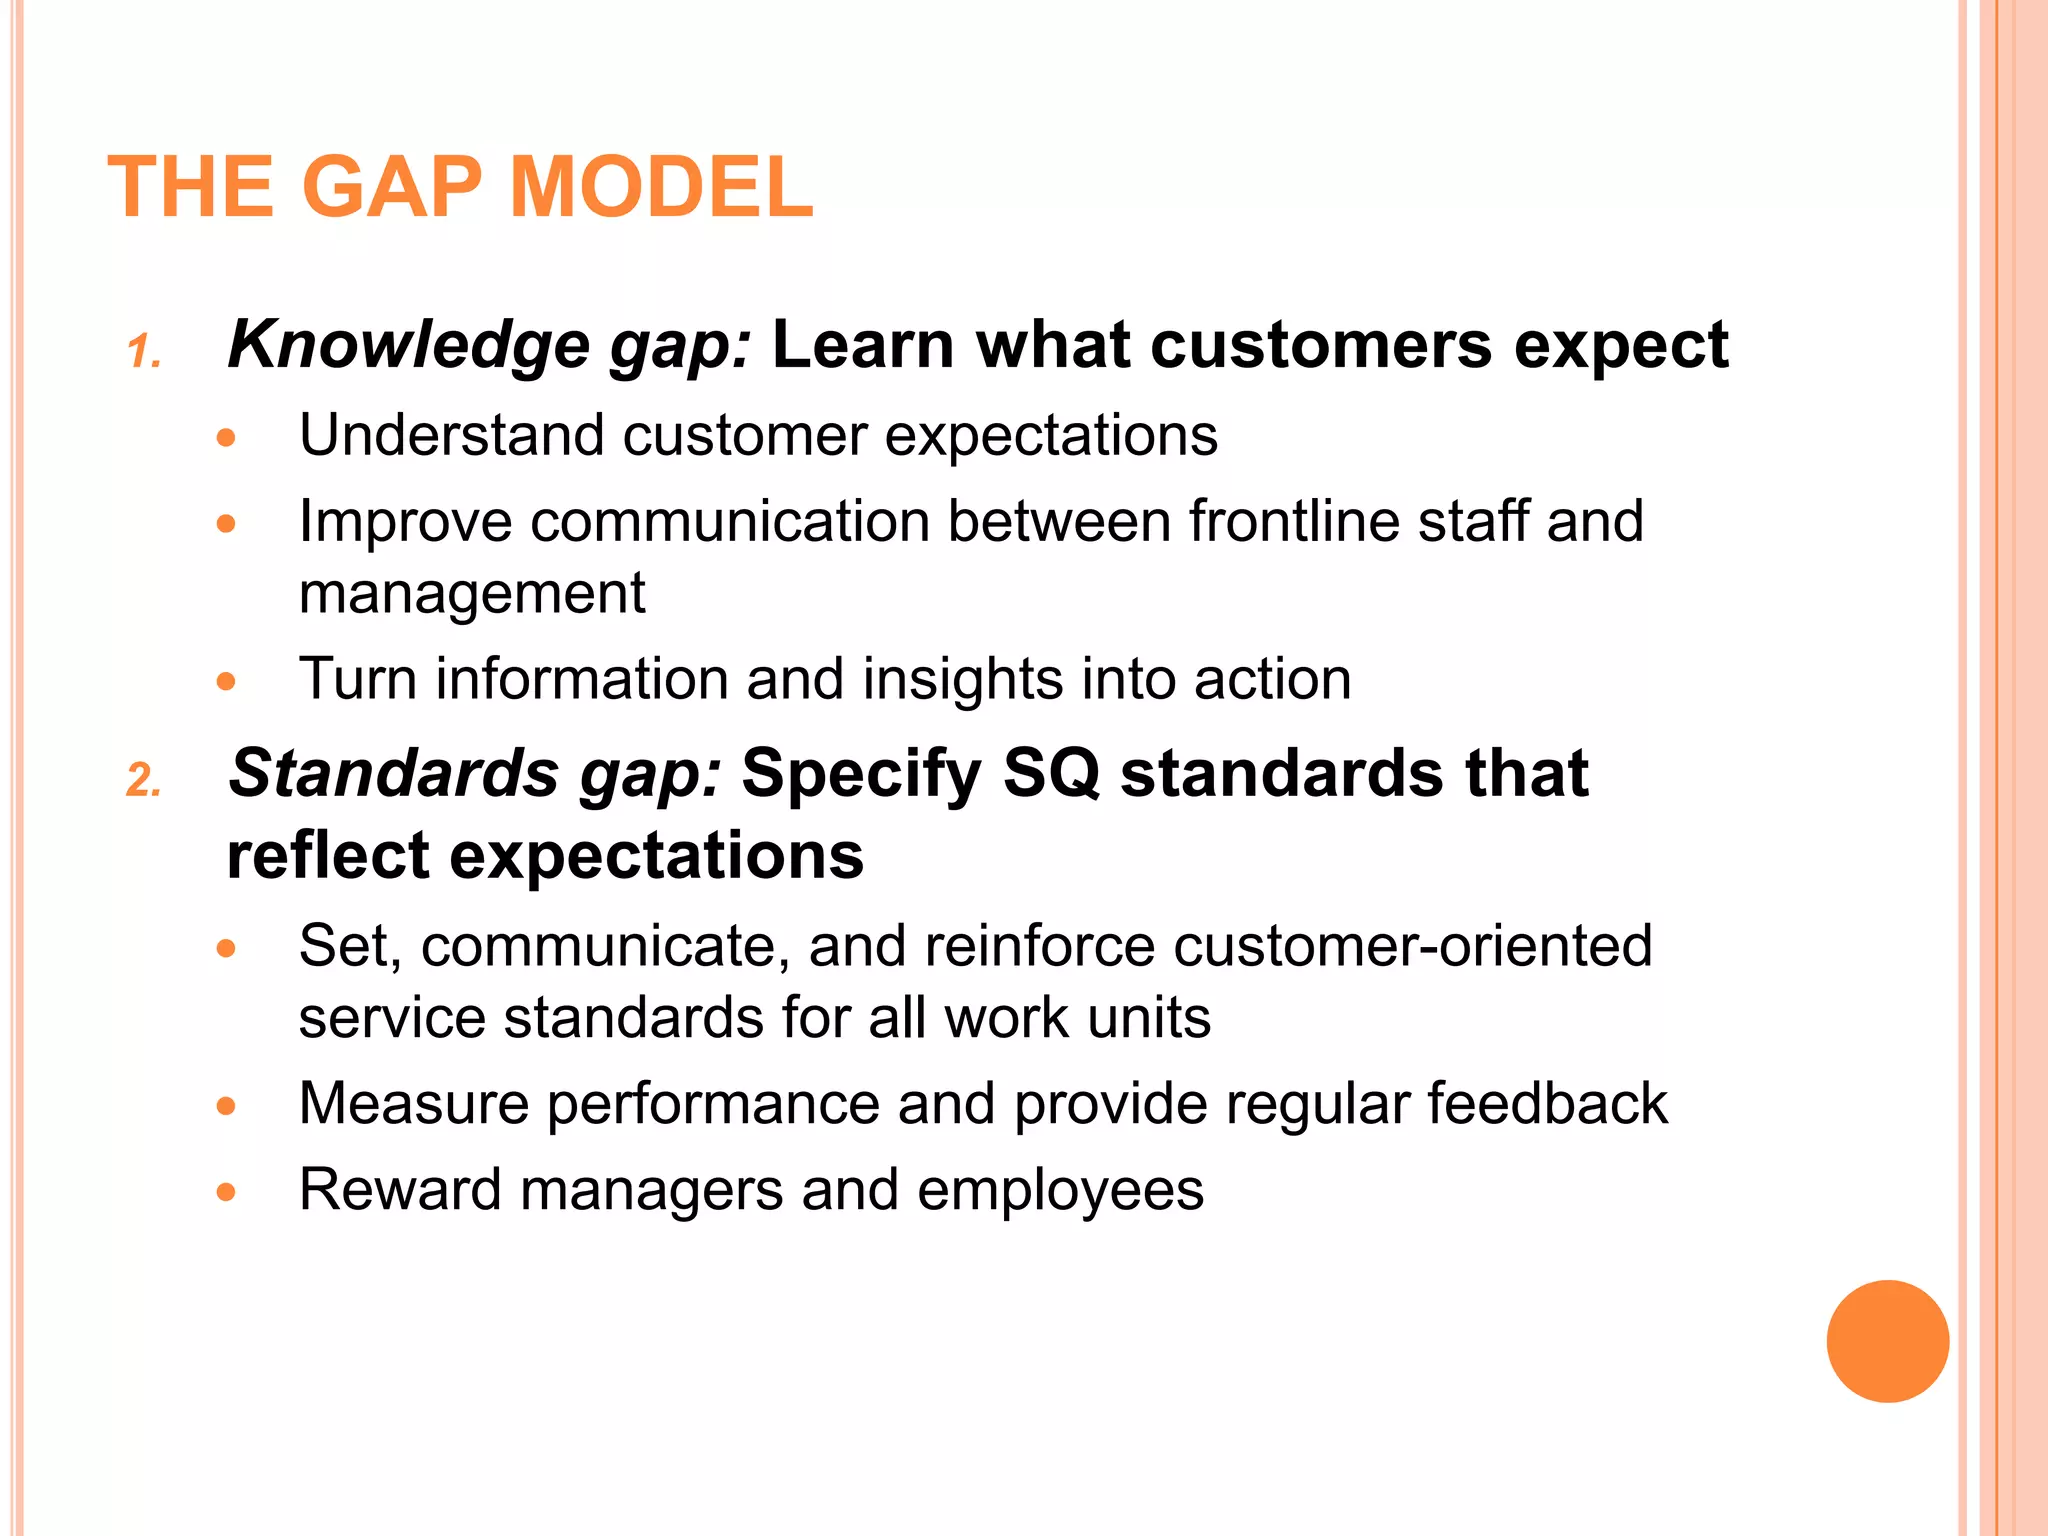
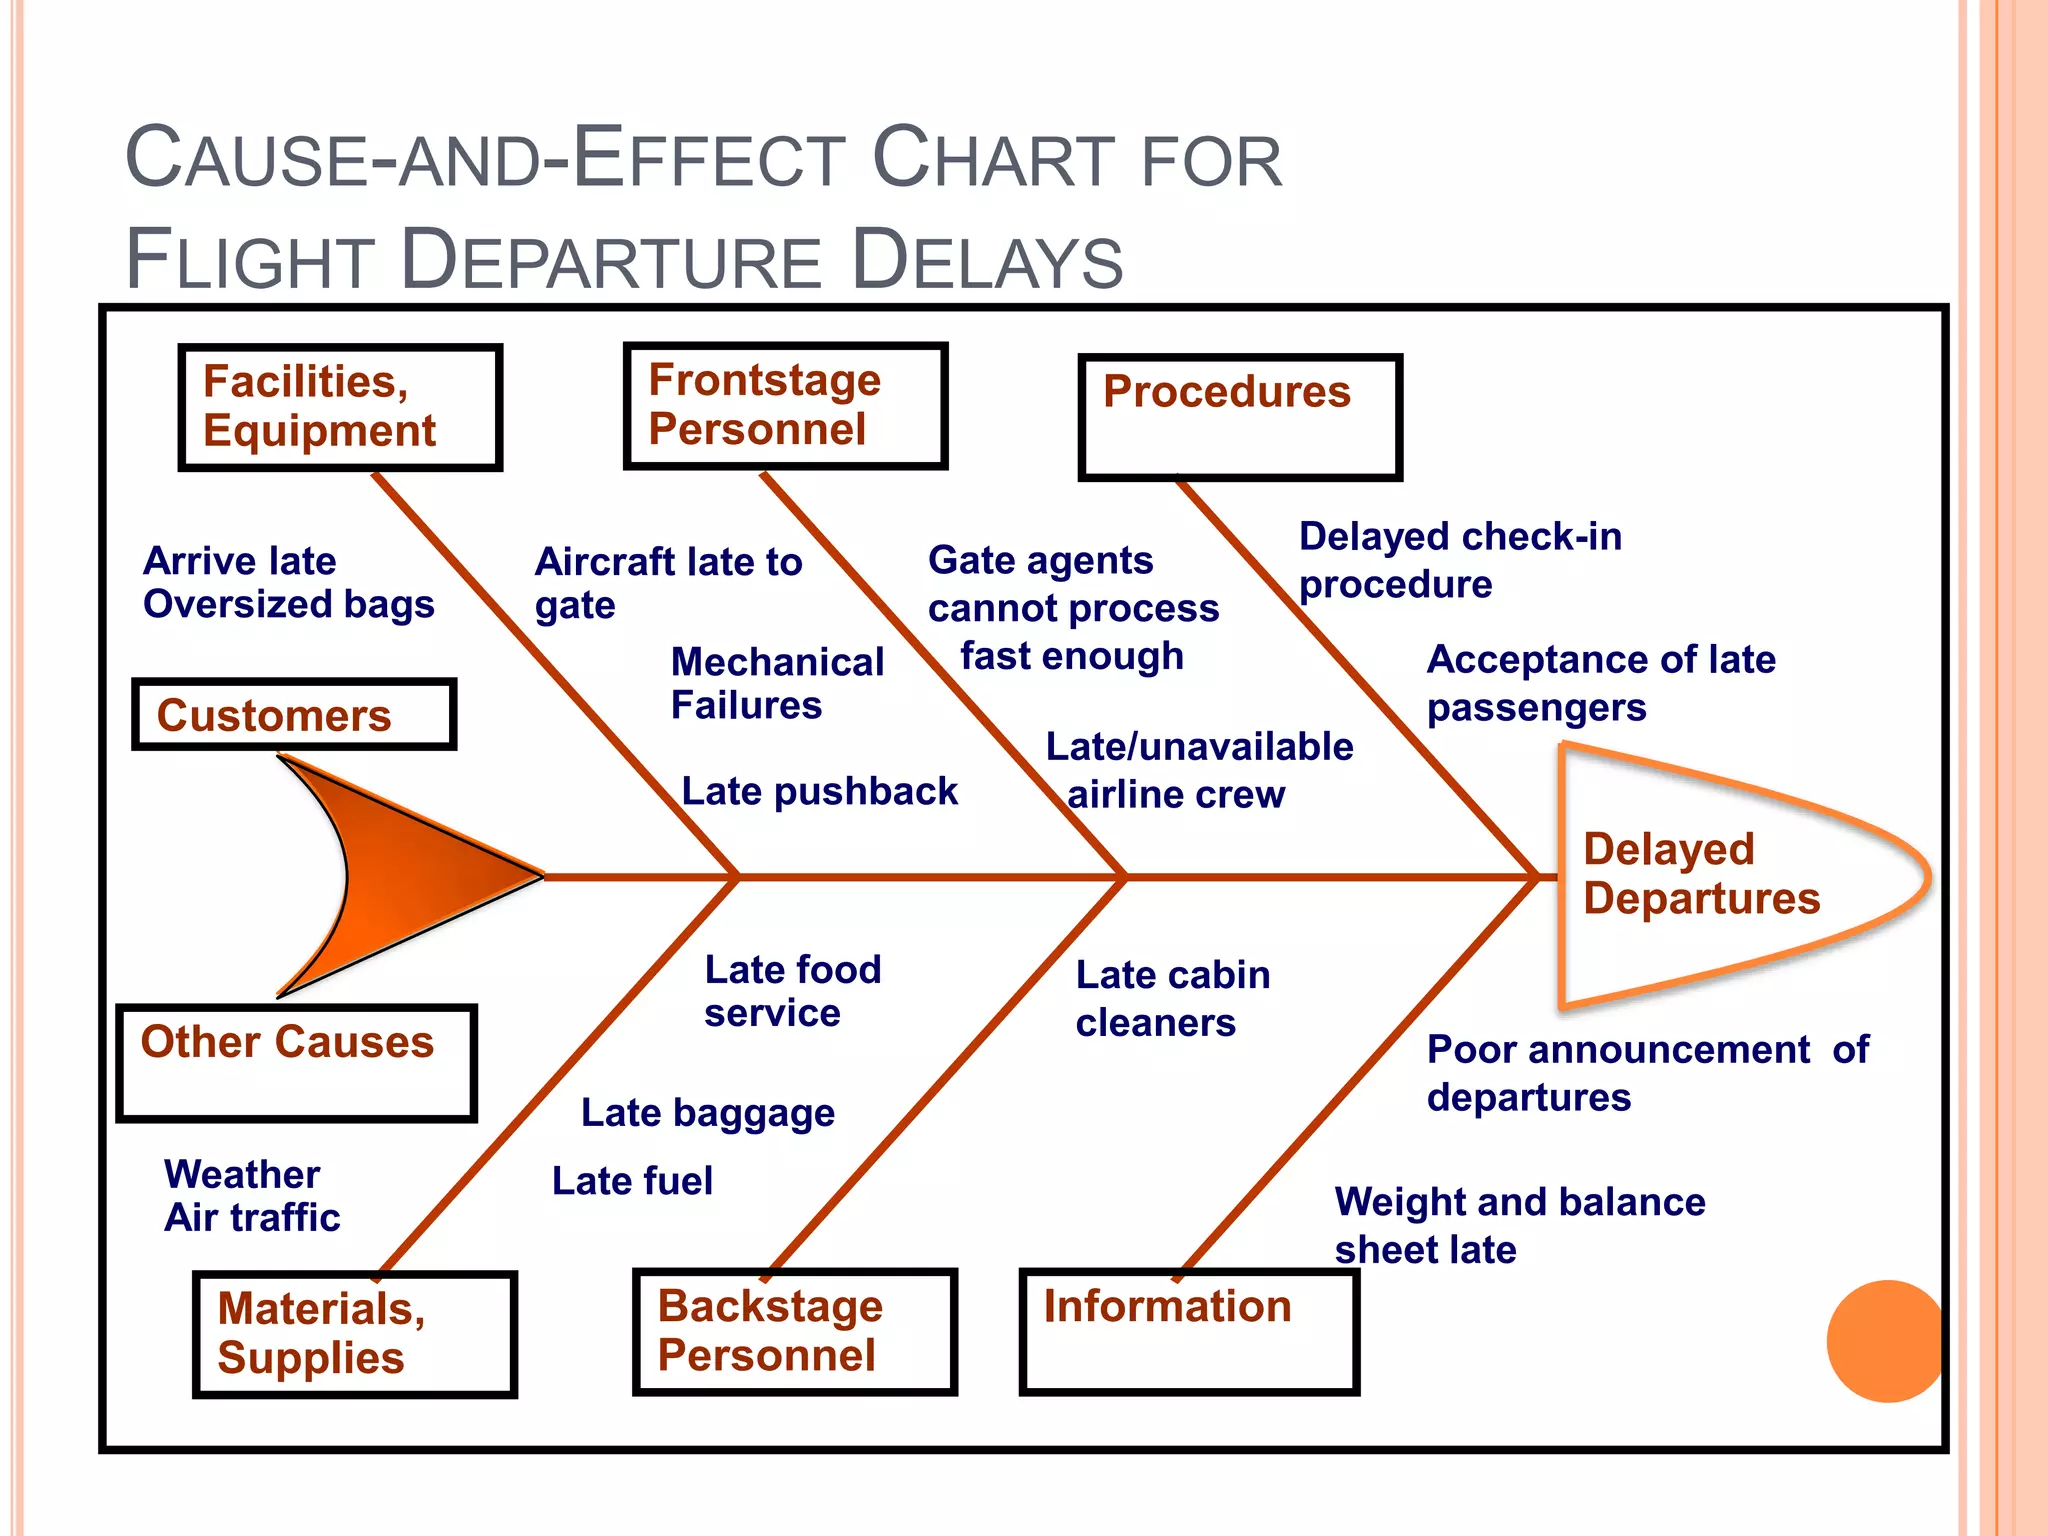
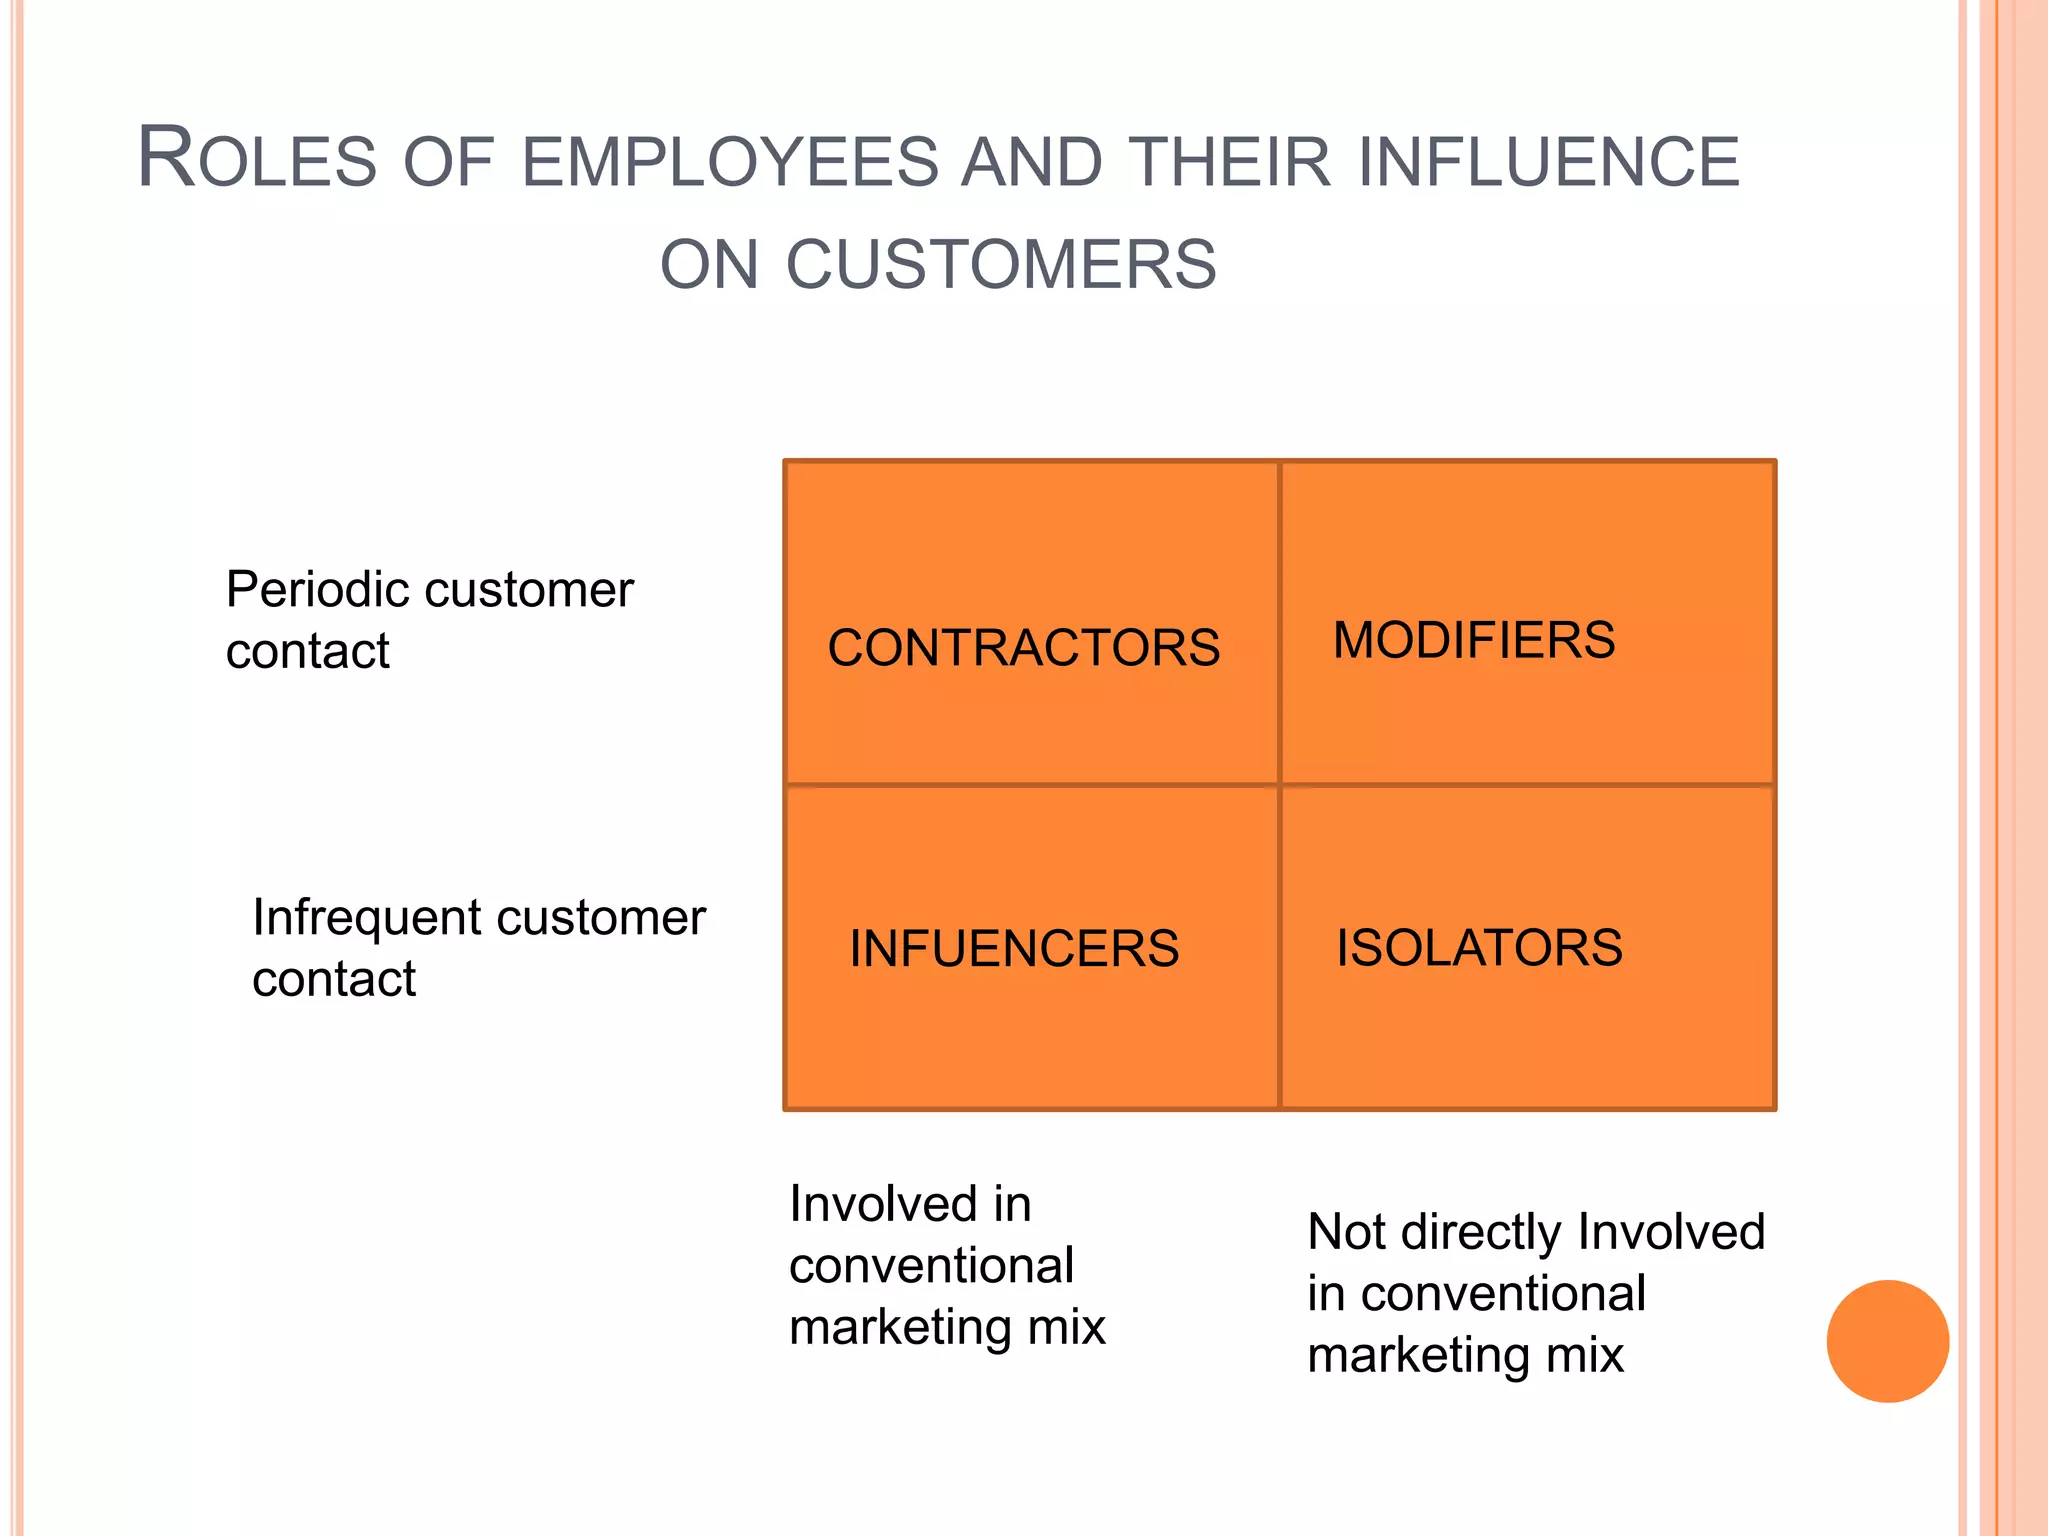
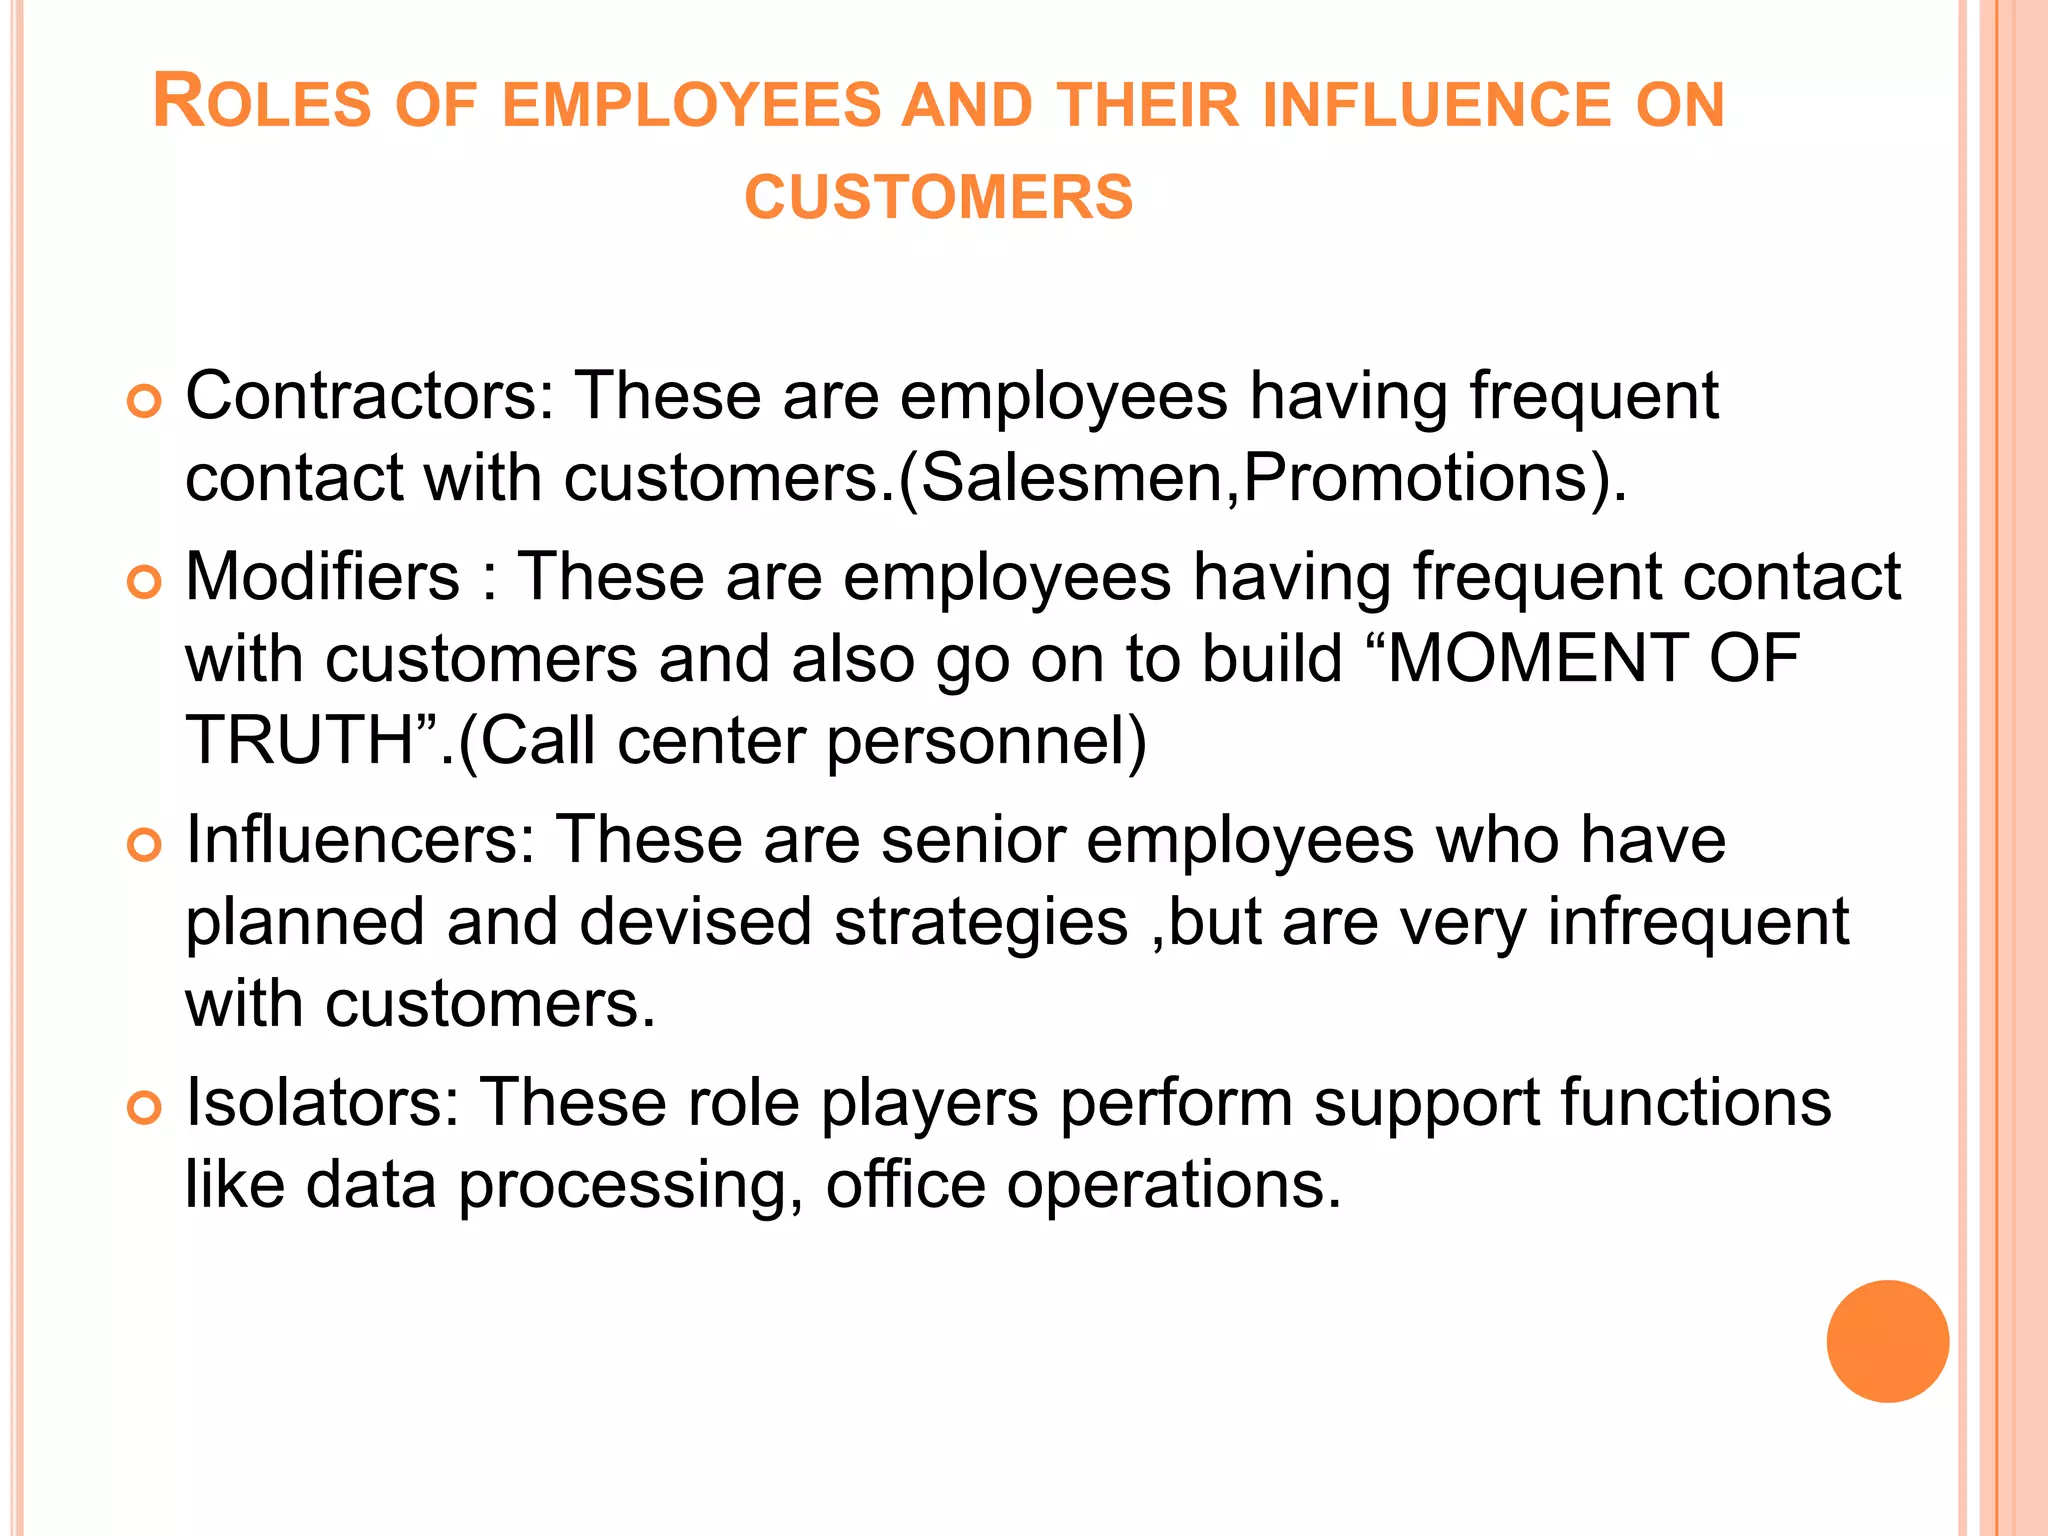
IMPROVING
SERVICE QUALITY
AND
PRODUCTIVITY
Presented By,
Maneesha, Atul
Rajendra
WHAT IS SERVICE QUALITY ?
Product-based:
User-based:
Manufacturing-
based:
Transcendent:
Quality = Excellence. Recognized only through
experience
Quality is precise and measurable
Quality lies in the eyes of the beholder
Quality is in conformance to the firm’s developed
specifications
Value-based: Quality is a trade-off between price and value
4 KEY FACTORS THAT INFLUENCE
CUSTOMER’S EXPECTATIONS
 Word of mouth communications
 Personal needs and preferences
 Past Experience
 External Communication
COMPONENTS OF SERVICE QUALITY
Tangibles: Appearance of physical elements
Reliability: Dependable and accurate performance
Responsiveness: Promptness; helpfulness
Assurance: Competence, courtesy, credibility,
security
Empathy: Easy access, good communication,
understanding of customer
DIMENSIONS OF TOTAL QUALITY
(SERVQUAL)
 8 Dimensions of quality were identified by Garvin.
 Performance
 Features
 Reliability
 Conformance
 Durability
 Serviceability
 Aesthetics
 Perceived Quality
 It measures the GAP between the customer
experience and expectations.
SERVQUAL
 Survey research instrument based on premise that
customers evaluate firm’s service quality by comparing
 Their perceptions of service actually received
 Their prior expectations of companies in a particular industry
 Poor quality
 Perceived performance ratings < expectations
 Good quality
 Perceived performance ratings > expectations
HOW CUSTOMERS MIGHT EVALUATE ONLINE
BUSINESSES: SEVEN DIMENSIONS OF E-S-
QUAL
 Accessibility : Is site easily found?
 Navigation: How easy is it to move around the site?
 Design and presentation: Image projected from site?
 Content and purpose: Substance and richness of site
 Currency and accuracy
 Responsiveness: Firm’s propensity to respond to e-
mails
 Interactivity, customization, and personalization
 Reputation and security
THE GAPS MODEL—A CONCEPTUAL TOOL TO
IDENTIFY AND CORRECT SERVICE QUALITY
PROBLEMS
Customer experience
relative to expectations
1. Knowledge Gap
2. Standards Gap
3. Delivery Gap
5. Perceptions Gap
7. Service Gap
Customer needs and
expectations
6. Interpretation Gap
4. Internal
Communications Gap
MANAGEMENT
CUSTOMER
4.
Customer perceptions
of service execution
Management definition
of these needs
Translation into
design/delivery specs
Execution of
design/delivery specs
Advertising and sales
promises
Customer interpretation
of communications
THE GAP MODEL
1. Knowledge gap: Learn what customers expect
 Understand customer expectations
 Improve communication between frontline staff and
management
 Turn information and insights into action
2. Standards gap: Specify SQ standards that
reflect expectations
 Set, communicate, and reinforce customer-oriented
service standards for all work units
 Measure performance and provide regular feedback
 Reward managers and employees
THE GAP MODEL
3. Delivery gap: Ensure service performance meets
standards
 Clarify employee roles
 Train employees in priority setting and time management
 Eliminate role conflict among employees
 Develop good reward system
4. Internal communications gap: Ensure that
communications promises are realistic
 Seek comments from frontline employees and operations
personnel about proposed advertising campaigns
 Get sales staff to involve operations staff in meetings with
customers
 Ensure that communications sets realistic customer
expectations
THE GAP MODEL
5. Perceptions gap: Educate customers to see
reality of service quality delivered
 Keep customers informed during service delivery and
debrief after delivery
 Provide physical evidence
6. Interpretation gap: Pretest communications to
make sure message is clear and unambiguous
 Present communication materials to a sample of
customers in advance of publication
7. Service gap: Close gaps 1 to 6 to meet customer
expectations consistently
MEASURING AND IMPROVING
SERVICE QUALITY
 Soft measures—not easily observed, must be collected
by talking to customers, employees, or others
 Provide direction, guidance, and feedback to employees on
ways to achieve customer satisfaction
 Can be quantified by measuring customer perceptions and
beliefs
 For example: SERVQUAL, surveys, and customer advisory panels
 Hard measures—can be counted, timed, or measured
through audits
 Typically operational processes or outcomes
 Standards often set with reference to percentage of
occasions on which a particular measure is achieved
 Control charts are useful for displaying performance over
time against specific quality standards
SOFT MEASURES OF SERVICE QUALITY
 Key customer-centric SQ measures include:
 Total market surveys, annual surveys, transactional
surveys
 Service feedback cards
 Mystery shopping
 Analysis of unsolicited feedback—complaints and
compliments, focus group discussions, and service
reviews
 Ongoing surveys of account holders to determine
satisfaction in terms of broader relationship issues
 Customer advisory panels offer feedback/advice on
performance
 Employee surveys and panels to determine:
 Perceptions of the quality of service delivered to
customers on specific dimensions
 Barriers to better service
 Suggestions for improvement
HARD MEASURES OF SERVICE QUALITY
 Control charts to monitor a single variable
 Offer a simple method of displaying performance over
time against specific quality standards
 Are only good if data on which they are based is
accurate
 Enable easy identification of trends
 Service quality indexes
 Embrace key activities that have an impact on
customers
BLUEPRINTING
 Depicts sequence of front-stage interactions
experienced by customers plus supporting
backstage activities
 Used to identify potential fall points—where failures
are most likely to appear
 Shows how failures at one point may have a ripple
effect later
 Managers can identify points which need urgent
attention
 Important first step in preventing service quality
problems
TOOLS TO ANALYZE AND ADDRESS
SERVICE QUALITY PROBLEMS
 Total Quality Management (TQM)
 ISO 9000
 Comprises requirements, definitions, guidelines, and related
standards to provide an independent assessment and
certification of a firm’s quality management system
 Malcolm Baldrige Model Applied to Services
 To promote best practices in quality management, and
recognizing, and publicizing quality achievements among
U.S. firms
 Six Sigma
 Statistically, only 3.4 defects per million opportunities
(1/294,000)
 Has evolved from defect-reduction approach to an overall
business-improvement approach
TQM IN A SERVICE CONTEXT:
TWELVE CRITICAL DIMENSIONS FOR
IMPLEMENTATION
 Top management commitment and visionary leadership
 Human resource management
 Technical system, including service process design and
process management
 Information and analysis system
 Benchmarking
 Continuous improvement
 Customer focus
 Employee satisfaction
 Union intervention and employee relations
 Social responsibility
 Service scapes
 Service culture
CAUSE-AND-EFFECT CHART FOR
FLIGHT DEPARTURE DELAYS
Aircraft late to
gate
Late food
service
Late fuel
Late cabin
cleaners
Poor announcement of
departures
Weight and balance
sheet late
Delayed
Departures
Delayed check-in
procedure
Acceptance of late
passengers
Front-Stage
Personnel
Procedures
Materials,
Supplies
Customers
Gate agents
cannot process
fast enough
Late/unavailable
airline crew
Arrive late
Oversized bags
Weather
Air traffic
Frontstage
Personnel
Procedures
Materials,
Supplies
Backstage
Personnel
Information
Customers
Other Causes
Mechanical
Failures
Late pushback
Late baggage
Facilities,
Equipment
WHAT IS INTERNAL & EXTERNAL CUSTOMER?
 The external customer is someone who signs a
check, pays our employer, and ultimately makes
our paycheck possible. External customers have
choice, and if they don't like your product or service
they can take their business elsewhere.
 An internal customer or internal service
provider can be anyone in the organization. An
internal customer can be a co-worker, another
department, or a distributor who depends upon us
to provide products or services which in turn are
utilized to create a deliverable for the external
customer. In general, internal customers don't have
a choice.
ROLES OF EMPLOYEES AND THEIR INFLUENCE
ON CUSTOMERS
MODIFIERSCONTRACTORS
ISOLATORSINFUENCERS
Periodic customer
contact
Infrequent customer
contact
Involved in
conventional
marketing mix
Not directly Involved
in conventional
marketing mix
 Contractors: These are employees having frequent
contact with customers.(Salesmen,Promotions).
 Modifiers : These are employees having frequent contact
with customers and also go on to build “MOMENT OF
TRUTH”.(Call center personnel)
 Influencers: These are senior employees who have
planned and devised strategies ,but are very infrequent
with customers.
 Isolators: These role players perform support functions
like data processing, office operations.
ROLES OF EMPLOYEES AND THEIR INFLUENCE ON
CUSTOMERS
DEMAND AND SUPPLY MANAGEMENT
There are 9 different types of demand,
 Rising Demand : This occurs when the service offer
is in the growth stage.(Cellphone Service)
 Falling Demand: This occurs when the service offer
is in the decline stage.(Browsing Centers)
 Zero Demand: The market may have no demand
for that service.(No demand for Foreign language
coaching center in rural villages)
 Full Demand: Demand for service is equal to
supply.
 Overfull Demand: Demand exceeds supply
TYPES OF DEMAND
 Negative Demand: Customers may avoid
consuming a particular service.(Cosmetic Surgery)
 Latent Demand: There lays a deep demand for a
particular service but no service offer exists to
satisfy that demand.(Good Day care centers)
 Seasonal Demand(Hotel accommodation during
New Years in Goa)
 Unwholesome Demand : People tend to lose
interest in that service due to the new ingredients in
the service.
STRATEGIES FOR PRODUCTIVITY
 There are three major ways in which improvement
in productivity can be brought out,
 Improving staff performance through training
 Introducing system and technology
 Reducing service levels
 Customer interactions
 Managing capacity by controlling supply.
THANK YOU

Service quality presentation

  • 1.
  • 2.
    WHAT IS SERVICEQUALITY ? Product-based: User-based: Manufacturing- based: Transcendent: Quality = Excellence. Recognized only through experience Quality is precise and measurable Quality lies in the eyes of the beholder Quality is in conformance to the firm’s developed specifications Value-based: Quality is a trade-off between price and value
  • 3.
    4 KEY FACTORSTHAT INFLUENCE CUSTOMER’S EXPECTATIONS  Word of mouth communications  Personal needs and preferences  Past Experience  External Communication
  • 4.
    COMPONENTS OF SERVICEQUALITY Tangibles: Appearance of physical elements Reliability: Dependable and accurate performance Responsiveness: Promptness; helpfulness Assurance: Competence, courtesy, credibility, security Empathy: Easy access, good communication, understanding of customer
  • 5.
    DIMENSIONS OF TOTALQUALITY (SERVQUAL)  8 Dimensions of quality were identified by Garvin.  Performance  Features  Reliability  Conformance  Durability  Serviceability  Aesthetics  Perceived Quality  It measures the GAP between the customer experience and expectations.
  • 6.
    SERVQUAL  Survey researchinstrument based on premise that customers evaluate firm’s service quality by comparing  Their perceptions of service actually received  Their prior expectations of companies in a particular industry  Poor quality  Perceived performance ratings < expectations  Good quality  Perceived performance ratings > expectations
  • 7.
    HOW CUSTOMERS MIGHTEVALUATE ONLINE BUSINESSES: SEVEN DIMENSIONS OF E-S- QUAL  Accessibility : Is site easily found?  Navigation: How easy is it to move around the site?  Design and presentation: Image projected from site?  Content and purpose: Substance and richness of site  Currency and accuracy  Responsiveness: Firm’s propensity to respond to e- mails  Interactivity, customization, and personalization  Reputation and security
  • 8.
    THE GAPS MODEL—ACONCEPTUAL TOOL TO IDENTIFY AND CORRECT SERVICE QUALITY PROBLEMS Customer experience relative to expectations 1. Knowledge Gap 2. Standards Gap 3. Delivery Gap 5. Perceptions Gap 7. Service Gap Customer needs and expectations 6. Interpretation Gap 4. Internal Communications Gap MANAGEMENT CUSTOMER 4. Customer perceptions of service execution Management definition of these needs Translation into design/delivery specs Execution of design/delivery specs Advertising and sales promises Customer interpretation of communications
  • 9.
    THE GAP MODEL 1.Knowledge gap: Learn what customers expect  Understand customer expectations  Improve communication between frontline staff and management  Turn information and insights into action 2. Standards gap: Specify SQ standards that reflect expectations  Set, communicate, and reinforce customer-oriented service standards for all work units  Measure performance and provide regular feedback  Reward managers and employees
  • 10.
    THE GAP MODEL 3.Delivery gap: Ensure service performance meets standards  Clarify employee roles  Train employees in priority setting and time management  Eliminate role conflict among employees  Develop good reward system 4. Internal communications gap: Ensure that communications promises are realistic  Seek comments from frontline employees and operations personnel about proposed advertising campaigns  Get sales staff to involve operations staff in meetings with customers  Ensure that communications sets realistic customer expectations
  • 11.
    THE GAP MODEL 5.Perceptions gap: Educate customers to see reality of service quality delivered  Keep customers informed during service delivery and debrief after delivery  Provide physical evidence 6. Interpretation gap: Pretest communications to make sure message is clear and unambiguous  Present communication materials to a sample of customers in advance of publication 7. Service gap: Close gaps 1 to 6 to meet customer expectations consistently
  • 12.
    MEASURING AND IMPROVING SERVICEQUALITY  Soft measures—not easily observed, must be collected by talking to customers, employees, or others  Provide direction, guidance, and feedback to employees on ways to achieve customer satisfaction  Can be quantified by measuring customer perceptions and beliefs  For example: SERVQUAL, surveys, and customer advisory panels  Hard measures—can be counted, timed, or measured through audits  Typically operational processes or outcomes  Standards often set with reference to percentage of occasions on which a particular measure is achieved  Control charts are useful for displaying performance over time against specific quality standards
  • 13.
    SOFT MEASURES OFSERVICE QUALITY  Key customer-centric SQ measures include:  Total market surveys, annual surveys, transactional surveys  Service feedback cards  Mystery shopping  Analysis of unsolicited feedback—complaints and compliments, focus group discussions, and service reviews  Ongoing surveys of account holders to determine satisfaction in terms of broader relationship issues  Customer advisory panels offer feedback/advice on performance  Employee surveys and panels to determine:  Perceptions of the quality of service delivered to customers on specific dimensions  Barriers to better service  Suggestions for improvement
  • 14.
    HARD MEASURES OFSERVICE QUALITY  Control charts to monitor a single variable  Offer a simple method of displaying performance over time against specific quality standards  Are only good if data on which they are based is accurate  Enable easy identification of trends  Service quality indexes  Embrace key activities that have an impact on customers
  • 15.
    BLUEPRINTING  Depicts sequenceof front-stage interactions experienced by customers plus supporting backstage activities  Used to identify potential fall points—where failures are most likely to appear  Shows how failures at one point may have a ripple effect later  Managers can identify points which need urgent attention  Important first step in preventing service quality problems
  • 16.
    TOOLS TO ANALYZEAND ADDRESS SERVICE QUALITY PROBLEMS  Total Quality Management (TQM)  ISO 9000  Comprises requirements, definitions, guidelines, and related standards to provide an independent assessment and certification of a firm’s quality management system  Malcolm Baldrige Model Applied to Services  To promote best practices in quality management, and recognizing, and publicizing quality achievements among U.S. firms  Six Sigma  Statistically, only 3.4 defects per million opportunities (1/294,000)  Has evolved from defect-reduction approach to an overall business-improvement approach
  • 17.
    TQM IN ASERVICE CONTEXT: TWELVE CRITICAL DIMENSIONS FOR IMPLEMENTATION  Top management commitment and visionary leadership  Human resource management  Technical system, including service process design and process management  Information and analysis system  Benchmarking  Continuous improvement  Customer focus  Employee satisfaction  Union intervention and employee relations  Social responsibility  Service scapes  Service culture
  • 18.
    CAUSE-AND-EFFECT CHART FOR FLIGHTDEPARTURE DELAYS Aircraft late to gate Late food service Late fuel Late cabin cleaners Poor announcement of departures Weight and balance sheet late Delayed Departures Delayed check-in procedure Acceptance of late passengers Front-Stage Personnel Procedures Materials, Supplies Customers Gate agents cannot process fast enough Late/unavailable airline crew Arrive late Oversized bags Weather Air traffic Frontstage Personnel Procedures Materials, Supplies Backstage Personnel Information Customers Other Causes Mechanical Failures Late pushback Late baggage Facilities, Equipment
  • 19.
    WHAT IS INTERNAL& EXTERNAL CUSTOMER?  The external customer is someone who signs a check, pays our employer, and ultimately makes our paycheck possible. External customers have choice, and if they don't like your product or service they can take their business elsewhere.  An internal customer or internal service provider can be anyone in the organization. An internal customer can be a co-worker, another department, or a distributor who depends upon us to provide products or services which in turn are utilized to create a deliverable for the external customer. In general, internal customers don't have a choice.
  • 20.
    ROLES OF EMPLOYEESAND THEIR INFLUENCE ON CUSTOMERS MODIFIERSCONTRACTORS ISOLATORSINFUENCERS Periodic customer contact Infrequent customer contact Involved in conventional marketing mix Not directly Involved in conventional marketing mix
  • 21.
     Contractors: Theseare employees having frequent contact with customers.(Salesmen,Promotions).  Modifiers : These are employees having frequent contact with customers and also go on to build “MOMENT OF TRUTH”.(Call center personnel)  Influencers: These are senior employees who have planned and devised strategies ,but are very infrequent with customers.  Isolators: These role players perform support functions like data processing, office operations. ROLES OF EMPLOYEES AND THEIR INFLUENCE ON CUSTOMERS
  • 22.
    DEMAND AND SUPPLYMANAGEMENT There are 9 different types of demand,  Rising Demand : This occurs when the service offer is in the growth stage.(Cellphone Service)  Falling Demand: This occurs when the service offer is in the decline stage.(Browsing Centers)  Zero Demand: The market may have no demand for that service.(No demand for Foreign language coaching center in rural villages)  Full Demand: Demand for service is equal to supply.  Overfull Demand: Demand exceeds supply
  • 23.
    TYPES OF DEMAND Negative Demand: Customers may avoid consuming a particular service.(Cosmetic Surgery)  Latent Demand: There lays a deep demand for a particular service but no service offer exists to satisfy that demand.(Good Day care centers)  Seasonal Demand(Hotel accommodation during New Years in Goa)  Unwholesome Demand : People tend to lose interest in that service due to the new ingredients in the service.
  • 24.
    STRATEGIES FOR PRODUCTIVITY There are three major ways in which improvement in productivity can be brought out,  Improving staff performance through training  Introducing system and technology  Reducing service levels  Customer interactions  Managing capacity by controlling supply.
  • 25.