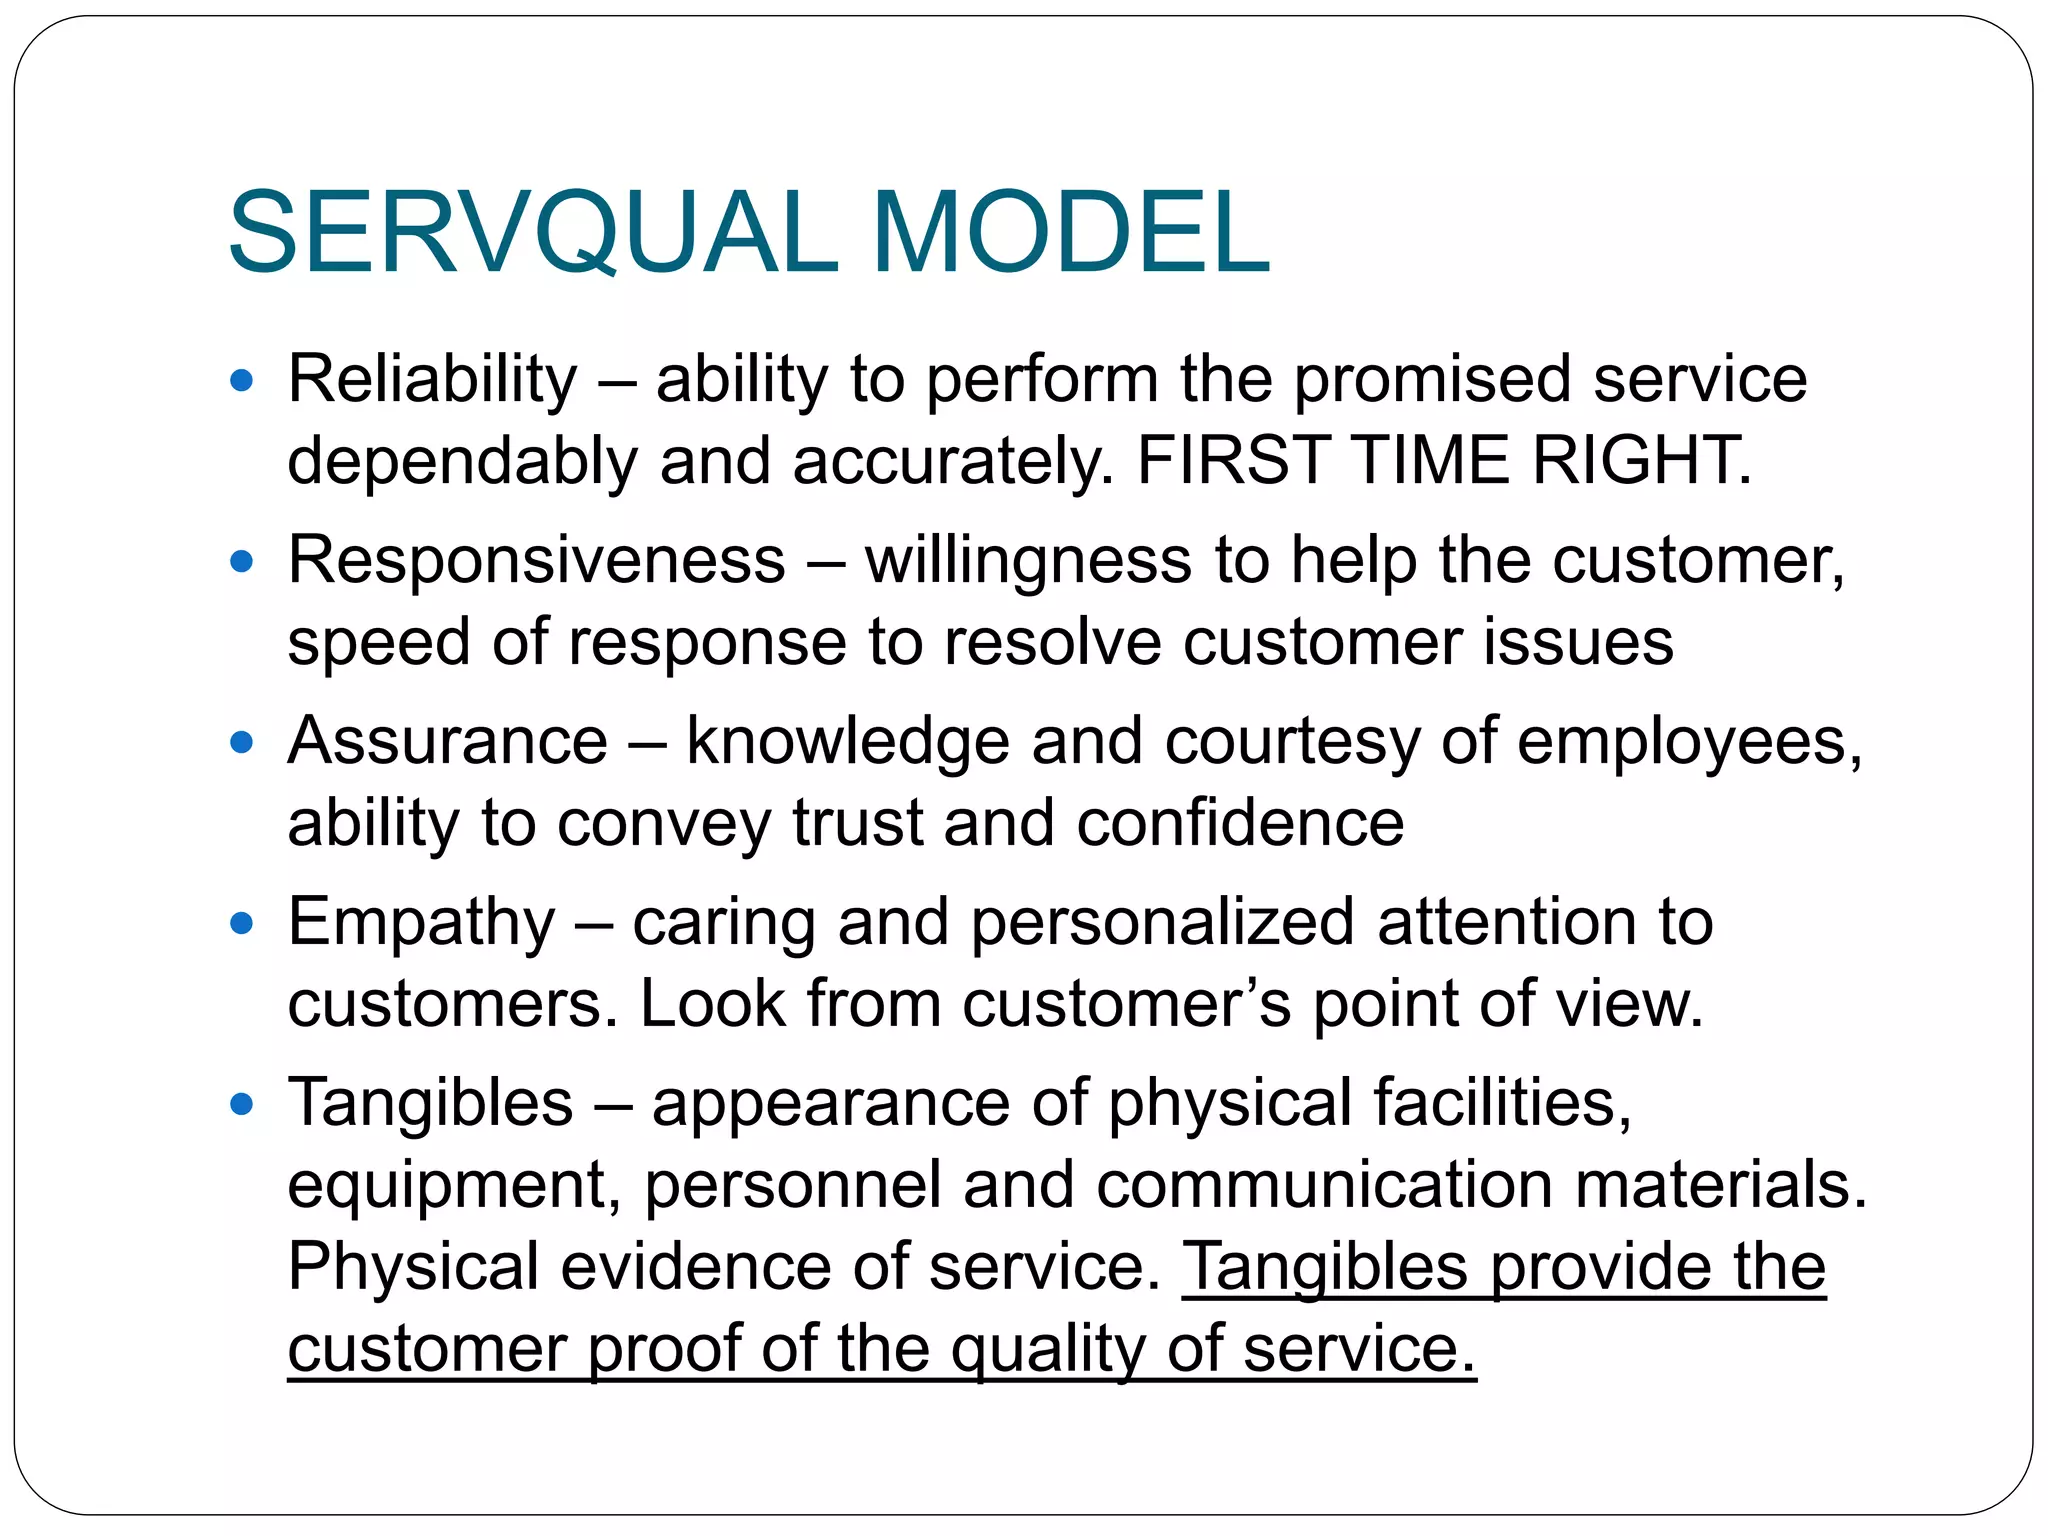
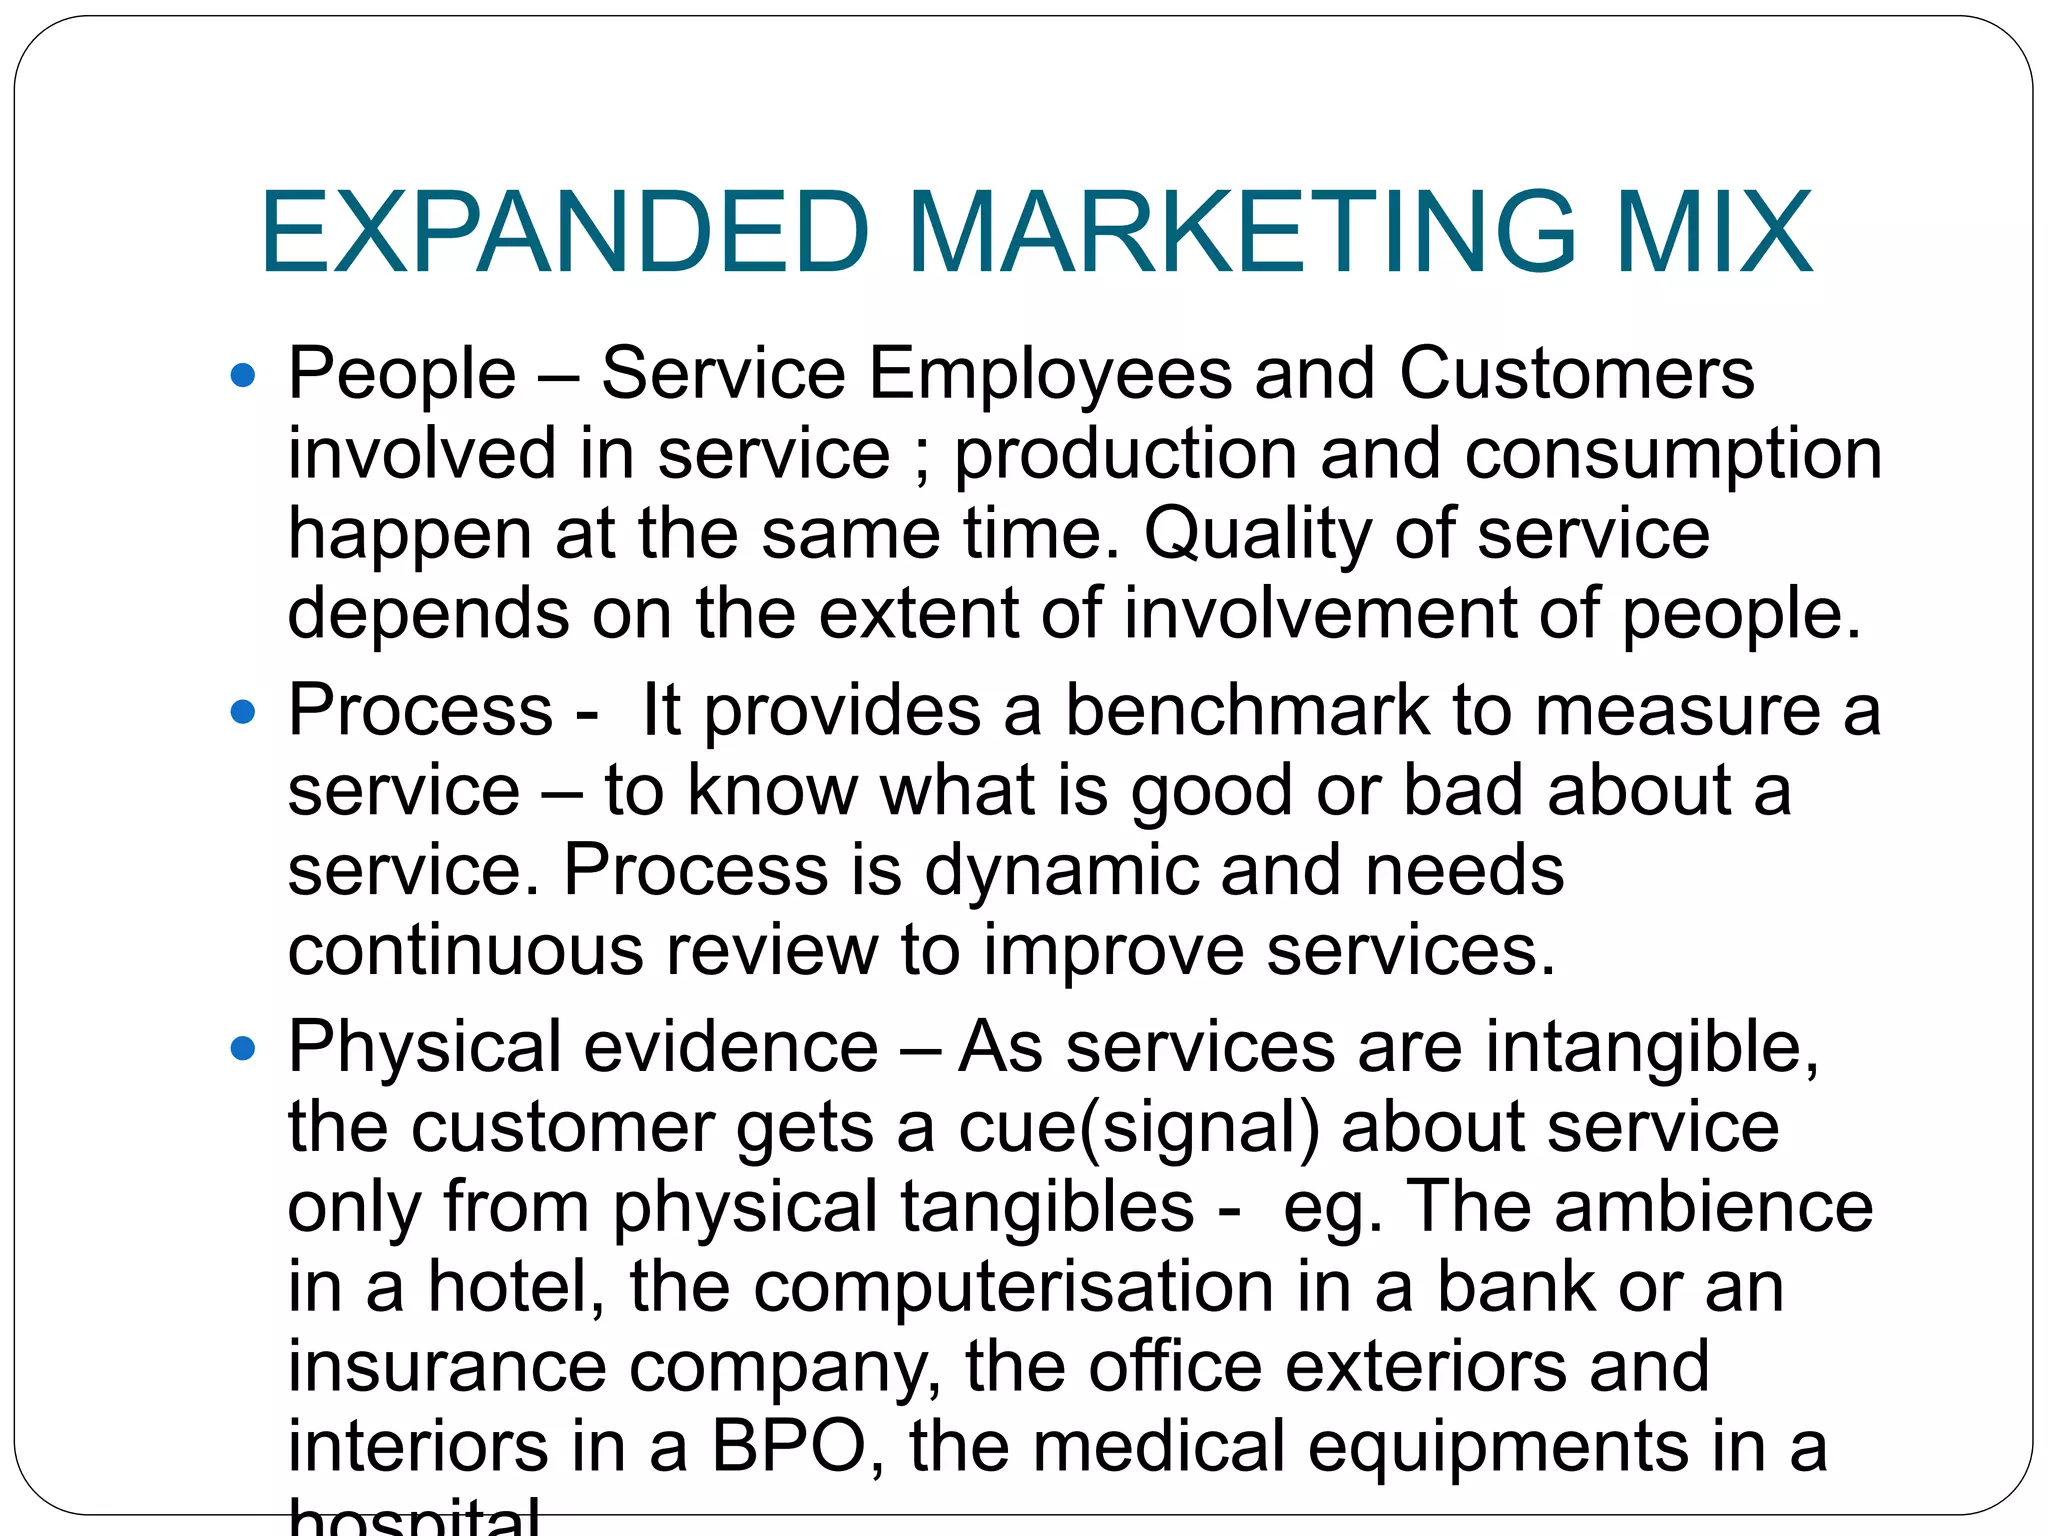
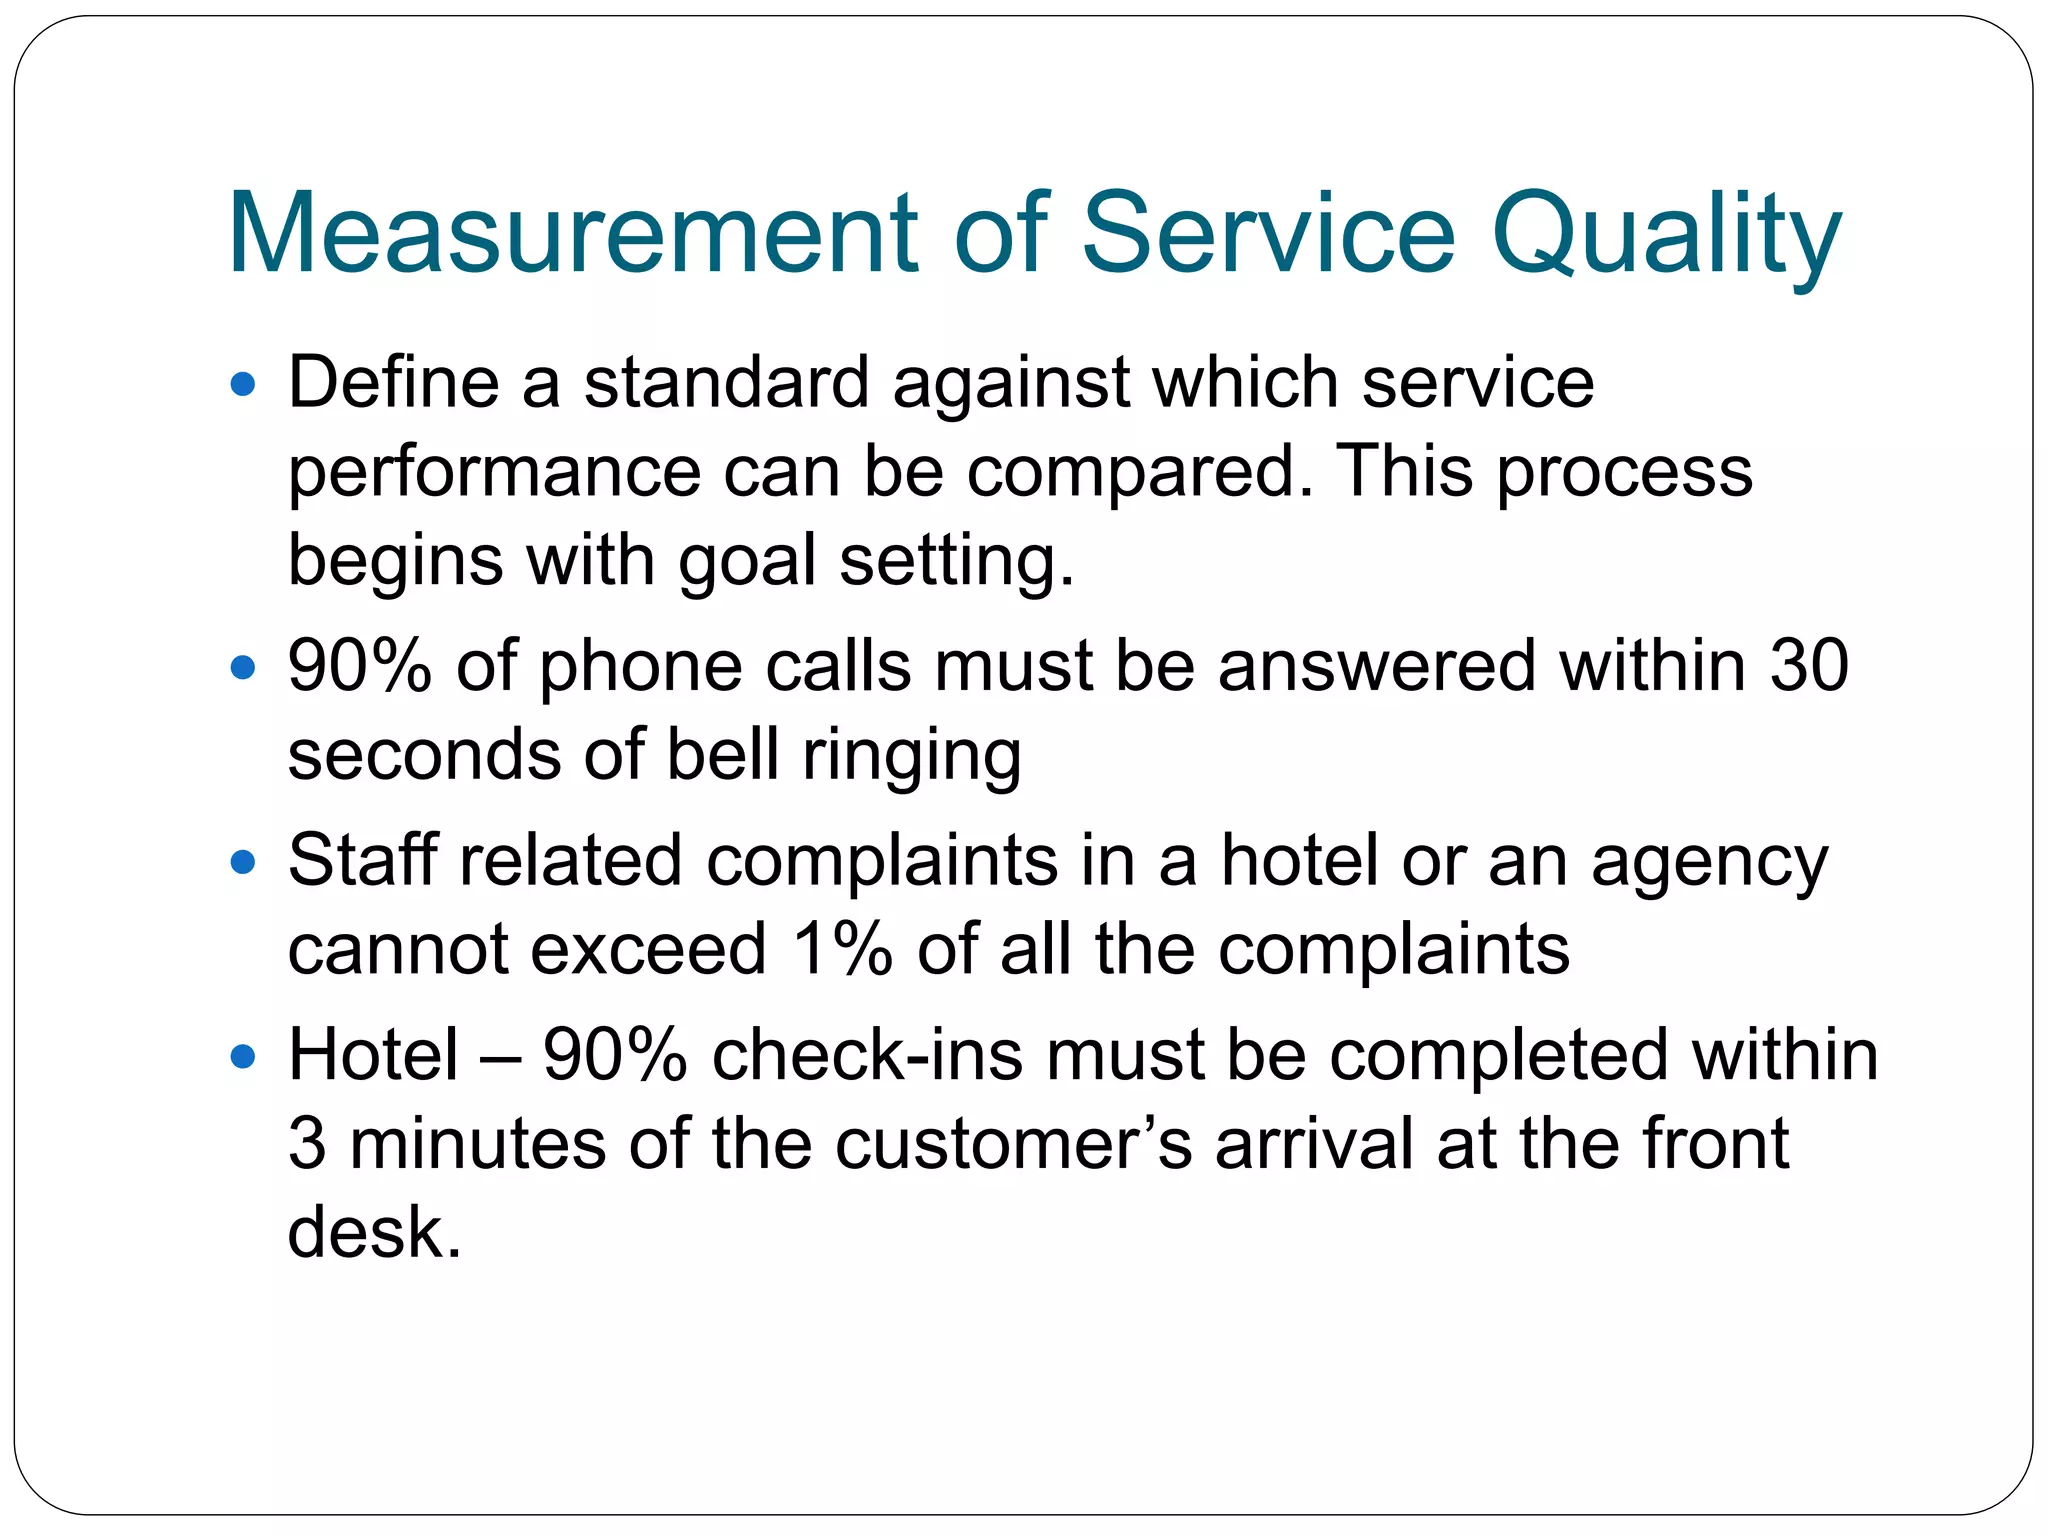
SERVICE QUALITY DIMENSIONS 
Venkatesh Ganapathy 
November 2012
SERVQUAL MODEL 
 Reliability – ability to perform the promised service 
dependably and accurately. FIRST TIME RIGHT. 
 Responsiveness – willingness to help the customer, 
speed of response to resolve customer issues 
 Assurance – knowledge and courtesy of employees, 
ability to convey trust and confidence 
 Empathy – caring and personalized attention to 
customers. Look from customer’s point of view. 
 Tangibles – appearance of physical facilities, 
equipment, personnel and communication materials. 
Physical evidence of service. Tangibles provide the 
customer proof of the quality of service.
EXPANDED MARKETING MIX 
 People – Service Employees and Customers 
involved in service ; production and consumption 
happen at the same time. Quality of service 
depends on the extent of involvement of people. 
 Process - It provides a benchmark to measure a 
service – to know what is good or bad about a 
service. Process is dynamic and needs 
continuous review to improve services. 
 Physical evidence – As services are intangible, 
the customer gets a cue(signal) about service 
only from physical tangibles - eg. The ambience 
in a hotel, the computerisation in a bank or an 
insurance company, the office exteriors and 
interiors in a BPO, the medical equipments in a 
hospital.
Measurement of Service Quality 
 Define a standard against which service 
performance can be compared. This process 
begins with goal setting. 
 90% of phone calls must be answered within 30 
seconds of bell ringing 
 Staff related complaints in a hotel or an agency 
cannot exceed 1% of all the complaints 
 Hotel – 90% check-ins must be completed within 
3 minutes of the customer’s arrival at the front 
desk.
Service Quality Standards 
 Company defines standards of service quality. Eg. 
PSU banks 
 Problem of setting standards is more acute in cases 
where the service provider is dealing with a large 
volume of retail customers. 
 When standards are set, service provider has to keep 
in mind the ability of organization and employees to 
deliver the service. 
 Service expectation changes when customer 
compares the company standards with that of its 
competitors. 
 Sometimes, the customer defines standards when a
Benchmarking 
 Continuous process of measuring products, 
services, practices against the toughest 
competitors or those companies recognized as 
industry leaders. 
 Key words 
• Continuous 
• Toughest Competitors 
• Industry leaders
 Quality standards in products and services are 
dynamic, so continuous evaluation 
 Standards must be internalized for bringing it to 
the attention of front end and back end 
employees
Complaints solicitation & analysis 
 To enable the company to understand frequent 
and persistent service failures better. 
 Customer perception of service failure and 
company perception of service failure will be 
different. 
 Feedback forms collected by some airlines
Solicitation of complaints 
 Customer gets assurance that grievances are 
being looked into 
 Positive influence on service delivery employees 
by fear 
 Govt organisations – officially lodging a complaint 
leads to enquiry, so employees try to avoid it. 
 Nature of complaints & frequency – pointers – 
where are the frequent service failures ?
Reason for complaints 
 Complaints can be due to human error or system 
failure 
 HDFC bank , Airtel – server issues 
 Airtel experience - 
 Only 4% dissatisfied customers actually complain 
about it. So, the extent of problem can be much 
more grave.
Lost Customer analysis 
Customers lost because 
• Change in location 
• Persistent inferior service quality 
•Poor value proposition 
•Inadequate features of service 
•Customers may switch suddenly
Critical Incident Study 
 Any one incident which affects the customer 
perception of the quality of a service. 
 Information sought via feedback forms 
 In 90% cases, the fact that the incident is being 
recognised as critical, will make the customer 
dissatisfaction evaporate. 
 Actually only 5% of critical incidents are reported. 
 Even front end staff are encouraged to report 
critical incidents.
ROSQ – Return on Service 
Quality 
 Approach developed by Roland Rust and others 
 SERVICE QUALITY IS AN INVESTMENT 
 SERVICE QUALITY EFFORTS MUST BE 
FINANCIALLY ACCOUNTABLE 
 IT IS POSSIBLE TO SPEND TOO MUCH ON 
SERVICE QUALITY 
 NOT ALL SERVICE QUALITY EXPENDITURES 
ARE EQUALLY VALID.
Investments in services 
 Service improvement effort leads to increased 
level of customer satisfaction at process level. 
 This leads to increase in overall customer 
satisfaction 
 This improves behavioral intentions like 
repurchase 
 Customer becomes more loyal 
 Word of mouth referrals 
 Higher revenues 
 Increased profitability
Different methods of listening to 
customers 
 Addresses Provider Gap 1 
 Research 
 Formal and informal methods - surveys, critical 
incident studies, complaint solicitation 
 Upward communication from front line employees 
to managers
Servuction 
 Service + Production 
 Customer’s presence compulsory during service 
process. 
 Services are for real-time distribution. 
 INSEPARABILITY - Production & Consumption 
same time. 
 The inseparability component – important feature 
of Servuction model. 
 Visible component 
 Invisible component 
 Customers draw conclusions about service based 
on tangibles / physical evidence.

22.service quality dimensions

  • 1.
    SERVICE QUALITY DIMENSIONS Venkatesh Ganapathy November 2012
  • 2.
    SERVQUAL MODEL Reliability – ability to perform the promised service dependably and accurately. FIRST TIME RIGHT.  Responsiveness – willingness to help the customer, speed of response to resolve customer issues  Assurance – knowledge and courtesy of employees, ability to convey trust and confidence  Empathy – caring and personalized attention to customers. Look from customer’s point of view.  Tangibles – appearance of physical facilities, equipment, personnel and communication materials. Physical evidence of service. Tangibles provide the customer proof of the quality of service.
  • 3.
    EXPANDED MARKETING MIX  People – Service Employees and Customers involved in service ; production and consumption happen at the same time. Quality of service depends on the extent of involvement of people.  Process - It provides a benchmark to measure a service – to know what is good or bad about a service. Process is dynamic and needs continuous review to improve services.  Physical evidence – As services are intangible, the customer gets a cue(signal) about service only from physical tangibles - eg. The ambience in a hotel, the computerisation in a bank or an insurance company, the office exteriors and interiors in a BPO, the medical equipments in a hospital.
  • 4.
    Measurement of ServiceQuality  Define a standard against which service performance can be compared. This process begins with goal setting.  90% of phone calls must be answered within 30 seconds of bell ringing  Staff related complaints in a hotel or an agency cannot exceed 1% of all the complaints  Hotel – 90% check-ins must be completed within 3 minutes of the customer’s arrival at the front desk.
  • 5.
    Service Quality Standards  Company defines standards of service quality. Eg. PSU banks  Problem of setting standards is more acute in cases where the service provider is dealing with a large volume of retail customers.  When standards are set, service provider has to keep in mind the ability of organization and employees to deliver the service.  Service expectation changes when customer compares the company standards with that of its competitors.  Sometimes, the customer defines standards when a
  • 6.
    Benchmarking  Continuousprocess of measuring products, services, practices against the toughest competitors or those companies recognized as industry leaders.  Key words • Continuous • Toughest Competitors • Industry leaders
  • 7.
     Quality standardsin products and services are dynamic, so continuous evaluation  Standards must be internalized for bringing it to the attention of front end and back end employees
  • 8.
    Complaints solicitation &analysis  To enable the company to understand frequent and persistent service failures better.  Customer perception of service failure and company perception of service failure will be different.  Feedback forms collected by some airlines
  • 9.
    Solicitation of complaints  Customer gets assurance that grievances are being looked into  Positive influence on service delivery employees by fear  Govt organisations – officially lodging a complaint leads to enquiry, so employees try to avoid it.  Nature of complaints & frequency – pointers – where are the frequent service failures ?
  • 10.
    Reason for complaints  Complaints can be due to human error or system failure  HDFC bank , Airtel – server issues  Airtel experience -  Only 4% dissatisfied customers actually complain about it. So, the extent of problem can be much more grave.
  • 11.
    Lost Customer analysis Customers lost because • Change in location • Persistent inferior service quality •Poor value proposition •Inadequate features of service •Customers may switch suddenly
  • 13.
    Critical Incident Study  Any one incident which affects the customer perception of the quality of a service.  Information sought via feedback forms  In 90% cases, the fact that the incident is being recognised as critical, will make the customer dissatisfaction evaporate.  Actually only 5% of critical incidents are reported.  Even front end staff are encouraged to report critical incidents.
  • 14.
    ROSQ – Returnon Service Quality  Approach developed by Roland Rust and others  SERVICE QUALITY IS AN INVESTMENT  SERVICE QUALITY EFFORTS MUST BE FINANCIALLY ACCOUNTABLE  IT IS POSSIBLE TO SPEND TOO MUCH ON SERVICE QUALITY  NOT ALL SERVICE QUALITY EXPENDITURES ARE EQUALLY VALID.
  • 15.
    Investments in services  Service improvement effort leads to increased level of customer satisfaction at process level.  This leads to increase in overall customer satisfaction  This improves behavioral intentions like repurchase  Customer becomes more loyal  Word of mouth referrals  Higher revenues  Increased profitability
  • 16.
    Different methods oflistening to customers  Addresses Provider Gap 1  Research  Formal and informal methods - surveys, critical incident studies, complaint solicitation  Upward communication from front line employees to managers
  • 17.
    Servuction  Service+ Production  Customer’s presence compulsory during service process.  Services are for real-time distribution.  INSEPARABILITY - Production & Consumption same time.  The inseparability component – important feature of Servuction model.  Visible component  Invisible component  Customers draw conclusions about service based on tangibles / physical evidence.