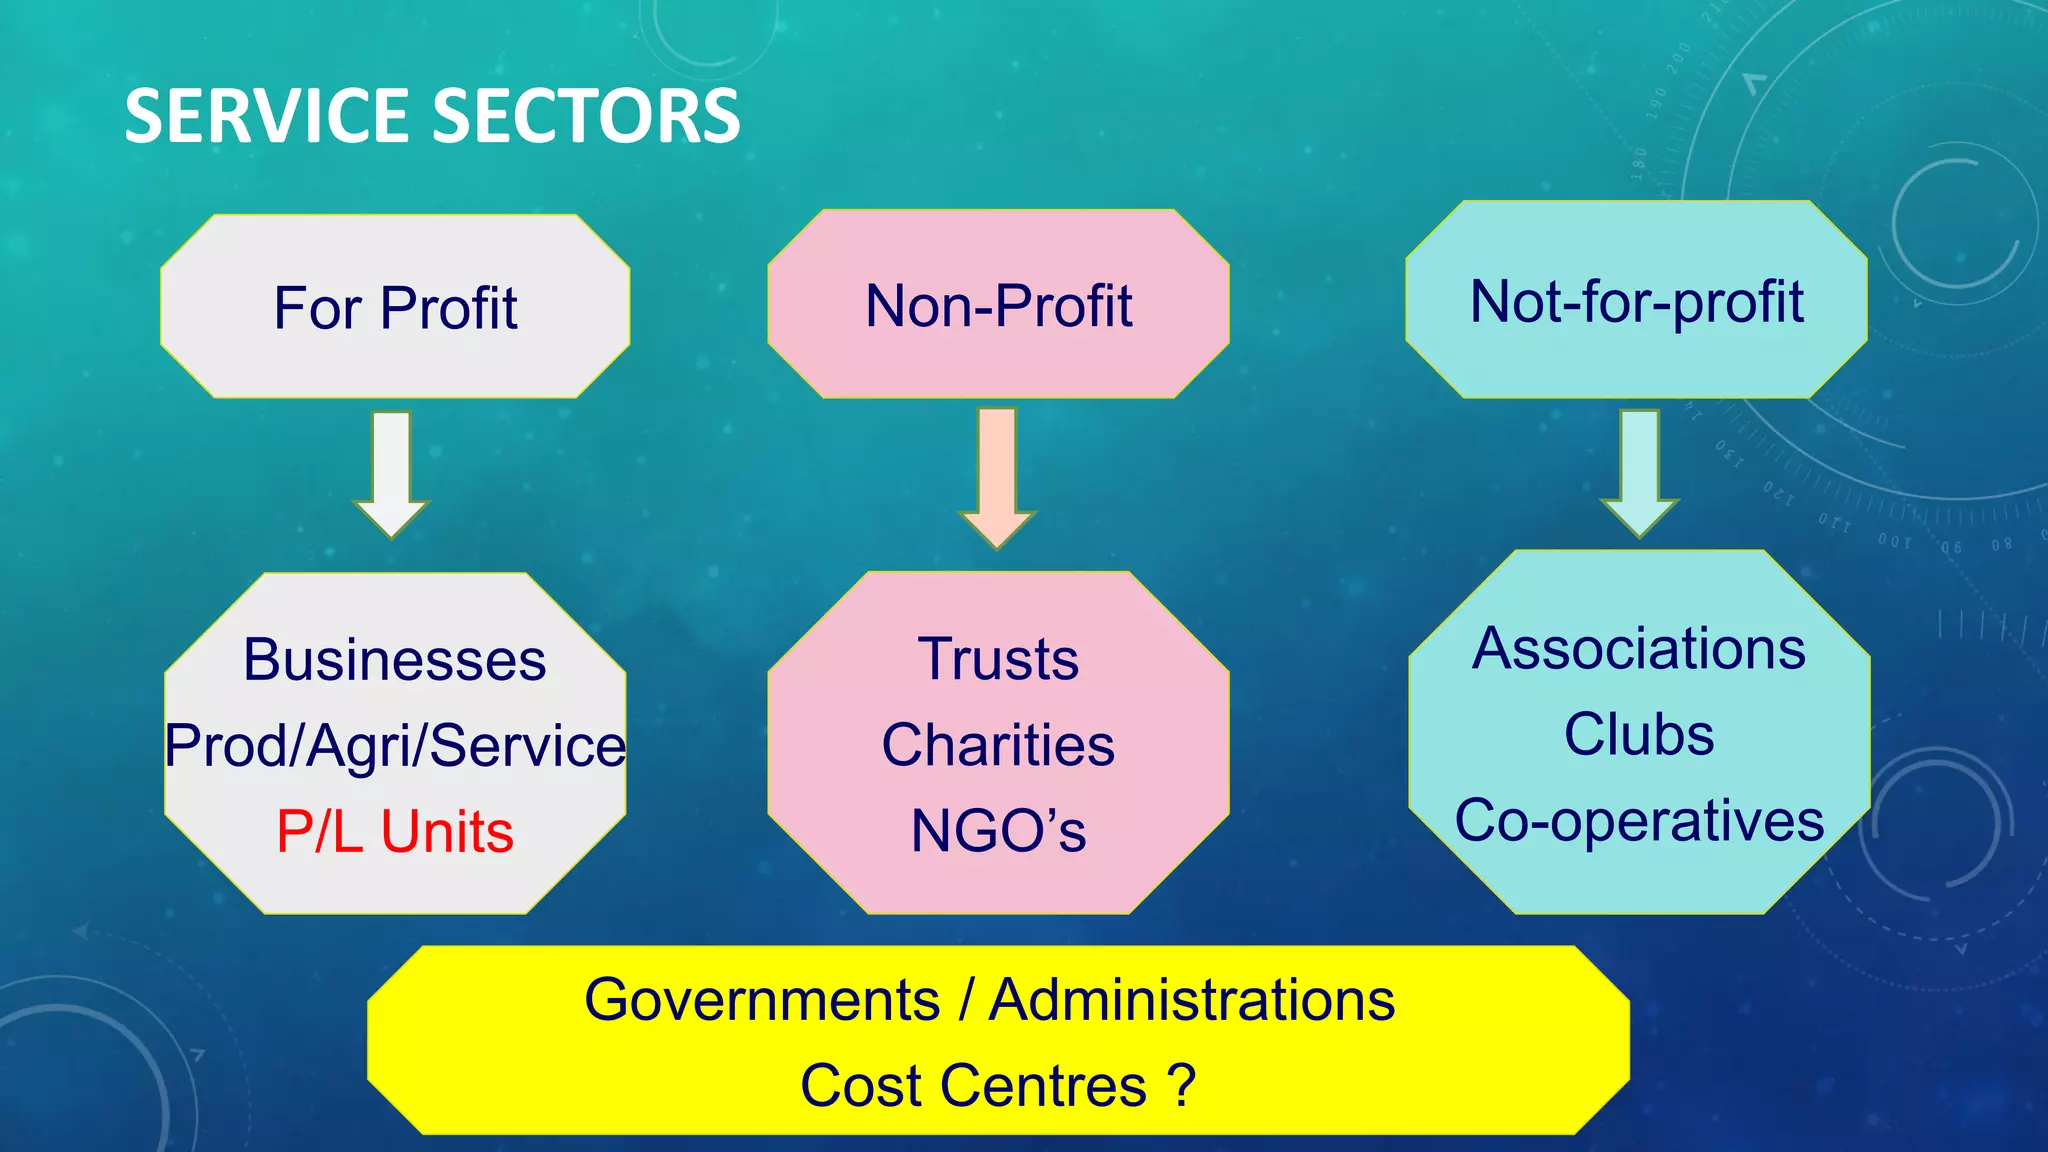
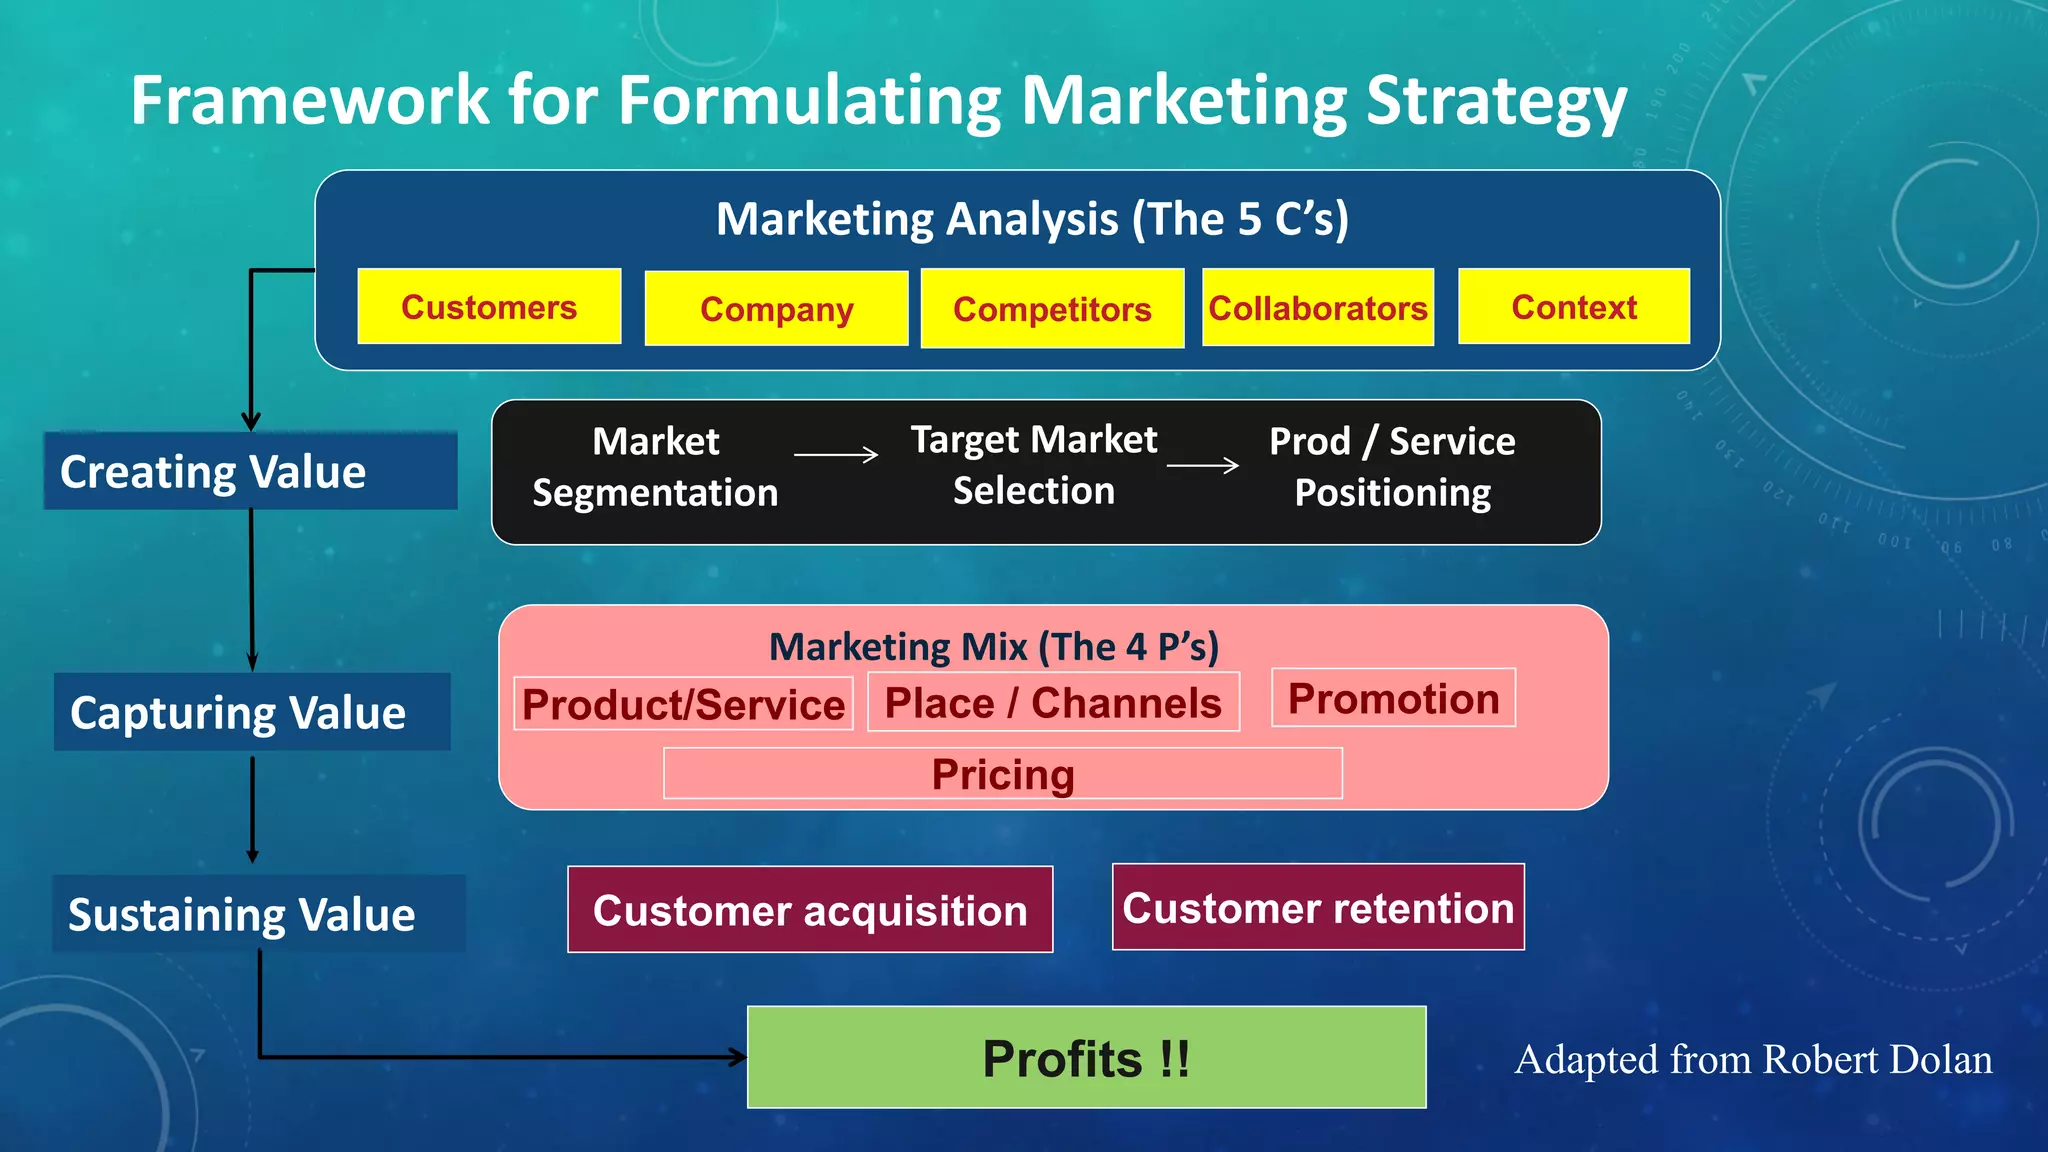
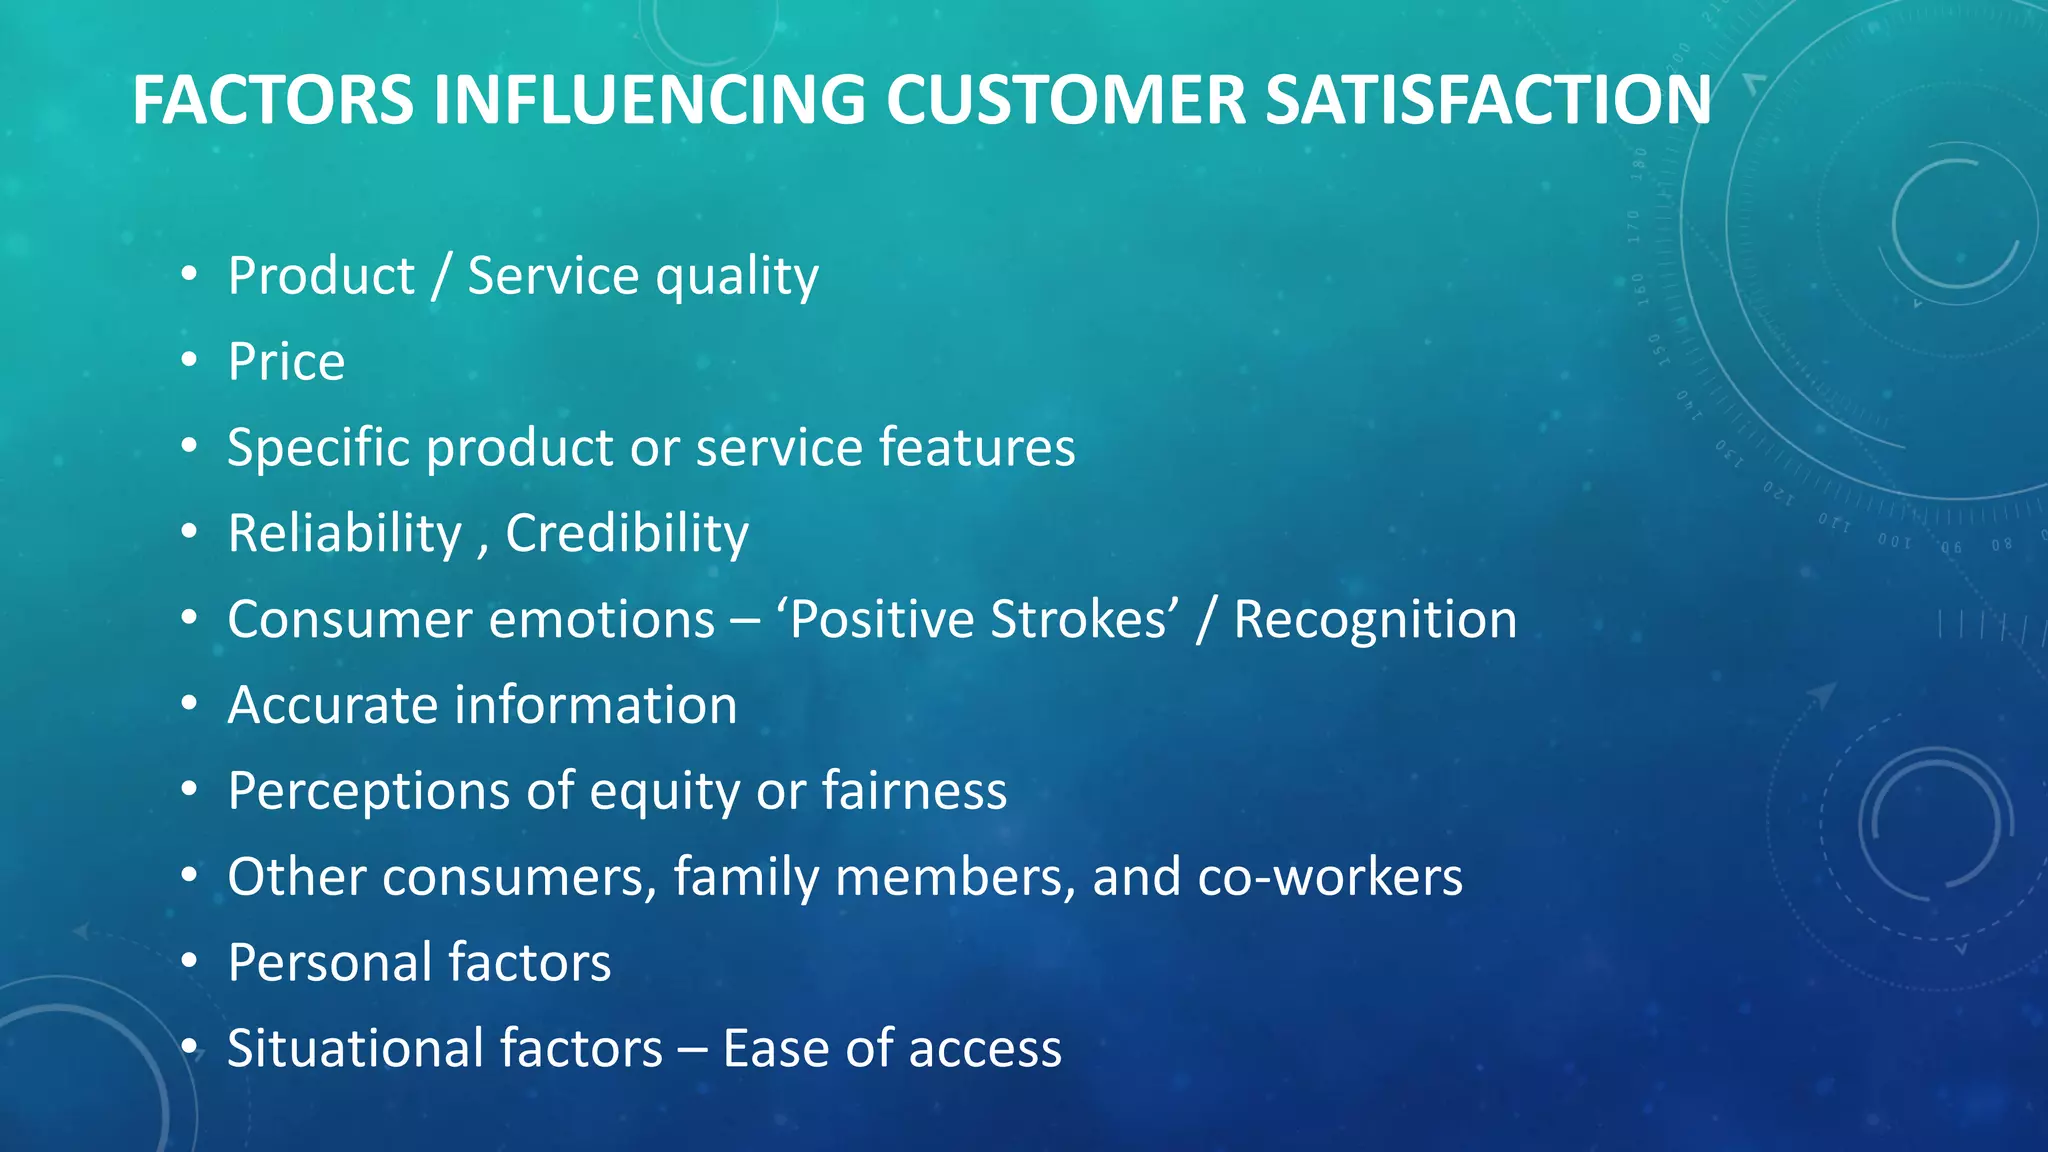
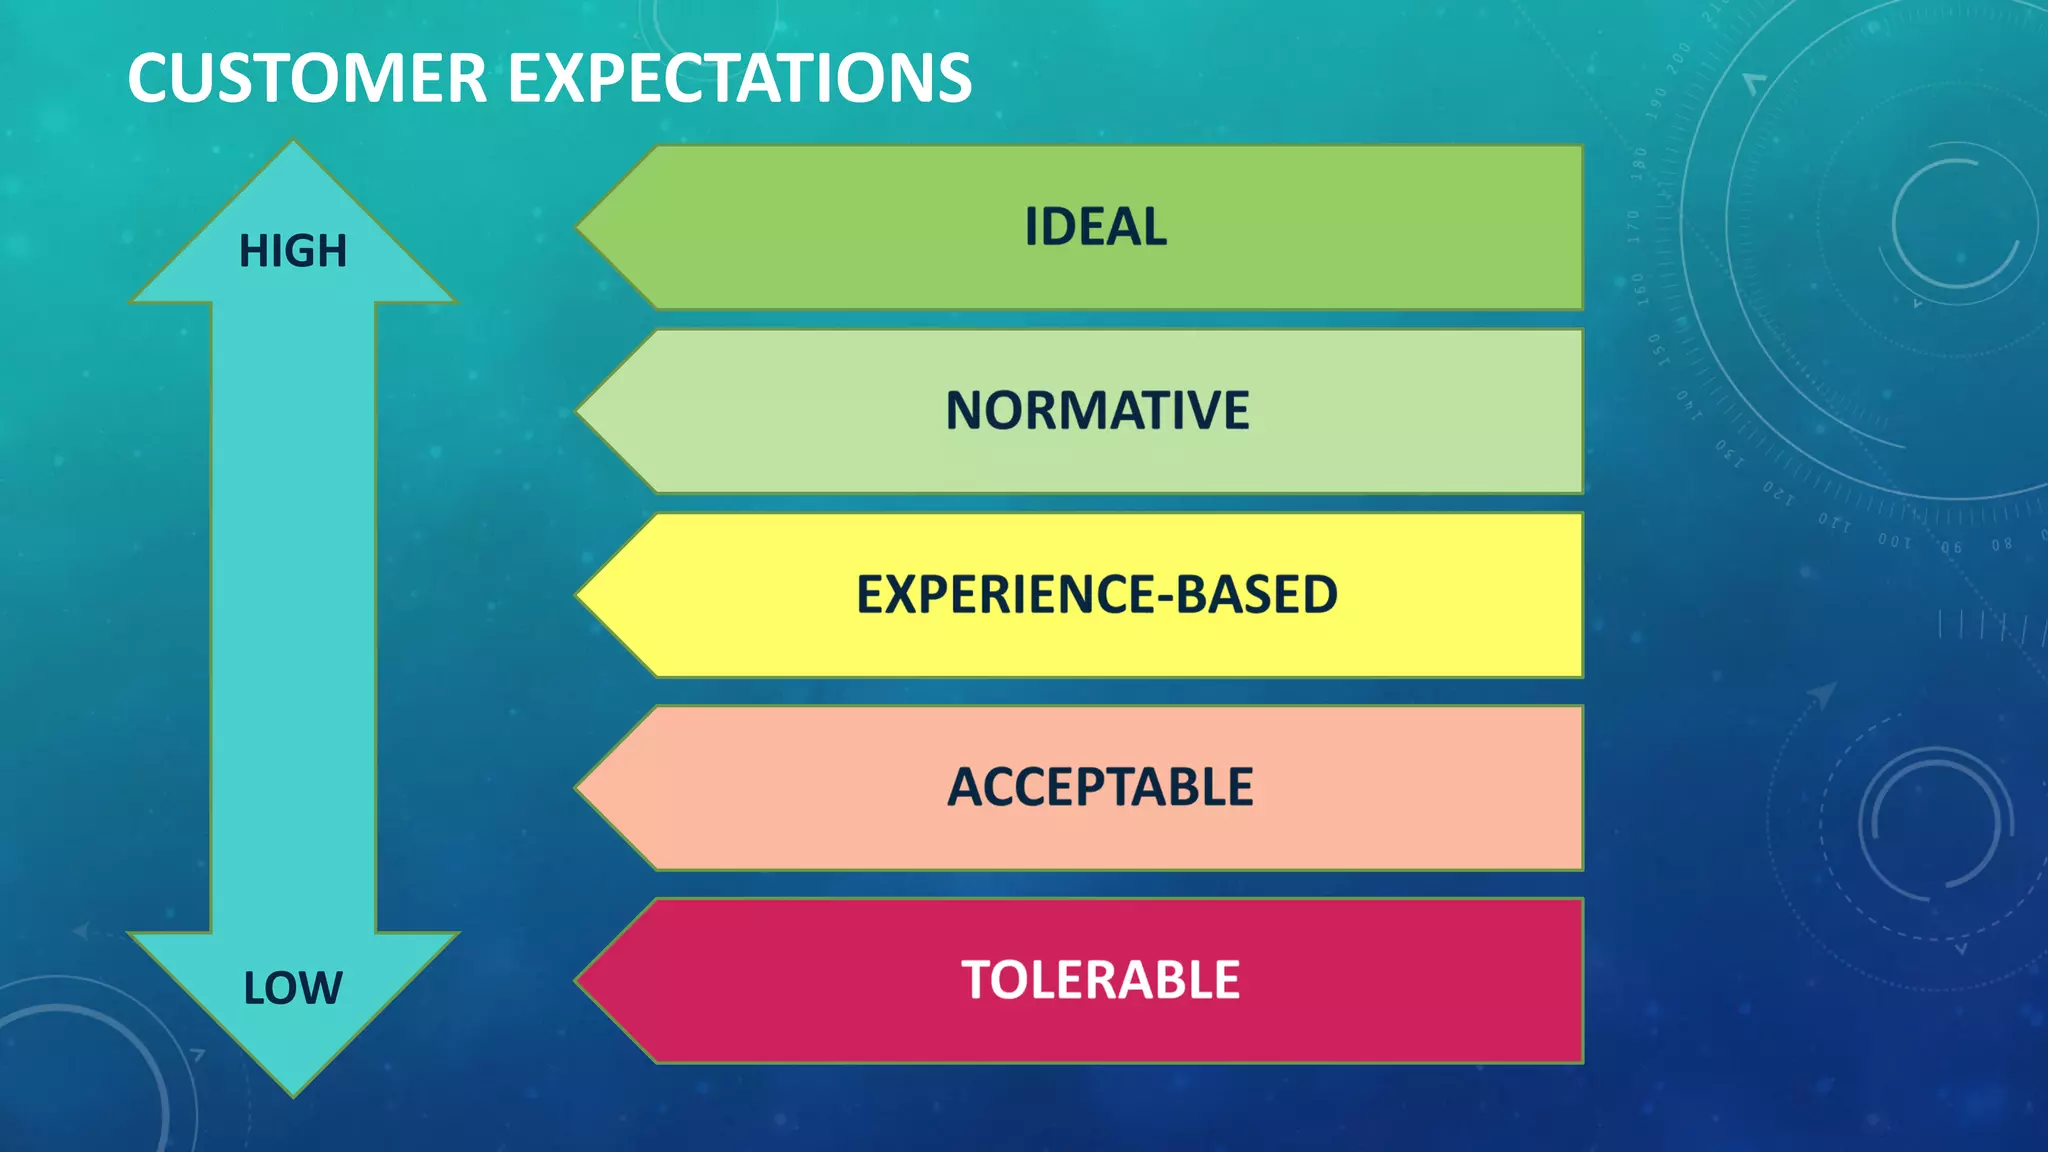
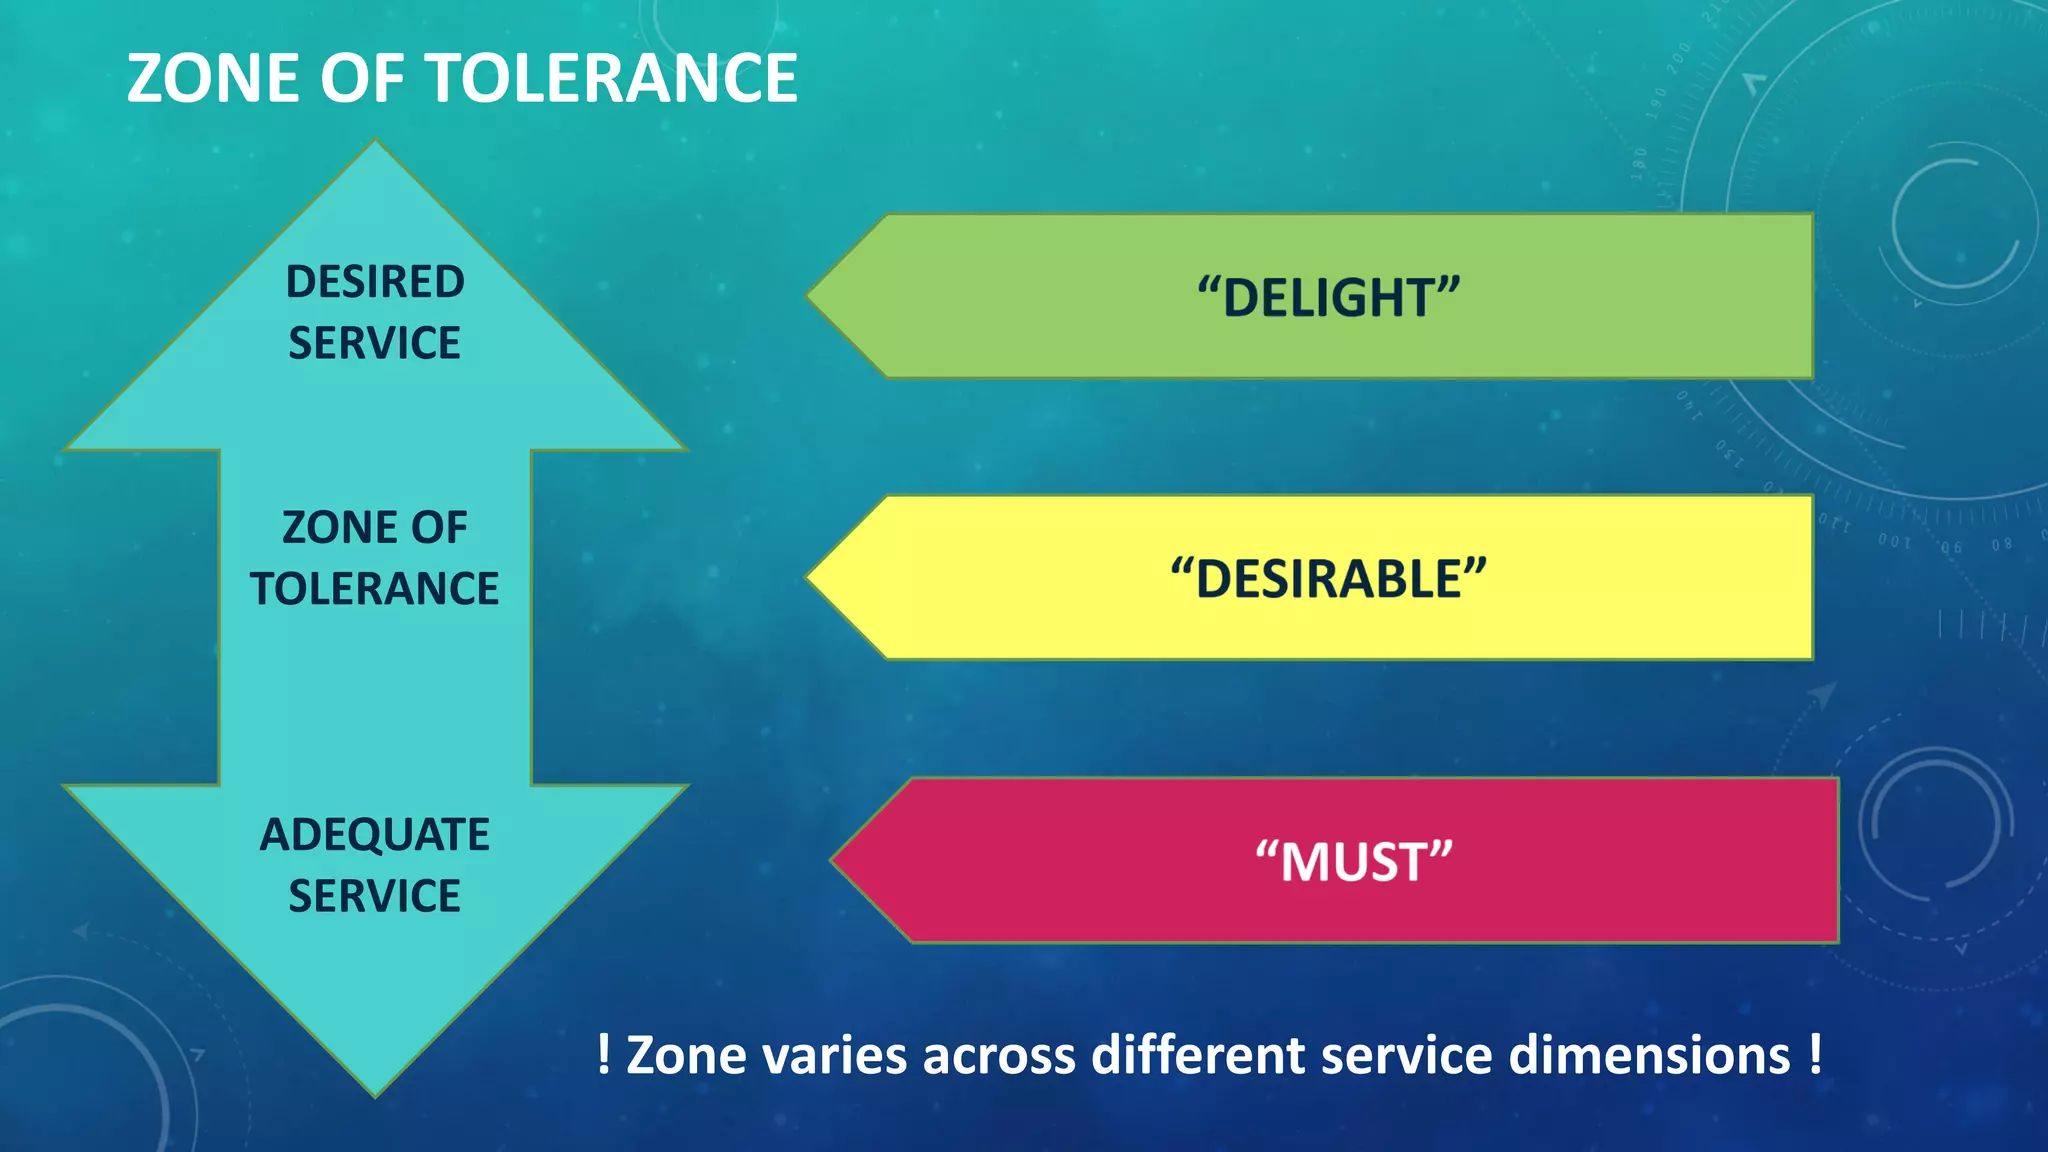
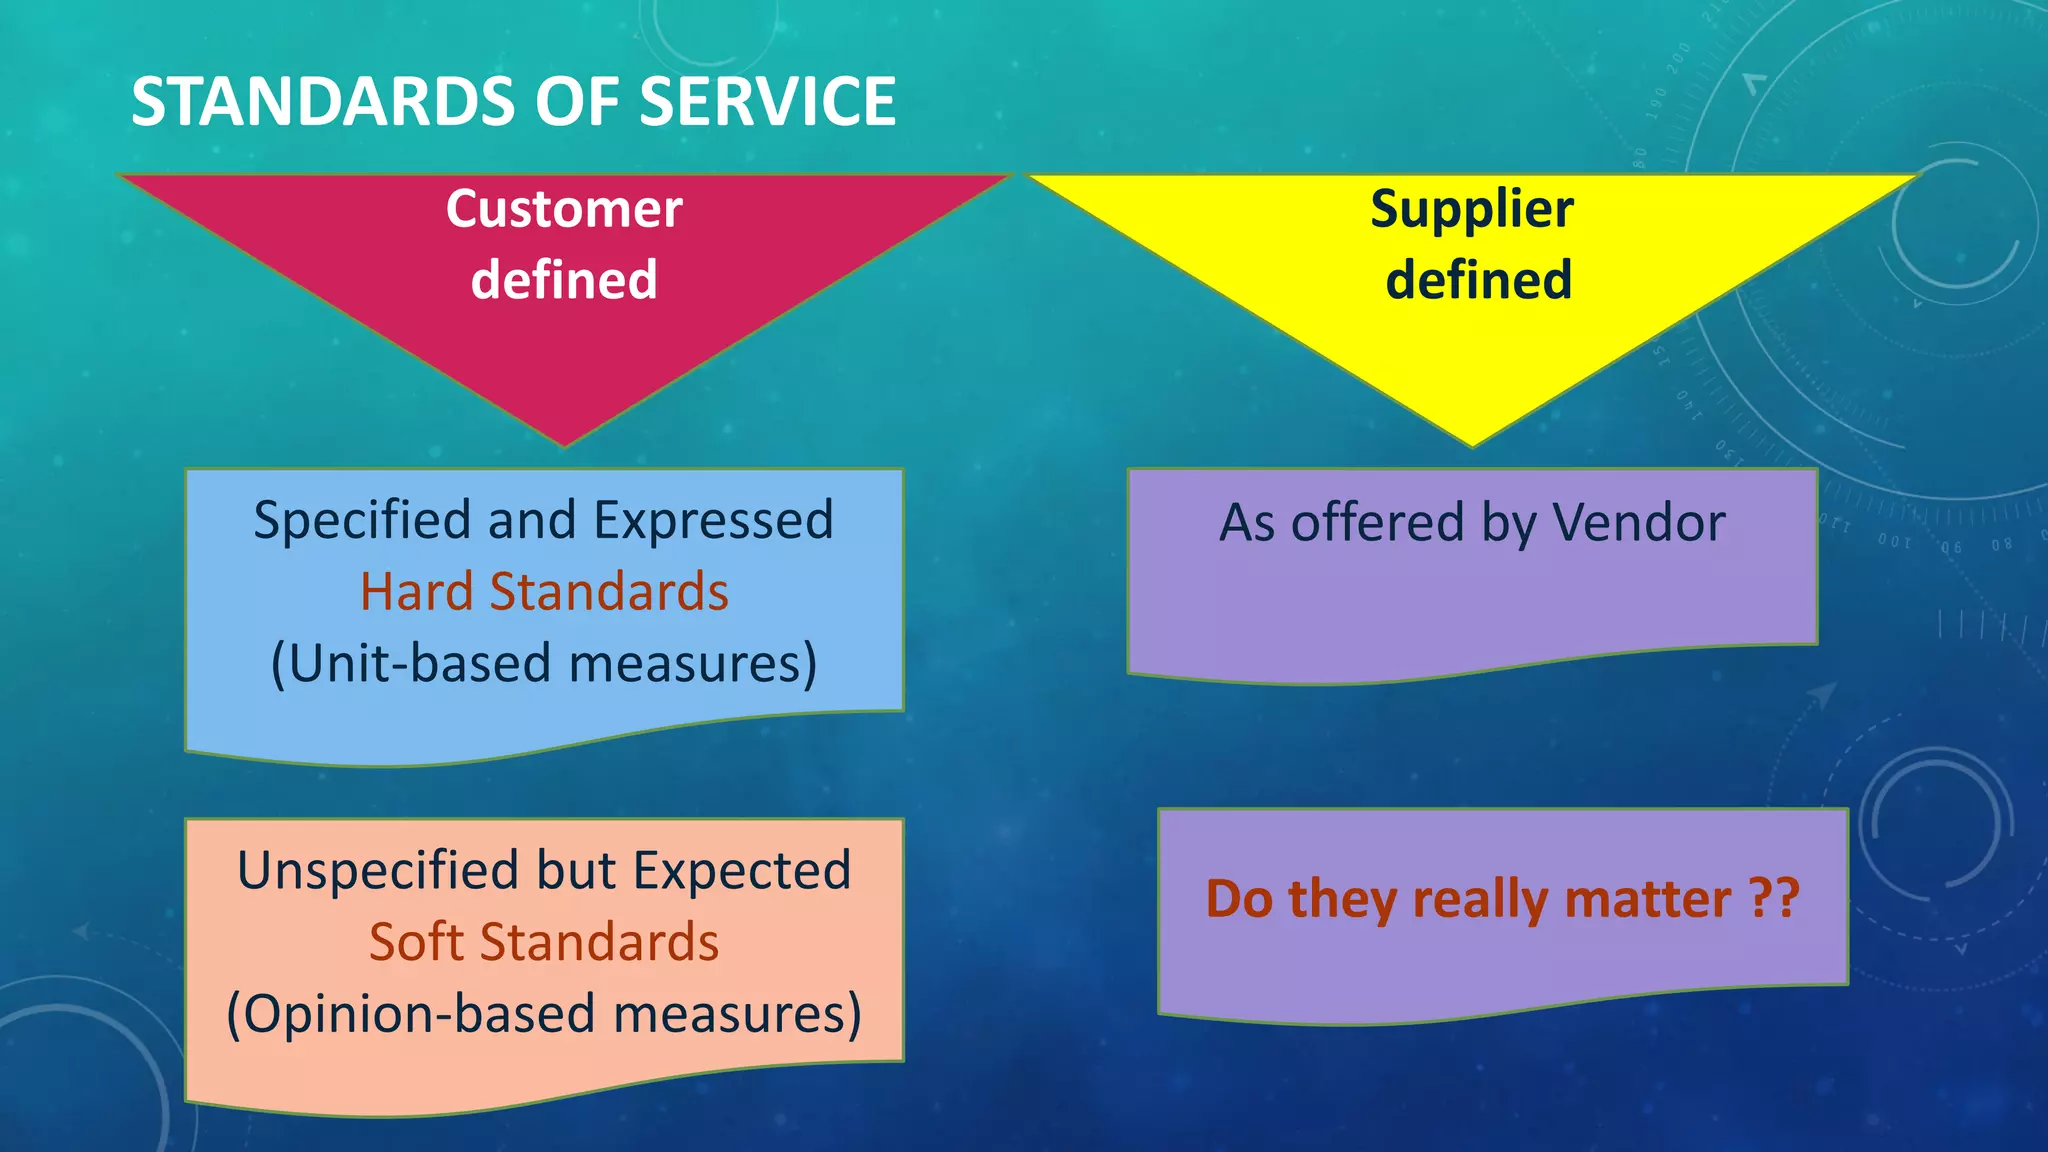
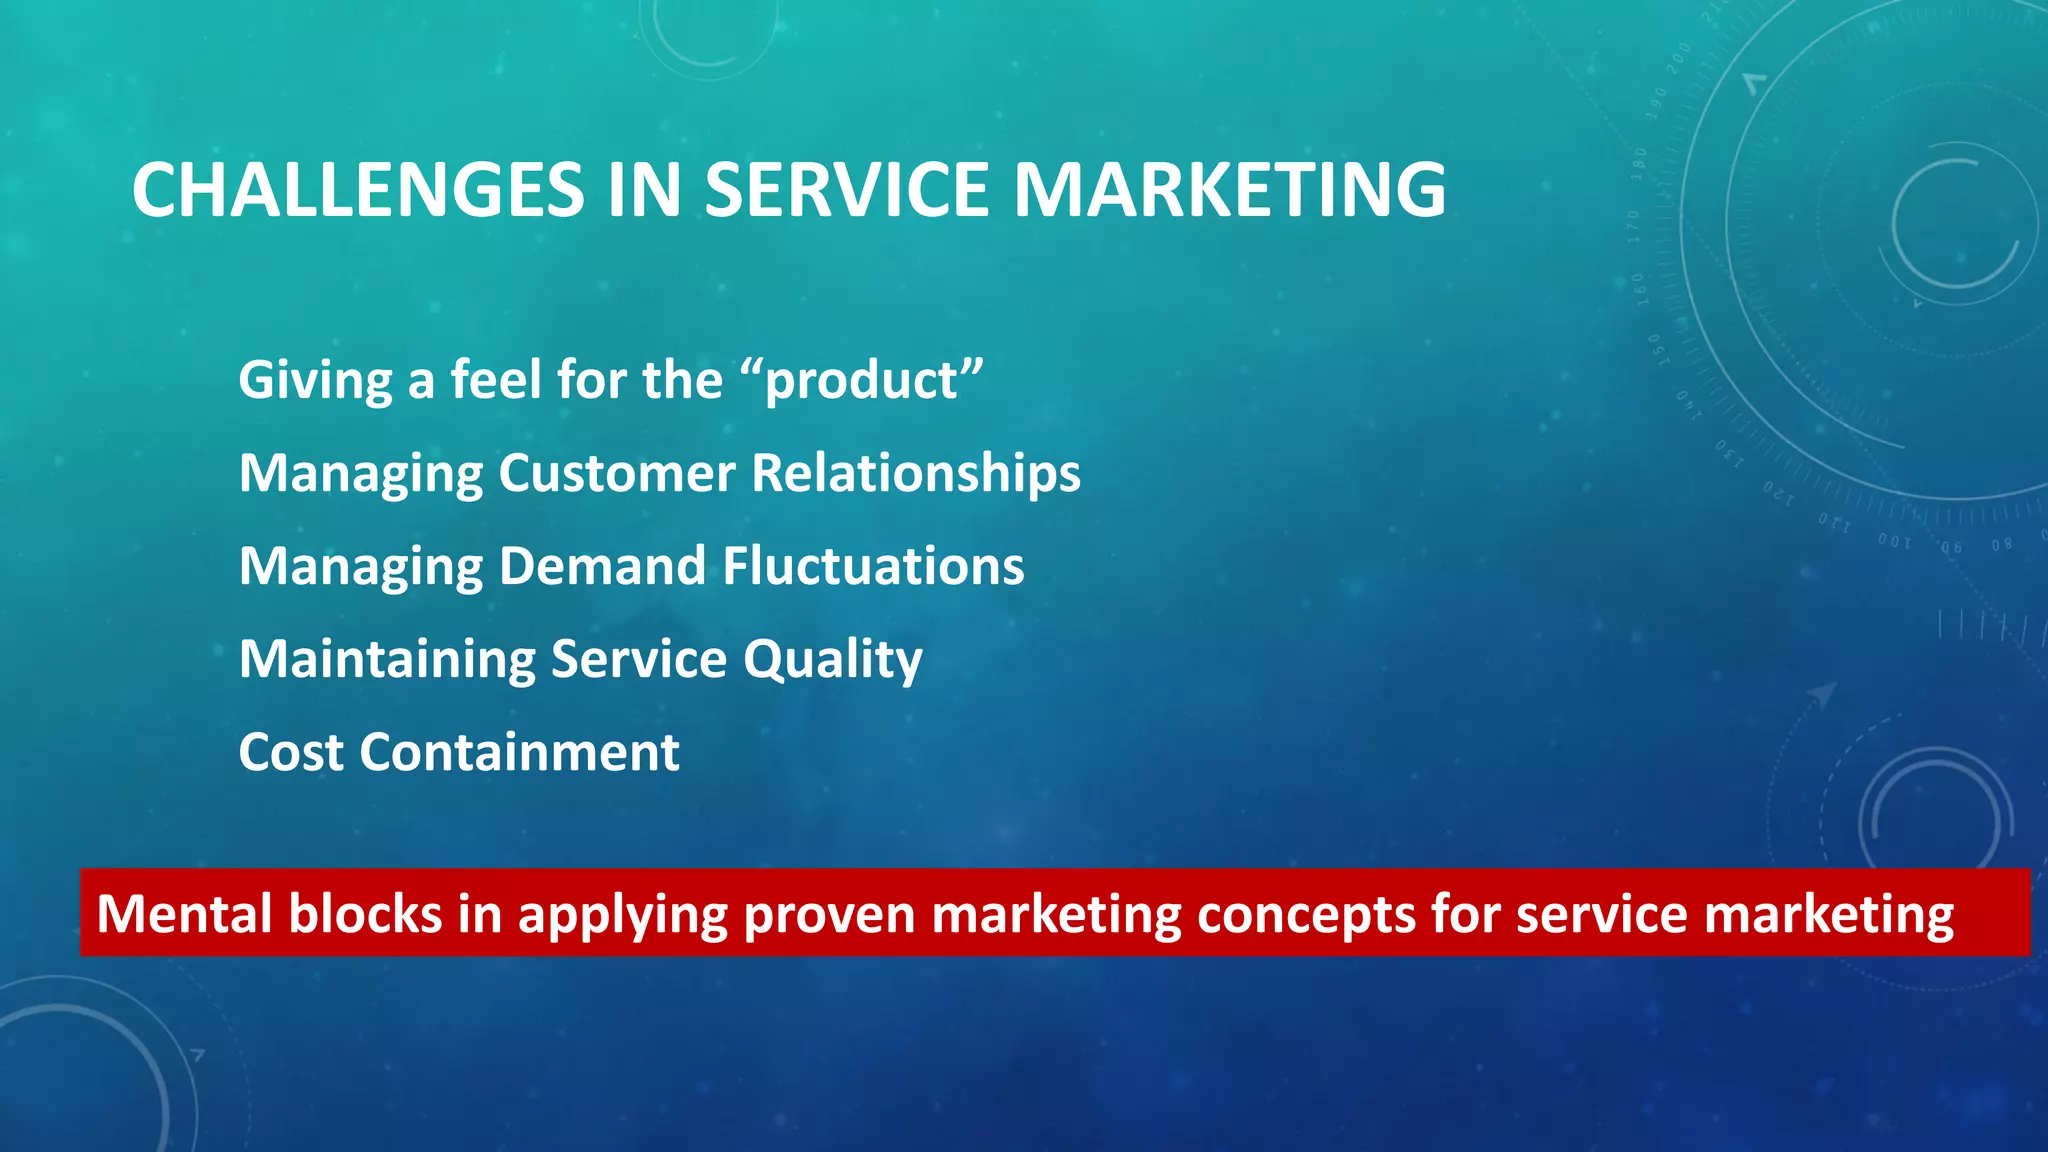
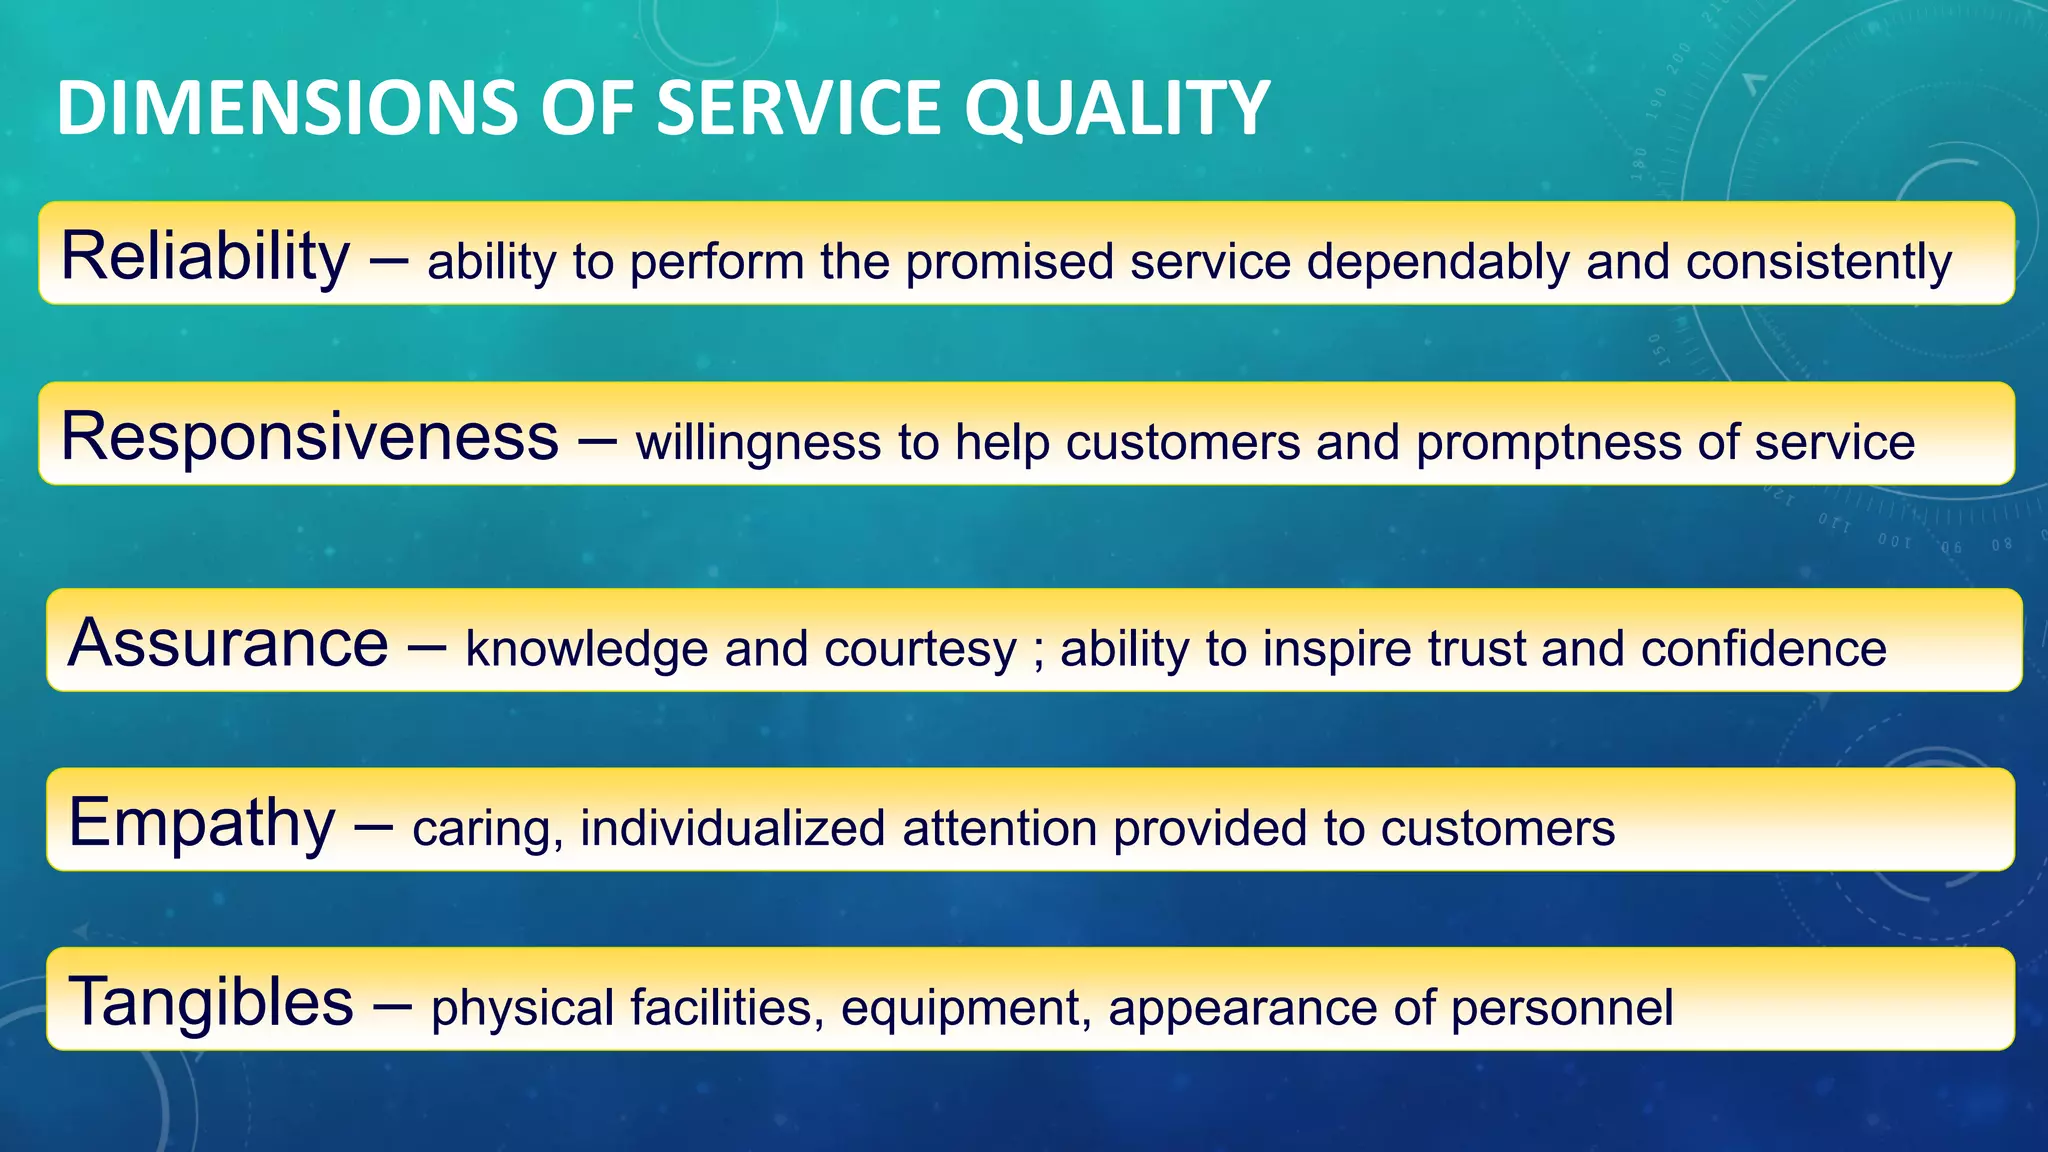
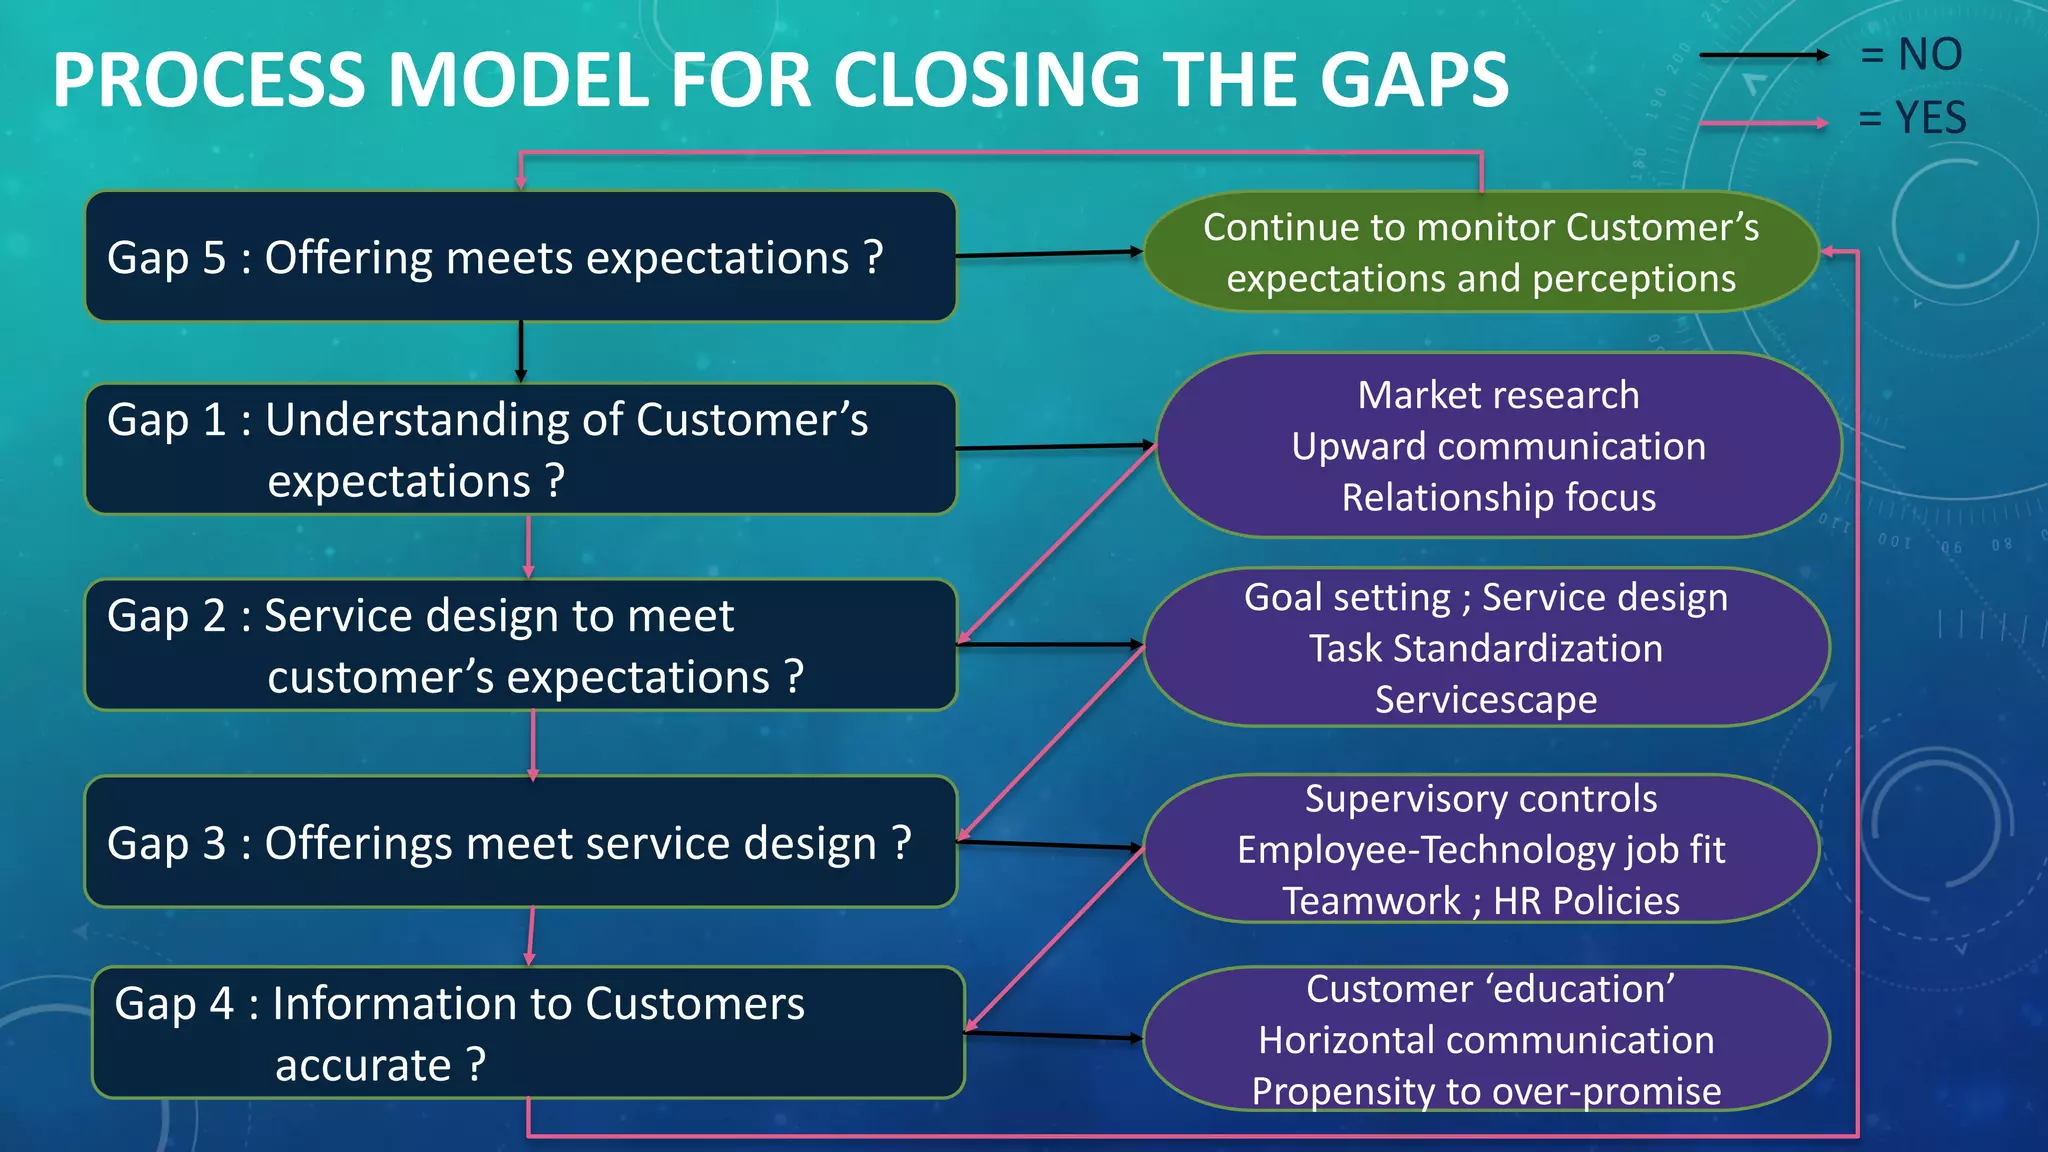
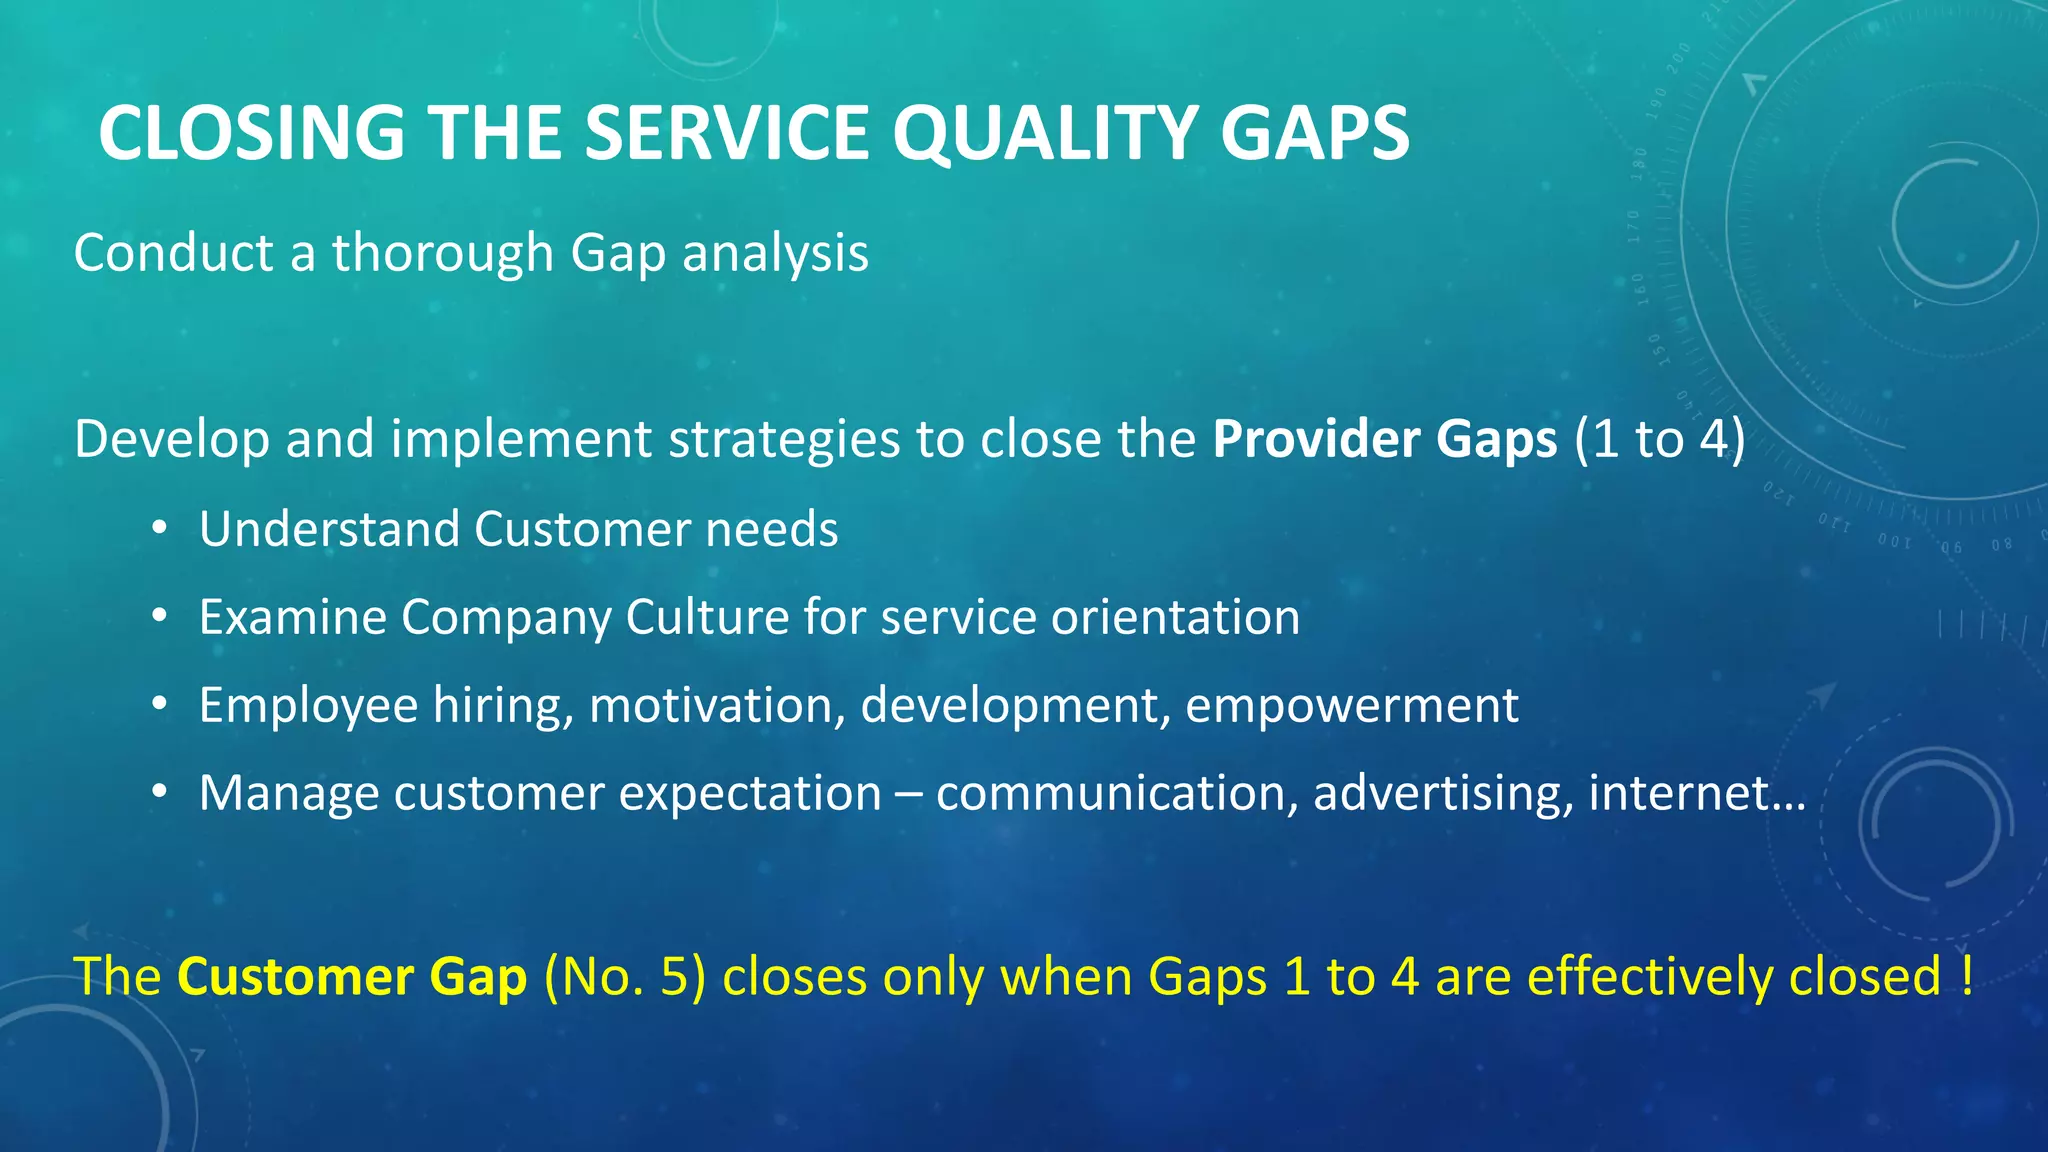
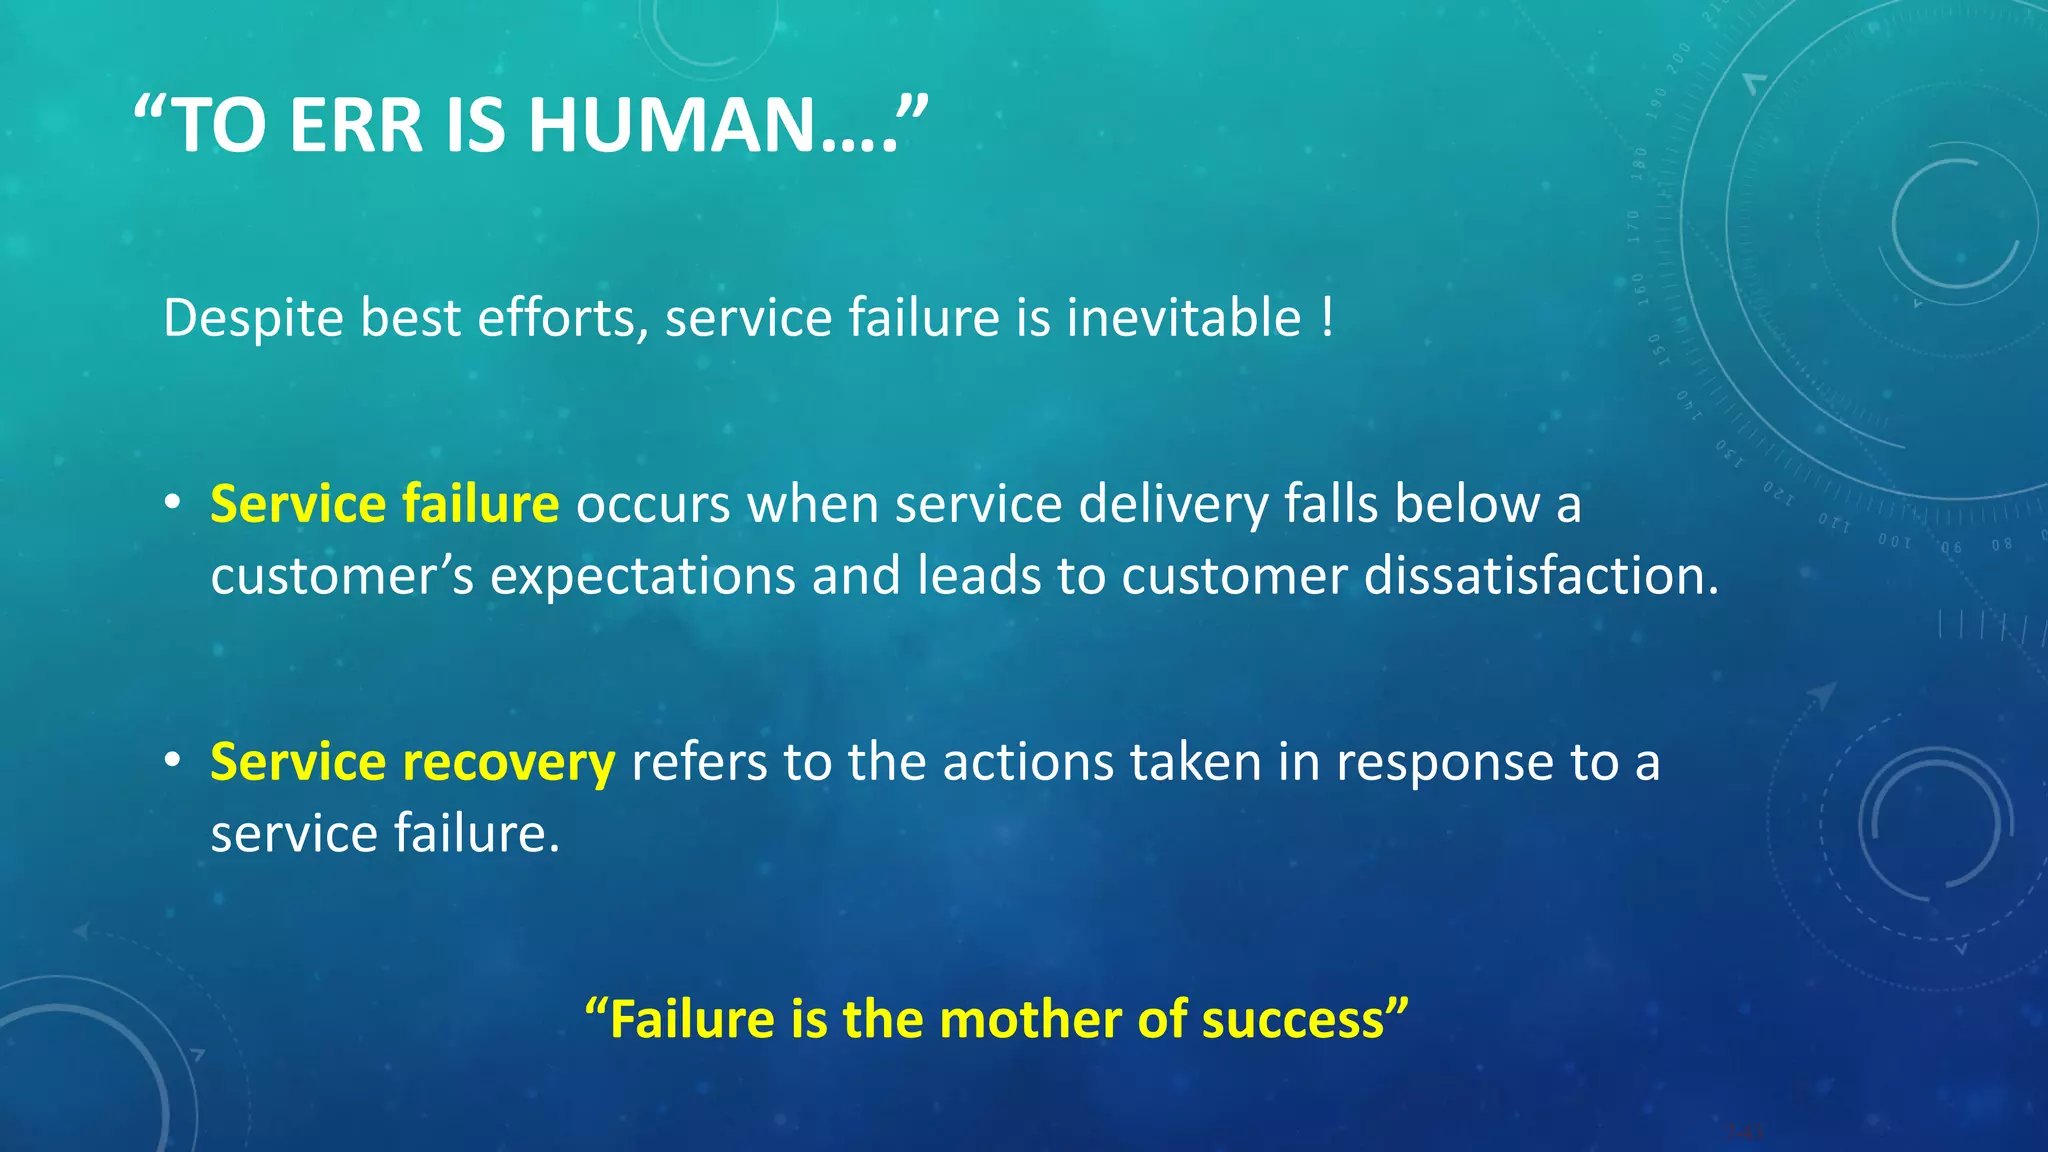
MARKETING SERVICES
IN THE
MARITIME INDUSTRY
MANAGING SERVICE QUALITY FOR CUSTOMER SATISFACTION
CMMI MONTHLY LECTURE SERIES
MUMBAI, 2ND NOVEMBER 2017 CAPT. Y SHARMA
FELLOW - CMMI
SERVICES
PRODUCTS, GOODS, SERVICES…
Product
• Bundle of physical, service, and symbolic attributes designed to
satisfy a customer’s wants and needs
Goods
• Tangible products that customers can see, hear, smell, taste, or
touch
Services
• Intangible tasks that satisfy the needs of consumers and business
users
DEFINING SERVICES ….
“Identifiable, Intangible activities that are the main object of a
transaction designed to provide want-satisfaction to customers”
Goods–services continuum
“Spectrum along which goods and services fall according to their
attributes, from pure goods to pure service”
SERVICE MIX
Pure Goods
Goods with
accompanying
Services
Pure Services
Hybrid
Services with
accompanying
Goods
Other Differentiators :
Equipment / People / Customer
presence / Processes, etc.
Where does the Maritime
Industry fit in ?
SERVICE SECTORS
For Profit
Trusts
Charities
NGO’s
Businesses
Prod/Agri/Service
P/L Units
Associations
Clubs
Co-operatives
Non-Profit Not-for-profit
Governments / Administrations
Cost Centres ?
SERVICE CONTINUUM
Tangible Dominant
(Manufacturing Sector)
• Shopping Experience
• After-sales Service
• Warranties
• Installation
• Use Support
Intangible Dominant
(Service Sector)
• Give-aways
• Reading Material
• Uniforms
• Dress-code
• ‘Productizing’
Key Challenge :
Managing the Intangibles
(provides competitive advantage)
Key Challenge :
‘Tangiblizing’ the intangibles
(Drives customer demand)
FOUR DISTINCTIVE CHARACTERISTICS ….
Intangibility Inseparability
Variability
Perishability
Customer
cannot
experience
the ‘product’
prior
purchase
Non-measurable
‘Product’ cannot
be stored or
‘inventorized’
for later use
Need to manage
demand
fluctuation
Difficult to
establish
consistency
in quality
across
providers,
time, etc.
Complex variety
Production and
consumption
happen at the
same place
and time
Customer is part
of the process
Heterogeneity
‘SERVICESCAPE’ – PHYSICAL EVIDENCE
Facility Exterior
• Accessibility
• Exterior design
• Signage
• Parking
• Landscape
• Surrounding
environment
Facility Interior
• Interior design
• Equipment
• Signage & Layout
• Air quality
• Temp / Humidity
• Colours / Lighting
• Noises
• Smells
Other Tangibles
• Business cards
• Stationery
• Billing statements
• Reports
• Employee dress
• Uniforms
• Brochures
• Internet/Web
“Totality of the ambience and physical environment in which a
service is performed, delivered and consumed”
MARKETING
WHAT IS MARKETING ?
• The process of creating and delivering goods and services to the
customer
• Involves all the activities associated with winning and retaining
loyal customers
• Understanding the target customer’s needs / wants / demands
• Offering services that will satisfy those needs...
• Providing the customer with quality service, convenience, and value
A Customer’s ‘Needs’ generate the ‘Wants’.
Aim of Marketing is to convert ‘Wants’ to ‘Demands’
UNDERSTANDING MARKETING -
THE ICEBERG PRINCIPLE:
Product/Service, Price, Distribution
Advertising, Promotion
UNDERSTANDING MARKETING –
THE ICEBERG PRINCIPLE:
Segmentation, Targeting, Positioning
Threat of New Entrants, Stage of Firm
Possible Competitive reactions,
Technological Innovation, Activity
Systems within Firm, Customer
Acquisition and Retention Costs,
Management Cohesion and Risk
Propensity, Culture, etc.
Need to know the key indicators to understand the ‘Marketing Mix’
THE 5 C’S OF MARKETING
Customer Needs
• What needs from which clients do we need to satisfy ?
Company Skills
• What special competencies do we possess to meet those needs ?
Competition
• Who competes with us in meeting those needs ?
Collaborators
• Who should we enlist to help us and how do we motivate them ?
Context
• What cultural / technological / legal factors limit what is possible ?
Framework for Formulating Marketing Strategy
Customers Company Competitors Collaborators
Marketing Analysis (The 5 C’s)
Market
Segmentation
Target Market
Selection
Prod / Service
Positioning
Marketing Mix (The 4 P’s)
Product/Service Place / Channels Promotion
Pricing
Customer acquisition Customer retention
Profits !!
Creating Value
Capturing Value
Sustaining Value
Context
Adapted from Robert Dolan
THE CUSTOMER IS . . .
Anyone who receives the company’s services, including :
External customers
• Outside the organization, business customers, suppliers, partners, end
consumers
Internal customers
• inside the organization, e.g., other departments, fellow employees
FACTORS INFLUENCING CUSTOMER SATISFACTION
• Product / Service quality
• Price
• Specific product or service features
• Reliability , Credibility
• Consumer emotions – ‘Positive Strokes’ / Recognition
• Accurate information
• Perceptions of equity or fairness
• Other consumers, family members, and co-workers
• Personal factors
• Situational factors – Ease of access
SERVICES MARKETING
DEFINITION
“Activity or benefit that one party can offer to another that is
essentially intangible and does not result in the ownership of
anything.
Its production may or may not be tied to a physical product”
CUSTOMER EXPECTATIONS
HIGH
LOW
ZONE OF TOLERANCE
DESIRED
SERVICE
ZONE OF
TOLERANCE
ADEQUATE
SERVICE
! Zone varies across different service dimensions !
STANDARDS OF SERVICE
Customer
defined
Supplier
defined
Specified and Expressed
Hard Standards
(Unit-based measures)
As offered by Vendor
Unspecified but Expected
Soft Standards
(Opinion-based measures)
Do they really matter ??
CHALLENGES IN SERVICE MARKETING
Giving a feel for the “product”
Managing Customer Relationships
Managing Demand Fluctuations
Maintaining Service Quality
Cost Containment
Mental blocks in applying proven marketing concepts for service marketing
THE SERVICES MARKETING TRIANGLE
‘Offensive’ Marketing
(Attracting Customers)
(Employees)
SERVICES MARKETING TRIANGLE – INVERTED !
‘Defensive’ Marketing
(Retaining Customers)
(Employees)
SERVICES PRICING
Cost-Based Model
• Cost of Service delivery plus profit margin
Competition-Based Model
• Comparative Market rates for similar services
Demand-based Model
• Value to the Customer – what the Customer is
willing to pay
Price-Quality Equation :
Low price =
Poor quality service
High Price =
Top quality service
Three Basic Pricing Models :
Which Pricing Strategy to adopt ??
PRICING - CHOICE OF DENTIST FOR A ROOT CANAL ??
Dentist Experi-
ence
In Years
Distance/Time
to reach Clinic
Appointment
Availability
Number
of
‘Sittings’
Total
Charges
Dr C. Dubey 5 18 Kms
80 Mins
10 days 3 or 4 Rs. 1650
Dr M. Yadav 8 11 Kms
50 Mins
7 days 3 Rs. 2880
Dr (Ms)
D. Mankad
12 7 Kms
25 mins
4 days 2 Rs. 4650
Dr Y. Sharma 15 3 Kms
15 mins
1 day 2 Rs. 6500
SERVICE QUALITY
LINK BETWEEN SERVICES MARKETING AND
SERVICE QUALITY
“Due to the ‘intangibility’ factor, Customers look for ‘Signals’ of service quality”
“Service marketers try to add ‘tangibility’ to their ‘intangible’ service offers”
SERVICE QUALITY
The customer’s judgment of overall excellence of the service provided in
relation to the quality that was expected.
Service quality assessments are based on ….
• The Service ‘encounter’
• Degree of fulfillment of expectations (outcome quality)
• Ease of doing business (interaction quality)
• Servicescape aspects (physical environment quality)
“Quality is what the Customer says it is….
It is not what the Provider says it is “ !!
DIMENSIONS OF SERVICE QUALITY
Reliability – ability to perform the promised service dependably and consistently
Responsiveness – willingness to help customers and promptness of service
Assurance – knowledge and courtesy ; ability to inspire trust and confidence
Empathy – caring, individualized attention provided to customers
Tangibles – physical facilities, equipment, appearance of personnel
INDICATORS OF SERVICE QUALITY
• Quality is measured by the extent of the satisfaction of the Customer
• It is the Customer’s perception of the service experience
• “Retention of Customers is perhaps the best measure of quality of service”
Aim for 100 % defect-free service …. 98 % is not enough !
There is no other measure !
CUSTOMER CONCERNS
Failure frequency
Downtime
Out-of-pocket costs
Getting short-changed
MANAGING SERVICE QUALITY
THE SERVICE ‘ENCOUNTER’
This is the “Moment of Truth”
• Happens when the service is actually being rendered.
• Or… whenever the customer interacts with the service provider
• Potentially, the most critical factor in determining customer satisfaction
Service Encounters can be :
• Face to Face
• Remote : Skype, Video Conference, phone calls
• Through correspondence : e-mails etc.
Well-managed service encounters …
• Help build customer’s trust and loyalty
• Enhance service quality and Brand value
SERVICE BEHAVIOURS IN SERVICE ENCOUNTERS
Recovery
Adaptability
Spontaneity
Coping
employee response
to service delivery
system failure
employee response
to customer needs
and requests
employee response
to problem customers
unprompted and
unsolicited employee
actions and attitudes
MANAGING SERVICE QUALITY
VersusCustomer’s Expectations
Customer’s perception of
Service delivery
Service Quality isdefined by the Customer
Help
formulate customer
expectations
Measure
expectation
levels
Ensure service
quality is
at or above
expectation
THE ‘GAPS MODEL’ OF SERVICE QUALITY
Word of Mouth
Personal Needs
Past experiences
New version :
7-Gap model
(Gap 5)
THE GAPS MODEL OF SERVICE QUALITY
The Customer Gap
• Gap 5 – Gap between the expected service and the service perceived to be
received
The Provider Gap 1 : The Listening or Knowledge gap
• not knowing what customers expect
The Provider Gap 2 – The Service Design and Standards Gap
• not having the right service designs and standards
The Provider Gap 3 – The Service Performance Gap
• not delivering to the specified service standards
The Provider Gap 4 – The Communication Gap
• not matching performance to promises
2-39
New Concept : 7 Gaps
PROCESS MODEL FOR CLOSING THE GAPS
Gap 5 : Offering meets expectations ?
Gap 1 : Understanding of Customer’s
expectations ?
Gap 2 : Service design to meet
customer’s expectations ?
Gap 3 : Offerings meet service design ?
Gap 4 : Information to Customers
accurate ?
Continue to monitor Customer’s
expectations and perceptions
Market research
Upward communication
Relationship focus
Goal setting ; Service design
Task Standardization
Servicescape
Supervisory controls
Employee-Technology job fit
Teamwork ; HR Policies
Customer ‘education’
Horizontal communication
Propensity to over-promise
= NO
= YES
CLOSING THE SERVICE QUALITY GAPS
Conduct a thorough Gap analysis
Develop and implement strategies to close the Provider Gaps (1 to 4)
• Understand Customer needs
• Examine Company Culture for service orientation
• Employee hiring, motivation, development, empowerment
• Manage customer expectation – communication, advertising, internet…
The Customer Gap (No. 5) closes only when Gaps 1 to 4 are effectively closed !
SERVICE FAILURE AND RECOVERY
“TO ERR IS HUMAN….”
Despite best efforts, service failure is inevitable !
• Service failure occurs when service delivery falls below a
customer’s expectations and leads to customer dissatisfaction.
• Service recovery refers to the actions taken in response to a
service failure.
“Failure is the mother of success”
7-43
UNSATISFIED CUSTOMERS - THE TIP OF THE ICEBERG
Source: Data from TARP Worldwide Inc., 2007
7-44
DISSATISFIED CUSTOMER TYPES
Passives :
Least likely complain directly but spread negative WoM, or complain to third parties
- Actively seek their feedback
Voicers :
Complain promptly, but not likely to spread negative WOM; believe in positive
results – They are our best friends !
Irates :
• Exhibit anger, spread negative WoM, likely to switch service providers – Initiate
recovery strategies
Activists :
• Complain at all levels, third parties, feel alienated, ‘Terrorists’ ! – Dump them
7-45
“If you are happy with our service, tell others…. If not, tell us !”
SERVICE RECOVERY STRATEGIES
Fixing the Customer Fixing the Problem
SERVICE GUARANTEES
Unlike for Products, Services Guarantees are not common
Service Guarantees, if given should be :
• Unconditional
• Meaningful
• Easy to understand
• Easy to invoke
“A service guarantee reduces customers’ sense of risk and builds
confidence in the organization”
THE SERVICE RECOVERY PARADOX
“A good recovery can turn angry, frustrated customers into loyal ones.
..can, in fact, create more goodwill than if things had gone smoothly in
the first place.”
But ….
Only a small percentage of customers actually complain
Service recovery must be SUPERLATIVE
With responsiveness, redress, and empathy/courtesy, and tangible rewards
Service recovery is expensive !
7-48
COST OF POOR SERVICE
• Customers are five times as likely to stop doing business because
of poor service than quality or cost
• 96% never complain ; 90% stop being a customer
• Average unhappy customer tells nine others
• Cost of losing a customer is five times the value of his account
VALUE OF GOOD SERVICE
• Service commands price premium
• Average happy customer tells five others
• Of the unhappy ones, 95% are happy if the problem is resolved quickly
• Costs five times as much to obtain a new customer as keep an existing one
• Good service can help offset product quality
THE BOTTOM LINE…
Customer
Retention
Lower
costs
Price
premium
Word of
mouth
Margins
Profits
Defensive
Marketing
Volume of
purchases
Market
share
Reputation
Sales
Price
premium
Offensive
Marketing
Service
Customer
Acquisition
Cmmi lecture on Services Marketing

Cmmi lecture on Services Marketing

  • 1.
    MARKETING SERVICES IN THE MARITIMEINDUSTRY MANAGING SERVICE QUALITY FOR CUSTOMER SATISFACTION CMMI MONTHLY LECTURE SERIES MUMBAI, 2ND NOVEMBER 2017 CAPT. Y SHARMA FELLOW - CMMI
  • 2.
  • 3.
    PRODUCTS, GOODS, SERVICES… Product •Bundle of physical, service, and symbolic attributes designed to satisfy a customer’s wants and needs Goods • Tangible products that customers can see, hear, smell, taste, or touch Services • Intangible tasks that satisfy the needs of consumers and business users
  • 4.
    DEFINING SERVICES …. “Identifiable,Intangible activities that are the main object of a transaction designed to provide want-satisfaction to customers” Goods–services continuum “Spectrum along which goods and services fall according to their attributes, from pure goods to pure service”
  • 5.
    SERVICE MIX Pure Goods Goodswith accompanying Services Pure Services Hybrid Services with accompanying Goods Other Differentiators : Equipment / People / Customer presence / Processes, etc. Where does the Maritime Industry fit in ?
  • 6.
    SERVICE SECTORS For Profit Trusts Charities NGO’s Businesses Prod/Agri/Service P/LUnits Associations Clubs Co-operatives Non-Profit Not-for-profit Governments / Administrations Cost Centres ?
  • 7.
    SERVICE CONTINUUM Tangible Dominant (ManufacturingSector) • Shopping Experience • After-sales Service • Warranties • Installation • Use Support Intangible Dominant (Service Sector) • Give-aways • Reading Material • Uniforms • Dress-code • ‘Productizing’ Key Challenge : Managing the Intangibles (provides competitive advantage) Key Challenge : ‘Tangiblizing’ the intangibles (Drives customer demand)
  • 8.
    FOUR DISTINCTIVE CHARACTERISTICS…. Intangibility Inseparability Variability Perishability Customer cannot experience the ‘product’ prior purchase Non-measurable ‘Product’ cannot be stored or ‘inventorized’ for later use Need to manage demand fluctuation Difficult to establish consistency in quality across providers, time, etc. Complex variety Production and consumption happen at the same place and time Customer is part of the process Heterogeneity
  • 9.
    ‘SERVICESCAPE’ – PHYSICALEVIDENCE Facility Exterior • Accessibility • Exterior design • Signage • Parking • Landscape • Surrounding environment Facility Interior • Interior design • Equipment • Signage & Layout • Air quality • Temp / Humidity • Colours / Lighting • Noises • Smells Other Tangibles • Business cards • Stationery • Billing statements • Reports • Employee dress • Uniforms • Brochures • Internet/Web “Totality of the ambience and physical environment in which a service is performed, delivered and consumed”
  • 10.
  • 11.
    WHAT IS MARKETING? • The process of creating and delivering goods and services to the customer • Involves all the activities associated with winning and retaining loyal customers • Understanding the target customer’s needs / wants / demands • Offering services that will satisfy those needs... • Providing the customer with quality service, convenience, and value A Customer’s ‘Needs’ generate the ‘Wants’. Aim of Marketing is to convert ‘Wants’ to ‘Demands’
  • 12.
    UNDERSTANDING MARKETING - THEICEBERG PRINCIPLE: Product/Service, Price, Distribution Advertising, Promotion
  • 13.
    UNDERSTANDING MARKETING – THEICEBERG PRINCIPLE: Segmentation, Targeting, Positioning Threat of New Entrants, Stage of Firm Possible Competitive reactions, Technological Innovation, Activity Systems within Firm, Customer Acquisition and Retention Costs, Management Cohesion and Risk Propensity, Culture, etc. Need to know the key indicators to understand the ‘Marketing Mix’
  • 14.
    THE 5 C’SOF MARKETING Customer Needs • What needs from which clients do we need to satisfy ? Company Skills • What special competencies do we possess to meet those needs ? Competition • Who competes with us in meeting those needs ? Collaborators • Who should we enlist to help us and how do we motivate them ? Context • What cultural / technological / legal factors limit what is possible ?
  • 15.
    Framework for FormulatingMarketing Strategy Customers Company Competitors Collaborators Marketing Analysis (The 5 C’s) Market Segmentation Target Market Selection Prod / Service Positioning Marketing Mix (The 4 P’s) Product/Service Place / Channels Promotion Pricing Customer acquisition Customer retention Profits !! Creating Value Capturing Value Sustaining Value Context Adapted from Robert Dolan
  • 16.
    THE CUSTOMER IS. . . Anyone who receives the company’s services, including : External customers • Outside the organization, business customers, suppliers, partners, end consumers Internal customers • inside the organization, e.g., other departments, fellow employees
  • 17.
    FACTORS INFLUENCING CUSTOMERSATISFACTION • Product / Service quality • Price • Specific product or service features • Reliability , Credibility • Consumer emotions – ‘Positive Strokes’ / Recognition • Accurate information • Perceptions of equity or fairness • Other consumers, family members, and co-workers • Personal factors • Situational factors – Ease of access
  • 18.
  • 19.
    DEFINITION “Activity or benefitthat one party can offer to another that is essentially intangible and does not result in the ownership of anything. Its production may or may not be tied to a physical product”
  • 20.
  • 21.
    ZONE OF TOLERANCE DESIRED SERVICE ZONEOF TOLERANCE ADEQUATE SERVICE ! Zone varies across different service dimensions !
  • 22.
    STANDARDS OF SERVICE Customer defined Supplier defined Specifiedand Expressed Hard Standards (Unit-based measures) As offered by Vendor Unspecified but Expected Soft Standards (Opinion-based measures) Do they really matter ??
  • 23.
    CHALLENGES IN SERVICEMARKETING Giving a feel for the “product” Managing Customer Relationships Managing Demand Fluctuations Maintaining Service Quality Cost Containment Mental blocks in applying proven marketing concepts for service marketing
  • 24.
    THE SERVICES MARKETINGTRIANGLE ‘Offensive’ Marketing (Attracting Customers) (Employees)
  • 25.
    SERVICES MARKETING TRIANGLE– INVERTED ! ‘Defensive’ Marketing (Retaining Customers) (Employees)
  • 26.
    SERVICES PRICING Cost-Based Model •Cost of Service delivery plus profit margin Competition-Based Model • Comparative Market rates for similar services Demand-based Model • Value to the Customer – what the Customer is willing to pay Price-Quality Equation : Low price = Poor quality service High Price = Top quality service Three Basic Pricing Models : Which Pricing Strategy to adopt ??
  • 27.
    PRICING - CHOICEOF DENTIST FOR A ROOT CANAL ?? Dentist Experi- ence In Years Distance/Time to reach Clinic Appointment Availability Number of ‘Sittings’ Total Charges Dr C. Dubey 5 18 Kms 80 Mins 10 days 3 or 4 Rs. 1650 Dr M. Yadav 8 11 Kms 50 Mins 7 days 3 Rs. 2880 Dr (Ms) D. Mankad 12 7 Kms 25 mins 4 days 2 Rs. 4650 Dr Y. Sharma 15 3 Kms 15 mins 1 day 2 Rs. 6500
  • 28.
  • 29.
    LINK BETWEEN SERVICESMARKETING AND SERVICE QUALITY “Due to the ‘intangibility’ factor, Customers look for ‘Signals’ of service quality” “Service marketers try to add ‘tangibility’ to their ‘intangible’ service offers”
  • 30.
    SERVICE QUALITY The customer’sjudgment of overall excellence of the service provided in relation to the quality that was expected. Service quality assessments are based on …. • The Service ‘encounter’ • Degree of fulfillment of expectations (outcome quality) • Ease of doing business (interaction quality) • Servicescape aspects (physical environment quality) “Quality is what the Customer says it is…. It is not what the Provider says it is “ !!
  • 31.
    DIMENSIONS OF SERVICEQUALITY Reliability – ability to perform the promised service dependably and consistently Responsiveness – willingness to help customers and promptness of service Assurance – knowledge and courtesy ; ability to inspire trust and confidence Empathy – caring, individualized attention provided to customers Tangibles – physical facilities, equipment, appearance of personnel
  • 32.
    INDICATORS OF SERVICEQUALITY • Quality is measured by the extent of the satisfaction of the Customer • It is the Customer’s perception of the service experience • “Retention of Customers is perhaps the best measure of quality of service” Aim for 100 % defect-free service …. 98 % is not enough ! There is no other measure !
  • 33.
  • 34.
  • 35.
    THE SERVICE ‘ENCOUNTER’ Thisis the “Moment of Truth” • Happens when the service is actually being rendered. • Or… whenever the customer interacts with the service provider • Potentially, the most critical factor in determining customer satisfaction Service Encounters can be : • Face to Face • Remote : Skype, Video Conference, phone calls • Through correspondence : e-mails etc. Well-managed service encounters … • Help build customer’s trust and loyalty • Enhance service quality and Brand value
  • 36.
    SERVICE BEHAVIOURS INSERVICE ENCOUNTERS Recovery Adaptability Spontaneity Coping employee response to service delivery system failure employee response to customer needs and requests employee response to problem customers unprompted and unsolicited employee actions and attitudes
  • 37.
    MANAGING SERVICE QUALITY VersusCustomer’sExpectations Customer’s perception of Service delivery Service Quality isdefined by the Customer Help formulate customer expectations Measure expectation levels Ensure service quality is at or above expectation
  • 38.
    THE ‘GAPS MODEL’OF SERVICE QUALITY Word of Mouth Personal Needs Past experiences New version : 7-Gap model (Gap 5)
  • 39.
    THE GAPS MODELOF SERVICE QUALITY The Customer Gap • Gap 5 – Gap between the expected service and the service perceived to be received The Provider Gap 1 : The Listening or Knowledge gap • not knowing what customers expect The Provider Gap 2 – The Service Design and Standards Gap • not having the right service designs and standards The Provider Gap 3 – The Service Performance Gap • not delivering to the specified service standards The Provider Gap 4 – The Communication Gap • not matching performance to promises 2-39 New Concept : 7 Gaps
  • 40.
    PROCESS MODEL FORCLOSING THE GAPS Gap 5 : Offering meets expectations ? Gap 1 : Understanding of Customer’s expectations ? Gap 2 : Service design to meet customer’s expectations ? Gap 3 : Offerings meet service design ? Gap 4 : Information to Customers accurate ? Continue to monitor Customer’s expectations and perceptions Market research Upward communication Relationship focus Goal setting ; Service design Task Standardization Servicescape Supervisory controls Employee-Technology job fit Teamwork ; HR Policies Customer ‘education’ Horizontal communication Propensity to over-promise = NO = YES
  • 41.
    CLOSING THE SERVICEQUALITY GAPS Conduct a thorough Gap analysis Develop and implement strategies to close the Provider Gaps (1 to 4) • Understand Customer needs • Examine Company Culture for service orientation • Employee hiring, motivation, development, empowerment • Manage customer expectation – communication, advertising, internet… The Customer Gap (No. 5) closes only when Gaps 1 to 4 are effectively closed !
  • 42.
  • 43.
    “TO ERR ISHUMAN….” Despite best efforts, service failure is inevitable ! • Service failure occurs when service delivery falls below a customer’s expectations and leads to customer dissatisfaction. • Service recovery refers to the actions taken in response to a service failure. “Failure is the mother of success” 7-43
  • 44.
    UNSATISFIED CUSTOMERS -THE TIP OF THE ICEBERG Source: Data from TARP Worldwide Inc., 2007 7-44
  • 45.
    DISSATISFIED CUSTOMER TYPES Passives: Least likely complain directly but spread negative WoM, or complain to third parties - Actively seek their feedback Voicers : Complain promptly, but not likely to spread negative WOM; believe in positive results – They are our best friends ! Irates : • Exhibit anger, spread negative WoM, likely to switch service providers – Initiate recovery strategies Activists : • Complain at all levels, third parties, feel alienated, ‘Terrorists’ ! – Dump them 7-45 “If you are happy with our service, tell others…. If not, tell us !”
  • 46.
    SERVICE RECOVERY STRATEGIES Fixingthe Customer Fixing the Problem
  • 47.
    SERVICE GUARANTEES Unlike forProducts, Services Guarantees are not common Service Guarantees, if given should be : • Unconditional • Meaningful • Easy to understand • Easy to invoke “A service guarantee reduces customers’ sense of risk and builds confidence in the organization”
  • 48.
    THE SERVICE RECOVERYPARADOX “A good recovery can turn angry, frustrated customers into loyal ones. ..can, in fact, create more goodwill than if things had gone smoothly in the first place.” But …. Only a small percentage of customers actually complain Service recovery must be SUPERLATIVE With responsiveness, redress, and empathy/courtesy, and tangible rewards Service recovery is expensive ! 7-48
  • 49.
    COST OF POORSERVICE • Customers are five times as likely to stop doing business because of poor service than quality or cost • 96% never complain ; 90% stop being a customer • Average unhappy customer tells nine others • Cost of losing a customer is five times the value of his account
  • 50.
    VALUE OF GOODSERVICE • Service commands price premium • Average happy customer tells five others • Of the unhappy ones, 95% are happy if the problem is resolved quickly • Costs five times as much to obtain a new customer as keep an existing one • Good service can help offset product quality
  • 51.
    THE BOTTOM LINE… Customer Retention Lower costs Price premium Wordof mouth Margins Profits Defensive Marketing Volume of purchases Market share Reputation Sales Price premium Offensive Marketing Service Customer Acquisition