1
2
SAMPLE SIZE CALCULATIONS
PRESENTED BY:
Dr. KAJAL MEHTA
PG RESIDENT
GUIDED BY:
PROF. DR. RABINDRA MAN SHRESTHA
ASSO. PROF. DR. JYOTI DHAKAL
DR. SUJITA SHRESTHA
DR. SUNITA KHANAL
(Dept. of Community Dentistry)
DEPARTMENT OF ORTHODONTICS, KANTIPUR DENTAL COLLEGE
3
In research methodology:
-Sample size calculations
-Study design
-Sampling technique
-Preparing the protocols
-Collection and presentation of data
4
OBJECTIVES
To understand
What is sample and population?
 Different sampling technique
Different type of Study design
What is sample size determination?
How large a sample do we need?
Different method of calculating sample size
5
SAMPLE AND POPULATION?
6
SAMPLING
Is the process or technique of selecting a sample of
appropriate & manageable size for study
7
SAMPLING METHOD
1. Non-probability sampling
a) Quota Sampling
b) Purposive Sampling
c) Convenience Sampling
2. Probability Sampling
a) Simple random sampling
b) Systematic Sampling
c) Stratified Sampling
3. Other Sampling method
a) Multiphase Sampling
b) Multistage Sampling
DIFFERENT TYPES OF STUDY DESIGN
Epidemiological study
8
Descriptive Analytical
Case report
Case series
Cross sectional
Ecological
Observational Interventional
Cross sectional
Ecological
Case control
Cohort
Quasi-
experimental
Trial
Clinical trial
Field trial
Community trial
9
WHAT IS SAMPLE SIZE DETERMINATION?
Is the mathematical estimation of the number of
subjects/units to be included in a study.
Optimum sample size determination is required for following
reason:
a) to allow for appropriate analysis
b) to provide the desired level of accuracy
c) to allow validity of significance test
10
HOW LARGE A SAMPLE DO WE NEED?
If the sample is too small:
Even a well conducted study may fail to answer it’s research
question
may fail to detect important effects or associations
 can not generalize the result in the affected population
11
CONVERSELY
If the sample size is too large:
The study will be difficult & costly
Time constraint
Loss of accuracy
Hence, optimum sample size must be determined before
commencement of a study.
12
WHEN TO CALCULATE SAMPLE SIZE?
 It should be calculated when the protocol for study is
being prepared
 As it helps in determination if the study is feasible, ethical,
and scientifically sound
13
TERMINOLOGIES
Hypothesis testing starts with the assumption of no difference
between groups or no relationship between variables in the
population— which is null hypothesis
Alternative hypothesis, is an actual difference between groups or a
true relationship between variables.
Hypothesis is an assumption that is made based on some evidence.
In conducting any kind of research, two types of errors, i.e., Type I and
Type II error.
Type I Error occurs when null hypothesis is true in reality and a significant
result is obtained (null hypothesis is rejected).
Type II Error occurs when null hypothesis is false in reality and a non-
significant result is found ( null hypothesis is accepted).
Probability of conducting Type I error is alpha (α) error, (the level of
significance)
whereas
Probability of making Type II error is beta (β) error.
TYPES OF ERRORS
14
15
 is an ability to see the existence of treatment effect in a study.
 Probability of type II error is beta
 value of 1 – beta (1 – β) is power of the test.
 Power is the probability of correctly rejecting a null hypothesis
POWER
16
Higher the power
larger the sample size
lower are the chances of
missing a real effect.
Z values for conventional values of beta
Beta Z (1-)
0.20(power 80%) 0.842
0.10(power 90%) 1.28
0.05(power (95%) 1.64
0.01(power(99%) 2.33
17
CONFIDENCE LEVEL
 Confidence level tell how sure we can be that our data is accurate
 is expressed as a percentage
 For example, if confidence level is 90%, results will most likely be 90%
accurate
18
EFFECT SIZE
 It is a standardized difference between the mean of a group & the
overall mean
=
19
HOW TO ESTIMATE EFFECT SIZE
 Use background information in the form of similar studies to get
means and variation, then calculate effect size directly
 With no prior information, make an estimated guess on the effect
size expected
20
 Is the degree of accuracy or precision of our estimate
 Represents the maximum amount that our estimate can differ from
the true population parameter, given a certain level of confidence
MARGIN OF ERROR
For example,
Suppose there is 40% prevalence of anaemia study sample & we set
margin of error of as 5%;
It means that range of anaemia in population would be between 40+- 5
i.e., 35% & 45%
21
STANDARD DEVIATION
 is the measure of the dispersion of a data set from its mean
The higher the dispersion or variability
the greater the standard deviation
the greater the magnitude of the deviation
i.e. Dispersion/variance Standard Deviation
22
Standard deviation can be calculated as:
= score for each point in data
= mean of the scores
n= number of observations or cases
23
PREREQUISITES OF SAMPLE SIZE CALCULATIONS
1. What is the study design?
2. What kind of primary outcome variable is there?
3. What is the desired level of significance (α) and
Confidence Interval
24
WHAT KIND OF PRIMARY OUTCOME VARIABLE IS
THERE?
25
WHAT IS THE DESIRED LEVEL OF SIGNIFICANCE (Α)
AND CONFIDENCE INTERVAL
 Level of significance (alpha, α) has to be assumed by the researcher.
 If researcher is considering 5% level of significance at the time of
sample size calculation, we will be able to interpret results with 95%
confidence.
 By fixing 5% level of significance, then we are taking type I error into
account, which means that there might be 5% chance of rejecting null
hypothesis when in fact it is true
26
SAMPLE SIZE CALCULATIONS
27
PROCEDURE FOR CALCULATING SAMPLE SIZE
Three procedures:
Use of formulae
Readymade table
Computer software
28
USE OF FORMULAE
29
CROSS-SECTIONAL STUDY
 In such studies, data are collected at a particular time to answer
questions about the status of population at that particular time
 Such studies include questionnaires, disease prevalence surveys etc
 Usually involves estimation of prevalence and estimation of mean
30
STATISTICAL FORMULA FOR PROPORTION AND
PREVALENCE
n=
where
z= confidence level at 95% (standard value of 1.96)
p= Estimated prevalence or proportions of project area
d= Margin of error (has to be decided by researcher.)
in error
sample size
31
FOR EXAMPLE
A researcher wants to calculate the sample size for a cross-sectional
study to know prevalence/proportion of asthma in traffic police in a
city,
And as per the previously published study, the value of prevalence of
asthma in traffic police in the city is around 10%, and the researcher
wants to calculate sample size with the margin of error of 5% and
type-1 error of 5%.
Where, Z will be 1.96,
p = 0.10 (percentage converted into the proportion)
d will be 0.05
32
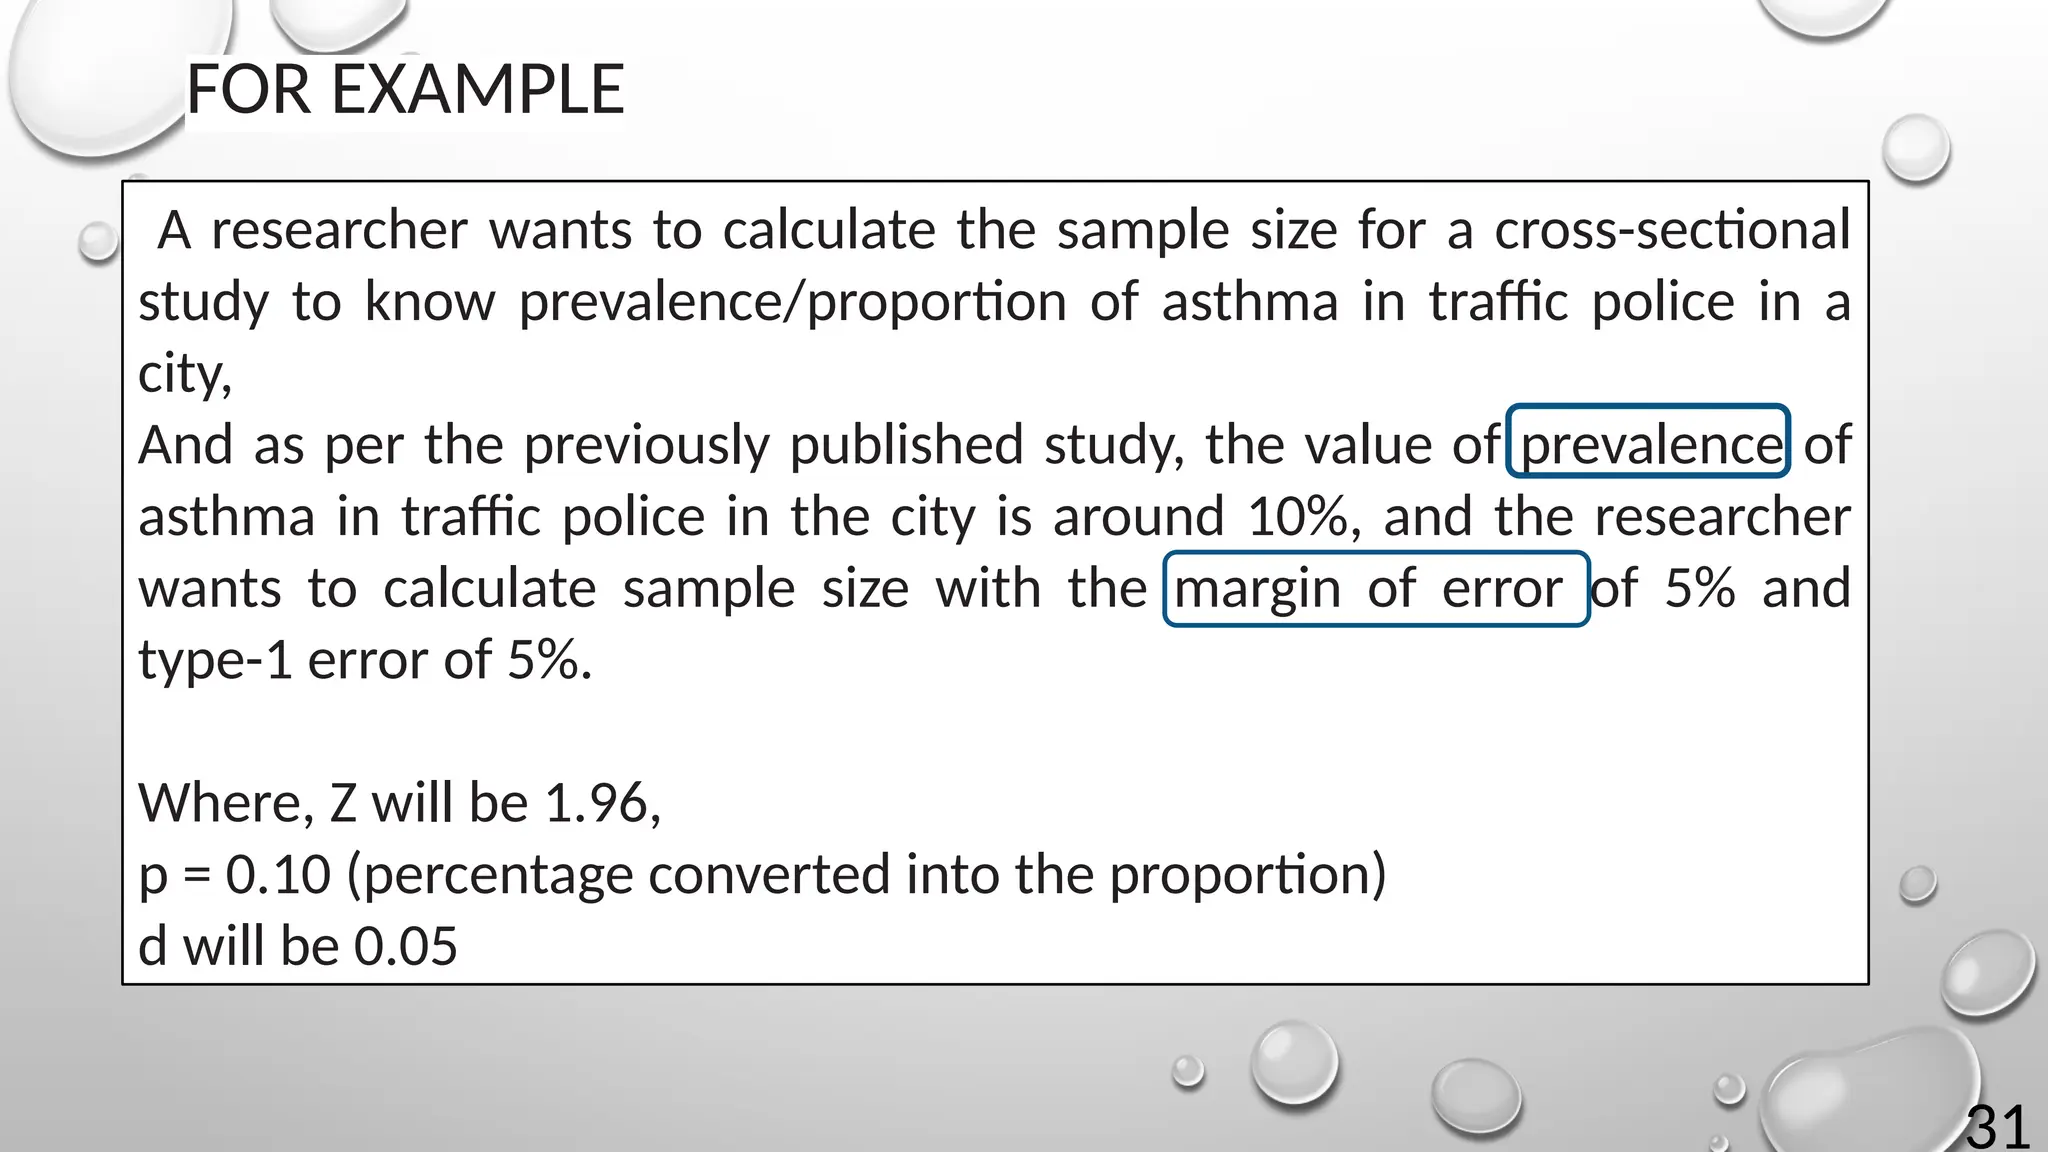
Hence by putting the values in the above-mentioned formula,
 Sample size= = 276
This sample size can be adjusted for the non-response/dropout
rate.
If nonresponse rate of 10% is expected then as per the formula,
Adjusted sample size (N1) = n/(1-d)
Where N1 is adjusted sample size
n is required sample size, and d is dropout rate.
Corrected sample size = 276/([1– (10/100)] = 307
So, total of 307 traffic police men need to be screened for asthma
for this study
33
Sample size =
Z
= is standard normal variate
SD = Standard deviation of variable. Value of standard deviation can be
taken from previously done study
d = absolute error
If the study involves estimation of mean in cross sectional study, then
the formula for sample size calculation will be mentioned below
SAMPLE SIZE FOR THE MEAN:
34
FOR EXAMPLE
If the researcher is interested in knowing the average systolic blood
pressure in pediatric age group of that city at 5% of type1 error and
error of 5 mmHg of either side (more or less than mean systolic BP)
and standard deviation, based on previously done studies, is 25
mmHg then formula for sample size calculation will be
Sample size =
Thus, the sample size needed for this study will be 96.
It can be adjusted as per the expected dropout rate.
35
CLINICAL TRIALS
 is the type of research that studies new tests and treatments
 evaluates their effects on human health outcome
In this type of study, the researcher could be calculating,
• Either difference between the proportion of two groups
OR
• Difference between quantitative endpoint, that is the mean
between two groups
36
If the clinical trial involves estimation of qualitative end point
between two groups, that is the difference between
proportions, then,
Sample Size =
Where value of Zα is the standard normal variate is 1.96 at
5% error
Zβ is 0.842 at 80% power (Table)
p1–p2 is the effect size (the expected difference between two groups)
P = prevalence calculated by adding prevalence is group 1 and
prevalence in group 2 and then dividing the sum by 2
37
If in clinical trial, the estimation of the difference of quantitative
endpoint between two groups is the objective, then sample size
calculation is
Sample Size =
Where, Zα is the standard normal variate is 1.96 at 5% error
Zβ is 0.842 at 80% power
SD is Standard deviation
SAMPLE SIZE CALCULATION FOR CASE CONTROL
STUDIES
In case control studies cases (the group with disease/condition under
consideration) are compared with controls ( the group without disease)
regarding exposure to the risk factor.
FOR QUALITATIVE VARIABLE
Sample size=
r= Ratio of control to cases
P*= Average proportion exposed = proportion of exposed cases + proportion
of control exposed/2
= standard normal variate for power= for 80% power it is 0.84 (from table)
Z = standard normal variate for level of significance
P1
-p2
= Effect size or different in proportion expected based on previous
studies. P1
is proportion in cases & p2
is proportion in control
FOR QUANTITATIVE VARIABLE
Sample size=
SD=Standard Deviation= researcher can take value from previously
published studies
d= Expected mean difference between case and control (from
previously published studies)
r, & Zare already explained in previous study
SAMPLE SIZE CALCULATION OF COHORT STUDY
In Cohort study, healthy subjects with or without exposure to some
risk factor are observed over a time period to see the event rate in
both groups.
43
USE OF TABLE
44
READYMADE TABLE
 Can be used at a given population size, a specific margin of
error & a desired confidence interval
45
If we have 5000 population.
we want to sample a sufficient number with 95% confidence
interval that predicted the proportion who would be repeat
customers within plus or minus 2.5%, you would need responses
from a (random) sample of 1176 of all your customers
For example
47
COMPUTER SOFTWARE
48
G-POWER SOFTWARE
 is a tool to compute statistical power analyses for
different types of test.
 Also used to compute effect sizes and to display
graphically the results of power analyses.
 Three basics step:
 Select appropriate test
 Input parameters
 Determine effect size
50
SUMMARY
Three procedures for sample size calculations:
Use of formulae
Readymade table
Computer software
S.N. Component What is it? Where to find it?
1. Type-1 error
( error)
False +ve result due to probability
of falsely detecting the difference
when there is no actual difference
Usually taken as 0.05 or 0.01
2. Power(1-) Probability of correctly rejecting
the null hypothesis
Usually taken above 80%
3. Effect size The smallest clinically relevant
difference in the outcome
From previous studies, pilot
studies or by experience of
researcher
4. standard
deviation
How dispersed or spread out the
data values are.
From previous studies, pilot
studies or by experience of
researcher
5. Dropout rate Anticipated percentage of patient
that do not complete the study
From previous studies, pilot
studies or by experience of
researcher
DIFFERENT COMPONENT THAT EFFECT THE SAMPLE SIZE
52
CONCLUSION
Sample size calculation is always an essential step during
the planning of scientific studies.
An insufficient sample size may not be able to demonstrate
the desired difference, or estimate the frequency of the
event of interest with acceptable precision
A very large sample may add to the complexity of the
study, and its associated costs, rendering it unfeasible.
53
REFERENCES
1. Das S, Mitra K, Mandal M. Sample size calculation: Basic principles. Indian J Anaesth. 2016
Sep;60(9):652-656. doi: 10.4103/0019-5049.190621. PMID: 27729692; PMCID: PMC5037946.
2. Rodríguez Del Águila M, González-Ramírez A. Sample size calculation. Allergol Immunopathol
(Madr). 2014 Sep-Oct;42(5):485-92. doi: 10.1016/j.aller.2013.03.008. Epub 2013 Nov 23. PMID:
24280317.
3. The Research Advisors: Research Methodology, Study Design & Statistical Analysis (research-
advisors.com)
4. Kang H. Sample size determination and power analysis using the G*Power software. J Educ Eval
Health Prof. 2021;18:17. doi: 10.3352/jeehp.2021.18.17. Epub 2021 Jul 30. PMID: 34325496;
PMCID: PMC8441096.
5. https://www.researchgate.net/publication/
350836701_Sample_Size_Calculation_in_Medical_Research_A_Primer
6. https://www.researchgate.net/publication/343860693_Epidemiological_study_designs-
_Examples_of_medical_sciences
7. Hiremath SS. Textbook of preventive and community dentistry. Elsevier India; 2011 Aug 15.
54
55
56
DIFFERENCE BETWEEN MARGIN OF ERROR AND SD
Margin of error Standard error
- Is a statistical measure that
accounts for the degree of
error received from the
outcome of your research
sample
- Measures the accuracy of
representation of population
sample to the mean using SD
of the set data.
-goal is to estimate how much
allowable difference can exist
between the research
population & sample size
-Purpose is to measure the
spread of random variables
within the data set

sample size calculations in different types of study..pptx

  • 1.
  • 2.
    2 SAMPLE SIZE CALCULATIONS PRESENTEDBY: Dr. KAJAL MEHTA PG RESIDENT GUIDED BY: PROF. DR. RABINDRA MAN SHRESTHA ASSO. PROF. DR. JYOTI DHAKAL DR. SUJITA SHRESTHA DR. SUNITA KHANAL (Dept. of Community Dentistry) DEPARTMENT OF ORTHODONTICS, KANTIPUR DENTAL COLLEGE
  • 3.
    3 In research methodology: -Samplesize calculations -Study design -Sampling technique -Preparing the protocols -Collection and presentation of data
  • 4.
    4 OBJECTIVES To understand What issample and population?  Different sampling technique Different type of Study design What is sample size determination? How large a sample do we need? Different method of calculating sample size
  • 5.
  • 6.
    6 SAMPLING Is the processor technique of selecting a sample of appropriate & manageable size for study
  • 7.
    7 SAMPLING METHOD 1. Non-probabilitysampling a) Quota Sampling b) Purposive Sampling c) Convenience Sampling 2. Probability Sampling a) Simple random sampling b) Systematic Sampling c) Stratified Sampling 3. Other Sampling method a) Multiphase Sampling b) Multistage Sampling
  • 8.
    DIFFERENT TYPES OFSTUDY DESIGN Epidemiological study 8 Descriptive Analytical Case report Case series Cross sectional Ecological Observational Interventional Cross sectional Ecological Case control Cohort Quasi- experimental Trial Clinical trial Field trial Community trial
  • 9.
    9 WHAT IS SAMPLESIZE DETERMINATION? Is the mathematical estimation of the number of subjects/units to be included in a study. Optimum sample size determination is required for following reason: a) to allow for appropriate analysis b) to provide the desired level of accuracy c) to allow validity of significance test
  • 10.
    10 HOW LARGE ASAMPLE DO WE NEED? If the sample is too small: Even a well conducted study may fail to answer it’s research question may fail to detect important effects or associations  can not generalize the result in the affected population
  • 11.
    11 CONVERSELY If the samplesize is too large: The study will be difficult & costly Time constraint Loss of accuracy Hence, optimum sample size must be determined before commencement of a study.
  • 12.
    12 WHEN TO CALCULATESAMPLE SIZE?  It should be calculated when the protocol for study is being prepared  As it helps in determination if the study is feasible, ethical, and scientifically sound
  • 13.
    13 TERMINOLOGIES Hypothesis testing startswith the assumption of no difference between groups or no relationship between variables in the population— which is null hypothesis Alternative hypothesis, is an actual difference between groups or a true relationship between variables. Hypothesis is an assumption that is made based on some evidence.
  • 14.
    In conducting anykind of research, two types of errors, i.e., Type I and Type II error. Type I Error occurs when null hypothesis is true in reality and a significant result is obtained (null hypothesis is rejected). Type II Error occurs when null hypothesis is false in reality and a non- significant result is found ( null hypothesis is accepted). Probability of conducting Type I error is alpha (α) error, (the level of significance) whereas Probability of making Type II error is beta (β) error. TYPES OF ERRORS 14
  • 15.
    15  is anability to see the existence of treatment effect in a study.  Probability of type II error is beta  value of 1 – beta (1 – β) is power of the test.  Power is the probability of correctly rejecting a null hypothesis POWER
  • 16.
    16 Higher the power largerthe sample size lower are the chances of missing a real effect. Z values for conventional values of beta Beta Z (1-) 0.20(power 80%) 0.842 0.10(power 90%) 1.28 0.05(power (95%) 1.64 0.01(power(99%) 2.33
  • 17.
    17 CONFIDENCE LEVEL  Confidencelevel tell how sure we can be that our data is accurate  is expressed as a percentage  For example, if confidence level is 90%, results will most likely be 90% accurate
  • 18.
    18 EFFECT SIZE  Itis a standardized difference between the mean of a group & the overall mean =
  • 19.
    19 HOW TO ESTIMATEEFFECT SIZE  Use background information in the form of similar studies to get means and variation, then calculate effect size directly  With no prior information, make an estimated guess on the effect size expected
  • 20.
    20  Is thedegree of accuracy or precision of our estimate  Represents the maximum amount that our estimate can differ from the true population parameter, given a certain level of confidence MARGIN OF ERROR For example, Suppose there is 40% prevalence of anaemia study sample & we set margin of error of as 5%; It means that range of anaemia in population would be between 40+- 5 i.e., 35% & 45%
  • 21.
    21 STANDARD DEVIATION  isthe measure of the dispersion of a data set from its mean The higher the dispersion or variability the greater the standard deviation the greater the magnitude of the deviation i.e. Dispersion/variance Standard Deviation
  • 22.
    22 Standard deviation canbe calculated as: = score for each point in data = mean of the scores n= number of observations or cases
  • 23.
    23 PREREQUISITES OF SAMPLESIZE CALCULATIONS 1. What is the study design? 2. What kind of primary outcome variable is there? 3. What is the desired level of significance (α) and Confidence Interval
  • 24.
    24 WHAT KIND OFPRIMARY OUTCOME VARIABLE IS THERE?
  • 25.
    25 WHAT IS THEDESIRED LEVEL OF SIGNIFICANCE (Α) AND CONFIDENCE INTERVAL  Level of significance (alpha, α) has to be assumed by the researcher.  If researcher is considering 5% level of significance at the time of sample size calculation, we will be able to interpret results with 95% confidence.  By fixing 5% level of significance, then we are taking type I error into account, which means that there might be 5% chance of rejecting null hypothesis when in fact it is true
  • 26.
  • 27.
    27 PROCEDURE FOR CALCULATINGSAMPLE SIZE Three procedures: Use of formulae Readymade table Computer software
  • 28.
  • 29.
    29 CROSS-SECTIONAL STUDY  Insuch studies, data are collected at a particular time to answer questions about the status of population at that particular time  Such studies include questionnaires, disease prevalence surveys etc  Usually involves estimation of prevalence and estimation of mean
  • 30.
    30 STATISTICAL FORMULA FORPROPORTION AND PREVALENCE n= where z= confidence level at 95% (standard value of 1.96) p= Estimated prevalence or proportions of project area d= Margin of error (has to be decided by researcher.) in error sample size
  • 31.
    31 FOR EXAMPLE A researcherwants to calculate the sample size for a cross-sectional study to know prevalence/proportion of asthma in traffic police in a city, And as per the previously published study, the value of prevalence of asthma in traffic police in the city is around 10%, and the researcher wants to calculate sample size with the margin of error of 5% and type-1 error of 5%. Where, Z will be 1.96, p = 0.10 (percentage converted into the proportion) d will be 0.05
  • 32.
    32 Hence by puttingthe values in the above-mentioned formula,  Sample size= = 276 This sample size can be adjusted for the non-response/dropout rate. If nonresponse rate of 10% is expected then as per the formula, Adjusted sample size (N1) = n/(1-d) Where N1 is adjusted sample size n is required sample size, and d is dropout rate. Corrected sample size = 276/([1– (10/100)] = 307 So, total of 307 traffic police men need to be screened for asthma for this study
  • 33.
    33 Sample size = Z =is standard normal variate SD = Standard deviation of variable. Value of standard deviation can be taken from previously done study d = absolute error If the study involves estimation of mean in cross sectional study, then the formula for sample size calculation will be mentioned below SAMPLE SIZE FOR THE MEAN:
  • 34.
    34 FOR EXAMPLE If theresearcher is interested in knowing the average systolic blood pressure in pediatric age group of that city at 5% of type1 error and error of 5 mmHg of either side (more or less than mean systolic BP) and standard deviation, based on previously done studies, is 25 mmHg then formula for sample size calculation will be Sample size = Thus, the sample size needed for this study will be 96. It can be adjusted as per the expected dropout rate.
  • 35.
    35 CLINICAL TRIALS  isthe type of research that studies new tests and treatments  evaluates their effects on human health outcome In this type of study, the researcher could be calculating, • Either difference between the proportion of two groups OR • Difference between quantitative endpoint, that is the mean between two groups
  • 36.
    36 If the clinicaltrial involves estimation of qualitative end point between two groups, that is the difference between proportions, then, Sample Size = Where value of Zα is the standard normal variate is 1.96 at 5% error Zβ is 0.842 at 80% power (Table) p1–p2 is the effect size (the expected difference between two groups) P = prevalence calculated by adding prevalence is group 1 and prevalence in group 2 and then dividing the sum by 2
  • 37.
    37 If in clinicaltrial, the estimation of the difference of quantitative endpoint between two groups is the objective, then sample size calculation is Sample Size = Where, Zα is the standard normal variate is 1.96 at 5% error Zβ is 0.842 at 80% power SD is Standard deviation
  • 38.
    SAMPLE SIZE CALCULATIONFOR CASE CONTROL STUDIES In case control studies cases (the group with disease/condition under consideration) are compared with controls ( the group without disease) regarding exposure to the risk factor.
  • 39.
    FOR QUALITATIVE VARIABLE Samplesize= r= Ratio of control to cases P*= Average proportion exposed = proportion of exposed cases + proportion of control exposed/2 = standard normal variate for power= for 80% power it is 0.84 (from table) Z = standard normal variate for level of significance P1 -p2 = Effect size or different in proportion expected based on previous studies. P1 is proportion in cases & p2 is proportion in control
  • 40.
    FOR QUANTITATIVE VARIABLE Samplesize= SD=Standard Deviation= researcher can take value from previously published studies d= Expected mean difference between case and control (from previously published studies) r, & Zare already explained in previous study
  • 41.
    SAMPLE SIZE CALCULATIONOF COHORT STUDY In Cohort study, healthy subjects with or without exposure to some risk factor are observed over a time period to see the event rate in both groups.
  • 43.
  • 44.
    44 READYMADE TABLE  Canbe used at a given population size, a specific margin of error & a desired confidence interval
  • 45.
  • 46.
    If we have5000 population. we want to sample a sufficient number with 95% confidence interval that predicted the proportion who would be repeat customers within plus or minus 2.5%, you would need responses from a (random) sample of 1176 of all your customers For example
  • 47.
  • 48.
    48 G-POWER SOFTWARE  isa tool to compute statistical power analyses for different types of test.  Also used to compute effect sizes and to display graphically the results of power analyses.  Three basics step:  Select appropriate test  Input parameters  Determine effect size
  • 50.
    50 SUMMARY Three procedures forsample size calculations: Use of formulae Readymade table Computer software
  • 51.
    S.N. Component Whatis it? Where to find it? 1. Type-1 error ( error) False +ve result due to probability of falsely detecting the difference when there is no actual difference Usually taken as 0.05 or 0.01 2. Power(1-) Probability of correctly rejecting the null hypothesis Usually taken above 80% 3. Effect size The smallest clinically relevant difference in the outcome From previous studies, pilot studies or by experience of researcher 4. standard deviation How dispersed or spread out the data values are. From previous studies, pilot studies or by experience of researcher 5. Dropout rate Anticipated percentage of patient that do not complete the study From previous studies, pilot studies or by experience of researcher DIFFERENT COMPONENT THAT EFFECT THE SAMPLE SIZE
  • 52.
    52 CONCLUSION Sample size calculationis always an essential step during the planning of scientific studies. An insufficient sample size may not be able to demonstrate the desired difference, or estimate the frequency of the event of interest with acceptable precision A very large sample may add to the complexity of the study, and its associated costs, rendering it unfeasible.
  • 53.
    53 REFERENCES 1. Das S,Mitra K, Mandal M. Sample size calculation: Basic principles. Indian J Anaesth. 2016 Sep;60(9):652-656. doi: 10.4103/0019-5049.190621. PMID: 27729692; PMCID: PMC5037946. 2. Rodríguez Del Águila M, González-Ramírez A. Sample size calculation. Allergol Immunopathol (Madr). 2014 Sep-Oct;42(5):485-92. doi: 10.1016/j.aller.2013.03.008. Epub 2013 Nov 23. PMID: 24280317. 3. The Research Advisors: Research Methodology, Study Design & Statistical Analysis (research- advisors.com) 4. Kang H. Sample size determination and power analysis using the G*Power software. J Educ Eval Health Prof. 2021;18:17. doi: 10.3352/jeehp.2021.18.17. Epub 2021 Jul 30. PMID: 34325496; PMCID: PMC8441096. 5. https://www.researchgate.net/publication/ 350836701_Sample_Size_Calculation_in_Medical_Research_A_Primer 6. https://www.researchgate.net/publication/343860693_Epidemiological_study_designs- _Examples_of_medical_sciences 7. Hiremath SS. Textbook of preventive and community dentistry. Elsevier India; 2011 Aug 15.
  • 54.
  • 55.
  • 56.
    56 DIFFERENCE BETWEEN MARGINOF ERROR AND SD Margin of error Standard error - Is a statistical measure that accounts for the degree of error received from the outcome of your research sample - Measures the accuracy of representation of population sample to the mean using SD of the set data. -goal is to estimate how much allowable difference can exist between the research population & sample size -Purpose is to measure the spread of random variables within the data set

Editor's Notes

  • #5 Population : The Population is the Entire group that we are taking for analysis Sample : Sample is the Subset of the Population(i.e. Taking random samples from the population). The size of the sample is always less than the total size of the population. In census, Sample size= population size
  • #9 Sample size calculation serves two important functions. First, it aims to estimate a minimum sample size that can be sufficient for achieving a target level of accuracy in an estimate for a specific population parameter. Second, it also aims to determine the level of statistical significance (i.e. P-value < 0.05) attained by these desired effect sizes
  • #17 Value of confidence level at 95% is
  • #18 While power and significance level are usually set irrespective of the data, the effect size is a property of the sample data
  • #45 Many researchers (and research texts) suggest that the first column within the table should suffice (Confidence Level = 95%, Margin of Error = 5%).  To use these values, simply determine the size of the population down the left most column (use the next highest value if your exact population size is not listed).  The value in the next column is the sample size that is required to generate a Margin of Error of ± 5% for any population proportion.
  • #49 This is the workplace for g power software
  • #54 Absolute precision: – Refers to the actual uncertainty in a quantity Relative precision: – Expresses the uncertainty as a fraction of the quantity of interest