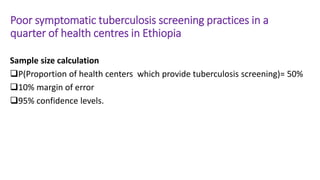
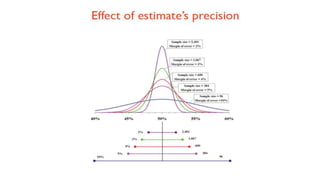
1) A sample size of 50 health centers would allow estimating the proportion of health centers providing tuberculosis screening with a 10% margin of error at a 95% confidence level, assuming a proportion of 50%.
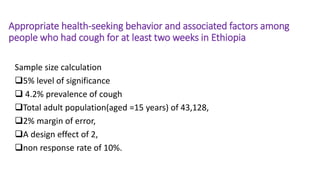
2) A sample size of 600 adults would allow estimating the prevalence of cough with a 2% margin of error, accounting for a design effect of 2 and 10% non-response rate.
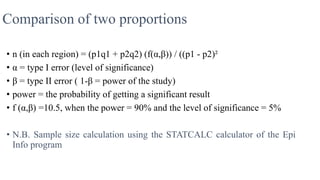
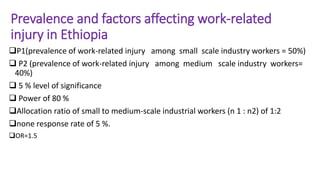
3) A sample size of 500 small-scale industry workers and 1,000 medium-scale industry workers would allow detecting a risk ratio of 1.5 for work-related injuries between the two groups with 80% power and 5%
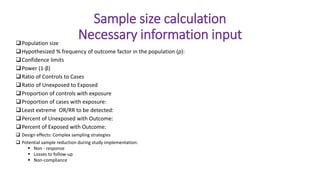
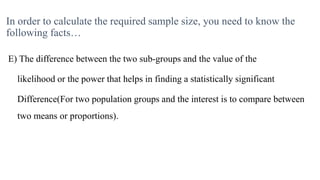
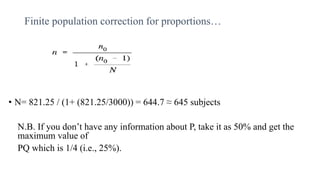
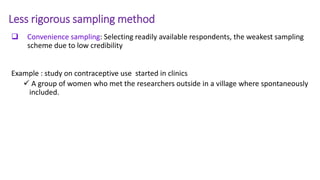
![In order to calculate the required sample size, you need to know
the following facts
A] The reasonable estimate of the key proportion to be studied. If you cannot guess the
proportion, take it as 50%.
B) The degree of accuracy required. That is, the allowed deviation from the true proportion in
the population as a whole. It can be within 1% or 5%, etc.
C) The confidence level required, usually specified as 95%
D] The size of the population that the sample is to represent. If it is more than 10,000 the precise
magnitude is not likely to be very important; but if the population is less than 10,000 then a
smaller sample size may be required](https://image.slidesharecdn.com/l7samplesizedetermination-220721012129-742a2034/85/L7-Sample-size-determination-pptx-4-320.jpg)