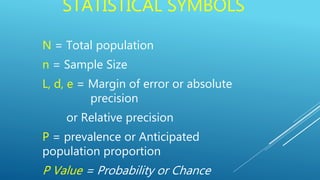
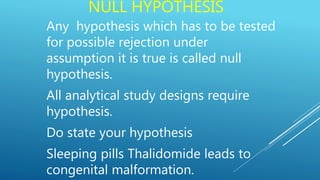
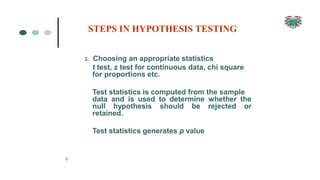
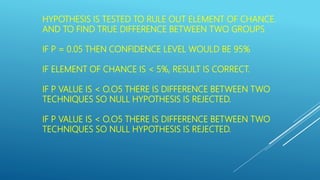
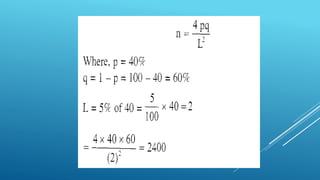
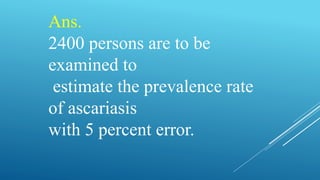
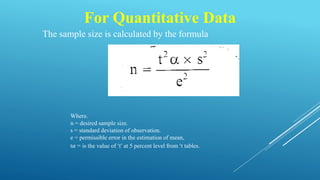
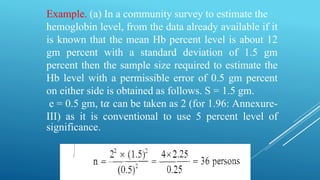
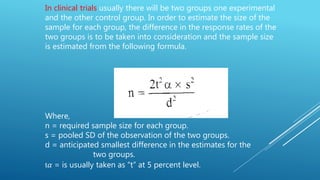
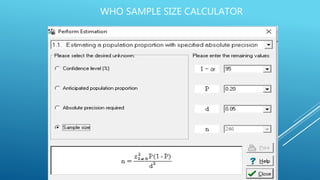
SAMPLE SIZE
STATISTICAL SYMBOLS
N = Total population
n = Sample Size
L, d, e = Margin of error or absolute
precision
or Relative precision
P = prevalence or Anticipated
population proportion
P Value = Probability or Chance
Sample Size
The sample size calculation depends on:
 Type of study
 Magnitude of the outcome of interest derived from
previous studies.
 Type of statistical analysis required (comparing
means or proportions)
 Level of significance / power.
NULL HYPOTHESIS
Any hypothesis which has to be tested
for possible rejection under
assumption it is true is called null
hypothesis.
All analytical study designs require
hypothesis.
Do state your hypothesis
Sleeping pills Thalidomide leads to
congenital malformation.
3. Choosing an appropriate statistics
t test, z test for continuous data, chi square
for proportions etc.
6
Test statistics is computed from the sample
data and is used to determine whether the
null hypothesis should be rejected or
retained.
Test statistics generates p value
STEPS IN HYPOTHESIS TESTING
Simply put, p-value is the chance that
the relationship you are observing is
observed by pure chance. So if you
obtain a p-value of 0.01, it means that
there is a 1% chance that the
relationship between the independent
variable(s) and the dependent variable
that your model established doesn't
actually exist.
HYPOTHESIS IS TESTED TO RULE OUT ELEMENT OF CHANCE.
AND TO FIND TRUE DIFFERENCE BETWEEN TWO GROUPS
IF P = 0.05 THEN CONFIDENCE LEVEL WOULD BE 95%
IF ELEMENT OF CHANCE IS < 5%, RESULT IS CORRECT.
IF P VALUE IS < O.O5 THERE IS DIFFERENCE BETWEEN TWO
TECHNIQUES SO NULL HYPOTHESIS IS REJECTED.
IF P VALUE IS < O.O5 THERE IS DIFFERENCE BETWEEN TWO
TECHNIQUES SO NULL HYPOTHESIS IS REJECTED.
CUT OFF FOR P VALUE
 Arbitrary cut-off 0.05 (5% chance of a false +ve
conclusion.
 If p<0.05 statistically significant- Reject H0,
Accept H1
 If p>0.05 statistically not-significant- Accept H0,
Reject H1
 Testing potential harmful interventions ‘α’ value
is set below 0.05
LOW P VALUE
• If p is very small (<0.001), then the null
hypothesis appears not realistic because
the difference could hardly ever arise due
to chance, when the null hypothesis is
true.
P VALUE IS MAXIMUM PROBABILITY OR CHANCE
TO COMMIT TYPE 1 ERROR.
BIGGER THE SAMPLE SIZE MORE
ACCURATE WILL BE THE DATA
PREVELLANCE OR BURDEN OF DISEASE
QUALITATIVE STUDY
n=
𝑍2
Pq
L2
N = Sample size
Z = 1.96 (standard normal variate)
P =prevalence (anticipated population proportion)
q = 1- P
d = (permissible error in the estimate of P)
Example:
To estimate the prevalence rate of ascariasis
in a community where it is approximately
known to be 40 percent than the required
sample size to estimate the morbidity
(ascariasis) with 5 percent error with a
probability of 0.05 is calculated as follows:
Ans.
2400 persons are to be
examined to
estimate the prevalence rate
of ascariasis
with 5 percent error.
For Quantitative Data
The sample size is calculated by the formula
Where.
n = desired sample size.
s = standard deviation of observation.
e = permissible error in the estimation of mean,
t𝛼 = is the value of ‘t’ at 5 percent level from ‘t tables.
Example. (a) In a community survey to estimate the
hemoglobin level, from the data already available if it
is known that the mean Hb percent level is about 12
gm percent with a standard deviation of 1.5 gm
percent then the sample size required to estimate the
Hb level with a permissible error of 0.5 gm percent
on either side is obtained as follows. S = 1.5 gm.
e = 0.5 gm, t𝛼 can be taken as 2 (for 1.96: Annexure-
III) as it is conventional to use 5 percent level of
significance.
In clinical trials usually there will be two groups one experimental
and the other control group. In order to estimate the size of the
sample for each group, the difference in the response rates of the
two groups is to be taken into consideration and the sample size
is estimated from the following formula.
Where,
n = required sample size for each group.
s = pooled SD of the observation of the two groups.
d = anticipated smallest difference in the estimates for the
two groups.
t𝛼 = is usually taken as “t” at 5 percent level.
WHO SAMPLE SIZE CALCULATOR
SUGGESTED WEBSITE FOR SAMPLE SIZE CALCULATOR
http://www.raosoft.com/samplesize.html
http://www.quantitativeskills.com/sisa/calcu
lations/samsize.htm
http://www.openepi.com/Menu/OpenEpiM
enu.htm
Khalid N Haque
Research Sample size by Dr Allah Yar Malik

Research Sample size by Dr Allah Yar Malik

  • 2.
  • 3.
    STATISTICAL SYMBOLS N =Total population n = Sample Size L, d, e = Margin of error or absolute precision or Relative precision P = prevalence or Anticipated population proportion P Value = Probability or Chance
  • 4.
    Sample Size The samplesize calculation depends on:  Type of study  Magnitude of the outcome of interest derived from previous studies.  Type of statistical analysis required (comparing means or proportions)  Level of significance / power.
  • 5.
    NULL HYPOTHESIS Any hypothesiswhich has to be tested for possible rejection under assumption it is true is called null hypothesis. All analytical study designs require hypothesis. Do state your hypothesis Sleeping pills Thalidomide leads to congenital malformation.
  • 6.
    3. Choosing anappropriate statistics t test, z test for continuous data, chi square for proportions etc. 6 Test statistics is computed from the sample data and is used to determine whether the null hypothesis should be rejected or retained. Test statistics generates p value STEPS IN HYPOTHESIS TESTING
  • 7.
    Simply put, p-valueis the chance that the relationship you are observing is observed by pure chance. So if you obtain a p-value of 0.01, it means that there is a 1% chance that the relationship between the independent variable(s) and the dependent variable that your model established doesn't actually exist.
  • 8.
    HYPOTHESIS IS TESTEDTO RULE OUT ELEMENT OF CHANCE. AND TO FIND TRUE DIFFERENCE BETWEEN TWO GROUPS IF P = 0.05 THEN CONFIDENCE LEVEL WOULD BE 95% IF ELEMENT OF CHANCE IS < 5%, RESULT IS CORRECT. IF P VALUE IS < O.O5 THERE IS DIFFERENCE BETWEEN TWO TECHNIQUES SO NULL HYPOTHESIS IS REJECTED. IF P VALUE IS < O.O5 THERE IS DIFFERENCE BETWEEN TWO TECHNIQUES SO NULL HYPOTHESIS IS REJECTED.
  • 9.
    CUT OFF FORP VALUE  Arbitrary cut-off 0.05 (5% chance of a false +ve conclusion.  If p<0.05 statistically significant- Reject H0, Accept H1  If p>0.05 statistically not-significant- Accept H0, Reject H1  Testing potential harmful interventions ‘α’ value is set below 0.05
  • 10.
    LOW P VALUE •If p is very small (<0.001), then the null hypothesis appears not realistic because the difference could hardly ever arise due to chance, when the null hypothesis is true.
  • 11.
    P VALUE ISMAXIMUM PROBABILITY OR CHANCE TO COMMIT TYPE 1 ERROR.
  • 13.
    BIGGER THE SAMPLESIZE MORE ACCURATE WILL BE THE DATA
  • 14.
    PREVELLANCE OR BURDENOF DISEASE QUALITATIVE STUDY
  • 15.
    n= 𝑍2 Pq L2 N = Samplesize Z = 1.96 (standard normal variate) P =prevalence (anticipated population proportion) q = 1- P d = (permissible error in the estimate of P)
  • 16.
    Example: To estimate theprevalence rate of ascariasis in a community where it is approximately known to be 40 percent than the required sample size to estimate the morbidity (ascariasis) with 5 percent error with a probability of 0.05 is calculated as follows:
  • 18.
    Ans. 2400 persons areto be examined to estimate the prevalence rate of ascariasis with 5 percent error.
  • 19.
    For Quantitative Data Thesample size is calculated by the formula Where. n = desired sample size. s = standard deviation of observation. e = permissible error in the estimation of mean, t𝛼 = is the value of ‘t’ at 5 percent level from ‘t tables.
  • 20.
    Example. (a) Ina community survey to estimate the hemoglobin level, from the data already available if it is known that the mean Hb percent level is about 12 gm percent with a standard deviation of 1.5 gm percent then the sample size required to estimate the Hb level with a permissible error of 0.5 gm percent on either side is obtained as follows. S = 1.5 gm. e = 0.5 gm, t𝛼 can be taken as 2 (for 1.96: Annexure- III) as it is conventional to use 5 percent level of significance.
  • 21.
    In clinical trialsusually there will be two groups one experimental and the other control group. In order to estimate the size of the sample for each group, the difference in the response rates of the two groups is to be taken into consideration and the sample size is estimated from the following formula. Where, n = required sample size for each group. s = pooled SD of the observation of the two groups. d = anticipated smallest difference in the estimates for the two groups. t𝛼 = is usually taken as “t” at 5 percent level.
  • 22.
    WHO SAMPLE SIZECALCULATOR
  • 23.
    SUGGESTED WEBSITE FORSAMPLE SIZE CALCULATOR http://www.raosoft.com/samplesize.html http://www.quantitativeskills.com/sisa/calcu lations/samsize.htm http://www.openepi.com/Menu/OpenEpiM enu.htm
  • 25.

Editor's Notes

  • #13 Type 1 or alpha error means ghalti se true hyposis ko reject kia