Monthly Market Risk Update: April 2024 [SlideShare]
Market outlook- July 16, 2010
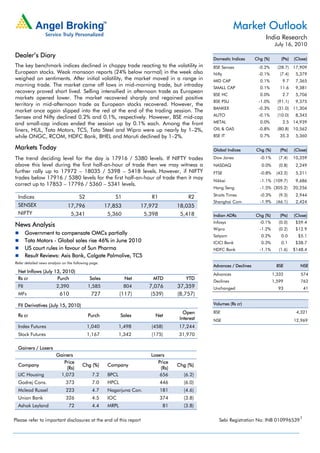
1. Market Outlook
India Research
July 16, 2010
Dealer’s Diary Domestic Indices Chg (%) (Pts) (Close)
The key benchmark indices declined in choppy trade reacting to the volatility in BSE Sensex -0.2% (28.7) 17,909
European stocks. Weak monsoon reports (24% below normal) in the week also Nifty -0.1% (7.4) 5,379
weighed on sentiments. After initial volatility, the market moved in a range in MID CAP 0.1% 9.7 7,365
morning trade. The market came off lows in mid-morning trade, but intraday SMALL CAP 0.1% 11.6 9,381
recovery proved short lived. Selling intensified in afternoon trade as European
BSE HC 0.0% 2.7 5,706
markets opened lower. The market recovered sharply and regained positive
BSE PSU -1.0% (91.1) 9,375
territory in mid-afternoon trade as European stocks recovered. However, the
BANKEX -0.3% (31.0) 11,304
market once again slipped into the red at the end of the trading session. The
AUTO -0.1% (10.0) 8,343
Sensex and Nifty declined 0.2% and 0.1%, respectively. However, BSE mid-cap
and small-cap indices ended the session up by 0.1% each. Among the front METAL 0.0% 2.5 14,939
liners, HUL, Tata Motors, TCS, Tata Steel and Wipro were up nearly by 1–2%, OIL & GAS -0.8% (80.8) 10,562
while ONGC, RCOM, HDFC Bank, BHEL and Maruti declined by 1–2%. BSE IT 0.7% 35.3 5,360
Markets Today Global Indices Chg (%) (Pts) (Close)
The trend deciding level for the day is 17916 / 5380 levels. If NIFTY trades Dow Jones -0.1% (7.4) 10,359
above this level during the first half-an-hour of trade then we may witness a NASDAQ 0.0% (0.8) 2,249
further rally up to 17972 – 18035 / 5398 – 5418 levels. However, if NIFTY FTSE -0.8% (42.2) 5,211
trades below 17916 / 5380 levels for the first half-an-hour of trade then it may
Nikkei -1.1% (109.7) 9,686
correct up to 17853 – 17796 / 5360 – 5341 levels.
Hang Seng -1.5% (305.2) 20,256
Indices S2 S1 R1 R2 Straits Times -0.3% (9.3) 2,944
Shanghai Com -1.9% (46.1) 2,424
SENSEX 17,796 17,853 17,972 18,035
NIFTY 5,341 5,360 5,398 5,418 Indian ADRs Chg (%) (Pts) (Close)
Infosys -0.1% (0.0) $59.4
News Analysis
Wipro -1.2% (0.2) $12.9
Government to compensate OMCs partially Satyam 0.2% 0.0 $5.1
Tata Motors - Global sales rise 46% in June 2010 ICICI Bank 0.3% 0.1 $38.7
US court rules in favour of Sun Pharma HDFC Bank -1.1% (1.6) $148.4
Result Reviews: Axis Bank, Colgate Palmolive, TCS
Refer detailed news analysis on the following page.
Advances / Declines BSE NSE
Net Inflows (July 13, 2010)
Advances 1,332 574
Rs cr Purch Sales Net MTD YTD
Declines 1,599 762
FII 2,390 1,585 804 7,076 37,359 Unchanged 93 41
MFs 610 727 (117) (539) (8,757)
FII Derivatives (July 15, 2010) Volumes (Rs cr)
Open BSE 4,321
Rs cr Purch Sales Net
Interest NSE 12,969
Index Futures 1,040 1,498 (458) 17,244
Stock Futures 1,167 1,342 (175) 31,970
Gainers / Losers
Gainers Losers
Price Price
Company Chg (%) Company Chg (%)
(Rs) (Rs)
LIC Housing 1,073 7.2 BPCL 656 (6.2)
Godrej Cons. 373 7.0 HPCL 446 (6.0)
Mcleod Russel 223 4.7 Nagarjuna Con. 181 (4.6)
Union Bank 326 4.5 IOC 374 (3.8)
Ashok Leyland 72 4.4 MRPL 81 (3.8)
Please refer to important disclosures at the end of this report Sebi Registration No: INB 0109965391
2. Market Outlook | India Research
Government to compensate OMCs partially
The Oil Secretary, Government of India, has given some clarity on the subsidy sharing
system post the de-regulation. The Oil Ministry has gone back to its old sharing
mechanism – upstream sharing one-third of the total under-recoveries and the
Government accounting for at least 50%. However, there is a lack of clarity on the
remaining burden. We believe the switch to the old sharing was unavoidable after the last
month’s de-regulation reforms as petrol and diesel would have had minimal losses for the
upstream to bear. Thus, passing on a portion of cooking fuel losses to upstream players
was expected. While we are already building 33% and 50% subsidy sharing in our
estimates for the upstream companies and government, the key question is the sharing of
balance 17% subsidy. The sharing of the same is contingent on the refining margins
posted by the OMCs, thus going by the same; we believe the ad-hocism in the subsidy
sharing in unlikely to die-down soon. Oil secretary has also pointed that diesel
deregulation might take some time. On account of announcements, we expect
performance PSU oil companies remain muted over the next couple of quarter on the
bourses. Given the recent run-up in the stock price of HPCL and BPCL, we believe they are
trading closer to their fair value. Currently, we have no rating on OMCs. We maintain
accumulate on ONGC with a target of Rs1,356.
Tata Motors - Global sales rise 46% in June 2010
Tata Motors reported its global sales numbers for June 2010, which increased by 46% yoy
to 91,608 units on robust demand from the commercial and passenger vehicles segment.
Cumulative global sales for 1QFY2011 rose by 50% yoy to 249,322 units. While sales of
commercial vehicles grew 38% yoy, sales of passenger vehicles grew by 53% yoy in June
2010. The growth trend in the company’s luxury brands, Jaguar and Land Rover (JLR),
continues to show strong momentum, growing 47% yoy to 20,189 units. Jaguar sales were
higher by 59% yoy, while Land Rover sales grew by 41% yoy. JLR continues to benefit from
strong demand in its key UK market, besides healthy industry growth in the U.S. and
China. Cumulative sales of JLR for 1QFY2011 were higher by 59% to 57,153 units. We
expect Tata Motors to post encouraging volume growth going ahead. We recommend an
Accumulate rating on the stock, with a target price of Rs907.
US court rules in favour of Sun Pharma
Sun Pharma has announced that the US district court had dismissed in its entirety the
complaint filed by Taro Pharmaceutical (Sun Pharma holds a 36% stake) seeking to block
the tender offer by Sun Pharma’s subsidiary, Alkaloida Chemical (Alkaloida), to purchase
all outstanding ordinary shares of Taro Pharmaceutical. The court rejected Taro
Pharmaceutical’s claims based on allegations that Sun Pharma and Alkaloida had failed to
make adequate disclosures concerning the offer. The court also rejected Taro
Pharmaceutical’s request for discovery, remarking that Taro Pharmaceutical had not
explained any purpose that discovery would serve. Though the favorable verdict is positive
as it strengthens Sun Pharma’s position to acquire control of Taro Pharmaceutical (earlier
in 2008, the lower court of Israel also ruled in favour of Sun Pharma), however, the final
outcome would rest on the verdict of Israel’s Supreme Court. The stock is currently trading
at 24.3x FY2011E and 20.5x FY2012E earnings, we recommend Neutral on the stock at
this levels.
July 16, 2010 2
3. Market Outlook | India Research
Result Reviews
Axis Bank
Axis Bank has announced its 1QFY2011 results. The bank has registered net profit growth
of 32.0% on a yoy basis to Rs742cr, higher than our estimate of Rs710cr, mainly on
account of the better-than-estimated net interest income (NII). Strong operating
performance with stable asset quality was the key positive of the result. Advances and
deposits increased 39.1% and 33.7% yoy, respectively. Advances growth was driven by the
large and mid-corporate segment, which grew by 54.7% yoy. The CASA ratio stood at
40.2% (46.7% in 4QFY2010 and 40.1% in 1QFY2010). During the quarter, daily average
balances of savings bank deposits grew 39.4% yoy, while current account deposits grew
37.3% yoy. Reported NIM at 3.71% registered a decline of 38bp sequentially on account
of payment of interest on savings deposits on daily balance. NII increased 44.8% yoy and
3.7% qoq to Rs1,514cr. Non-interest income stood at Rs1,001cr, up 4.4% yoy. Fee income
registered growth of 19% yoy, rising to Rs743cr. The bank generated trading profits of
Rs196cr in 1QFY2011, down 40% yoy. Operating costs increased 28.6% yoy and 5.4%
qoq to Rs1,065cr. The cost-to-income ratio stood at 42.3%, close to its eight-quarter
average of 42.5%. The bank’s asset quality remained stable during the quarter. Gross
NPAs increased by 1.7% sequentially to Rs1,341cr, while net NPAs stood at Rs413cr
compared to Rs419cr in 4QFY2010. The bank’s gross and net NPA ratios stood at 1.13%
(1.13% in 4QFY2010) and 0.35% (0.36% in 4QFY2010), respectively, implying a healthy
provision coverage ratio of 70%. The bank’s CAR continued to be healthy at 14.5%, with
tier-1 at 10.3%. At the CMP, the stock is trading at relatively attractive valuations of 2.5x
FY2012E ABV, an almost 24% discount to HDFC Bank despite similar earnings quality,
profitability and growth expectations over FY2010–12E. We have an Accumulate rating on
the stock with a target price of Rs1,466.
Colgate-Palmolive India
Colgate posted modest top-line growth of 13% yoy to Rs529cr (Rs468cr), marginally below
our estimates, led by steady ~11–12% overall volume growth in its core toothpaste
category. The flagship brands, Colgate Dental Cream, Active Salt and Cibaca, continued
to contribute to the consistent volume growth. Earnings for the quarter grew 19% yoy to
Rs122cr (Rs103cr), beating our estimates by 6%, despite a 41% jump in depreciation to
Rs7.9cr (Rs5.6cr) and a 449bp rise in tax rate (effect of higher taxes at Baddi plant), largely
driven by significant gross margin expansion. On the operating front, Colgate delivered a
sharp margin expansion of 382bp yoy to 26.3% (22.5%), significantly ahead of our
estimates of flattish operating margins, driving healthy growth in EBITDA of 32.2% yoy to
Rs139cr (Rs105cr). Margins expanded largely on account of a sharp 662bp yoy jump in
gross margins due to a 58% yoy decline in purchase of traded goods to Rs45cr (Rs106cr).
However, significant rise in other expenditure by 210bp yoy (31% yoy in absolute terms)
coupled with a 67bp rise in advertising expenditure curtailed further margin expansion.
During the last three months, Colgate has outperformed the Sensex by ~18%, widening its
premium to the benchmark. At the CMP of Rs847, the stock is trading at rich valuations of
23.3x FY20120E EPS of Rs36.3. Hence, we retain our Reduce rating on the stock with a
target price of Rs798 (based on 22x FY2012E EPS, in line with its historical valuations)
owing to 1) sharp run up in the stock price, 2) expensive valuations for a muted earnings
CAGR (trading at almost ~3x PEG), 3) heightened competitive intensity (potential entry of
P&G, renewed activity from HUL) and 4) jump in tax-rate to 24–25% (expiry of tax holidays
at Baddi plant).
July 16, 2010 3
4. Market Outlook | India Research
TCS
For 1QFY2011, TCS reported top-line growth of 6.2% qoq (14%yoy) to Rs8,217cr. Growth
was backed by 8.1% growth in volumes, which combated the cross-currency and pricing
impact of negative ~190bps. Growth was broad-based, led by North America and Asia
Pacific geographies. TCS closed 10 large deals, adding 36 new clients during the quarter.
Despite the 215bp and 32bp negative impact of wage hikes and adverse currency
movement, the company witnessed only a slight dip of 36bp qoq in EBIT margin due to
rate productivity improvement and lower selling and general administration costs. Other
income was down by 49% qoq to Rs83.1cr on account of Forex loss of Rs47cr versus Forex
gain witnessed in 4QFY2010. The tax rate also moved up from 14.8% to 19% qoq. Thus,
TCS recorded a decline of 5.3% qoq in bottom line to Rs1,844cr, mainly on account of
higher Forex loss and tax rate. Despite weaker macro-economic scenario, TCS continued
to perform well during the quarter across verticals and services and is witnessing a strong
deal pipeline with some discretionary spends. Hence, the company has also raised its
gross employee-hiring target to 40,000 from earlier 30,000, exhibiting positive demand
environment. At the current market price, we recommend Buy on the stock.
Economic and Political News
Government may sell stake in ONGC, IOC: Oil secy
Government asks RIL to cut supplies to fertiliser, power plants
Food inflation edges up to 12.81%
Monsoon 24% below normal in the week to July 14
Corporate News
Essar Steel allowed to surrender Gujarat SEZ
Central Bank of India to raise Rs2,500cr in FY2011
US Exim gives preliminary nod to Reliance Power's Sasan project
Essar may get Rs3,493cr windfall from Vodafone
IOC set to enter gas pipeline business
Source: Economic Times, Business Standard, Business Line, Financial Express, Mint
Events for the day
Honeywell Auto Quarterly Results
Karuturi Global Quarterly Results
Nava Bharat Ventures Quarterly Results
State Bank Travancore Quarterly Results
Supreme Industries Quarterly Results
Zydus Wellness Quarterly Results
July 16, 2010 4
5. Market Outlook | India Research
Research Team Tel: 022-4040 3800 E-mail: research@angeltrade.com Website: www.angeltrade.com
DISCLAIMER
This document is solely for the personal information of the recipient, and must not be singularly used as the basis of any investment
decision. Nothing in this document should be construed as investment or financial advice. Each recipient of this document should make
such investigations as they deem necessary to arrive at an independent evaluation of an investment in the securities of the companies
referred to in this document (including the merits and risks involved), and should consult their own advisors to determine the merits and
risks of such an investment.
Angel Broking Limited, its affiliates, directors, its proprietary trading and investment businesses may, from time to time, make investment
decisions that are inconsistent with or contradictory to the recommendations expressed herein. The views contained in this document are
those of the analyst, and the company may or may not subscribe to all the views expressed within.
Reports based on technical and derivative analysis center on studying charts of a stock's price movement, outstanding positions and
trading volume, as opposed to focusing on a company's fundamentals and, as such, may not match with a report on a company's
fundamentals.
The information in this document has been printed on the basis of publicly available information, internal data and other reliable sources
believed to be true, but we do not represent that it is accurate or complete and it should not be relied on as such, as this document is for
general guidance only. Angel Broking or any of its affiliates/ group companies shall not be in any way responsible for any loss or
damage that may arise to any person from any inadvertent error in the information contained in this report. Angel Broking Limited has
not independently verified all the information contained within this document. Accordingly, we cannot testify, nor make any representation
or warranty, express or implied, to the accuracy, contents or data contained within this document. While Angel Broking Limited
endeavours to update on a reasonable basis the information discussed in this material, there may be regulatory, compliance, or other
reasons that prevent us from doing so.
This document is being supplied to you solely for your information, and its contents, information or data may not be reproduced,
redistributed or passed on, directly or indirectly.
Angel Broking Limited and its affiliates may seek to provide or have engaged in providing corporate finance, investment banking or other
advisory services in a merger or specific transaction to the companies referred to in this report, as on the date of this report or in the past.
Neither Angel Broking Limited, nor its directors, employees or affiliates shall be liable for any loss or damage that may arise from or in
connection with the use of this information.
Note: Please refer to the important `Stock Holding Disclosure' report on the Angel website (Research Section).
Address: Acme Plaza, ‘A’ Wing, 3rd Floor, M.V. Road, Opp. Sangam Cinema, Andheri (E), Mumbai - 400 059.
Tel : (022) 3952 4568 / 4040 3800
Angel Broking Ltd: BSE Sebi Regn No : INB 010996539 / CDSL Regn No: IN - DP - CDSL - 234 - 2004 / PMS Regn Code: PM/INP000001546
Angel Capital & Debt Market Ltd: INB 231279838 / NSE FNO: INF 231279838 / NSE Member code -12798 Angel Commodities Broking (P) Ltd: MCX Member ID: 12685 / FMC Regn No: MCX / TCM /
CORP / 0037 NCDEX : Member ID 00220 / FMC Regn No: NCDEX / TCM / CORP / 0302
July 16, 2010 5