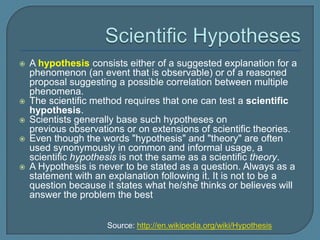
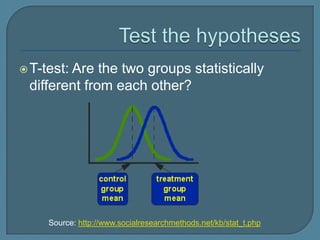
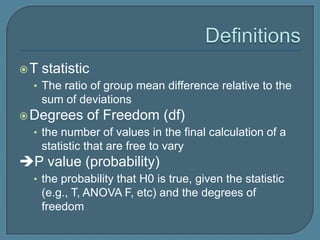
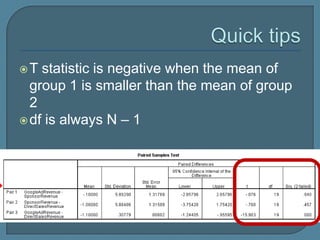
Hypothesis Testing
 Understand  what are scientific hypotheses
 Understand fundamental principles of
  hypothesis testing
 Understand what is a t test
 Understand how to perform a t test
   A hypothesis consists either of a suggested explanation for a
    phenomenon (an event that is observable) or of a reasoned
    proposal suggesting a possible correlation between multiple
    phenomena.
   The scientific method requires that one can test a scientific
    hypothesis.
   Scientists generally base such hypotheses on
    previous observations or on extensions of scientific theories.
   Even though the words "hypothesis" and "theory" are often
    used synonymously in common and informal usage, a
    scientific hypothesis is not the same as a scientific theory.
   A Hypothesis is never to be stated as a question. Always as a
    statement with an explanation following it. It is not to be a
    question because it states what he/she thinks or believes will
    answer the problem the best


                      Source: http://en.wikipedia.org/wiki/Hypothesis
 The  null hypothesis (H0) is a hypothesis
  (scenario) set up to be nullified, refuted, or
  rejected ('disproved' statistically) in order to
  support an alternative hypothesis.
 The alternative hypothesis (H1) is the
  possibility that an observed effect is genuine
  and the null hypothesis is the rival possibility
  that it has resulted from chance.
 A falsifiable theory allows both null &
  alternative hypotheses.
Why do we bother to set up a hypothesis
when we can’t prove it true?
 When  used, the null hypothesis is
 presumed true until statistical evidence, in
 the form of a hypothesis test, indicates
 otherwise — that is, when the researcher
 has a certain degree of confidence, usually
 95% to 99%, that the data does not
 support the null hypothesis.
 T-test:
        Are the two groups statistically
 different from each other?


     Source: http://www.socialresearchmethods.net/kb/stat_t.php
 The "student's" distribution was actually published
  in 1908 by W. S. Gosset.
 Gosset was employed at a brewery that forbade
  the publication of research by its staff members
 Gosset devised the t-test as a way to cheaply
  monitor the quality of beer.
 To circumvent this restriction, Gosset used the
  name "Student", and consequently the distribution
  was named "Student t-distribution"

                                       Source: wikipedia
   Critical T values:
      1-tailed: 1.65                                2-tailed: 1.96


 Reject the null hypothesis when the t value is greater
  than the cut-off critical value
 Because the signal-to-noise ratio is sufficiently high

 Source: http://janda.org/c10/Lectures/topic07/L19-Ttestresearch.htm
T   statistic
  • The ratio of group mean difference relative to the
     sum of deviations
 Degrees     of Freedom (df)
  • the number of values in the final calculation of a
     statistic that are free to vary
P value (probability)
  • the probability that H0 is true, given the statistic
     (e.g., T, ANOVA F, etc) and the degrees of
     freedom
T  statistic is negative when the mean of
  group 1 is smaller than the mean of group
  2
 df is always N – 1

S5 w1 hypothesis testing & t test

  • 1.
  • 2.
     Understand what are scientific hypotheses  Understand fundamental principles of hypothesis testing  Understand what is a t test  Understand how to perform a t test
  • 3.
    A hypothesis consists either of a suggested explanation for a phenomenon (an event that is observable) or of a reasoned proposal suggesting a possible correlation between multiple phenomena.  The scientific method requires that one can test a scientific hypothesis.  Scientists generally base such hypotheses on previous observations or on extensions of scientific theories.  Even though the words "hypothesis" and "theory" are often used synonymously in common and informal usage, a scientific hypothesis is not the same as a scientific theory.  A Hypothesis is never to be stated as a question. Always as a statement with an explanation following it. It is not to be a question because it states what he/she thinks or believes will answer the problem the best Source: http://en.wikipedia.org/wiki/Hypothesis
  • 4.
     The null hypothesis (H0) is a hypothesis (scenario) set up to be nullified, refuted, or rejected ('disproved' statistically) in order to support an alternative hypothesis.  The alternative hypothesis (H1) is the possibility that an observed effect is genuine and the null hypothesis is the rival possibility that it has resulted from chance.  A falsifiable theory allows both null & alternative hypotheses.
  • 5.
    Why do webother to set up a hypothesis when we can’t prove it true?
  • 6.
     When used, the null hypothesis is presumed true until statistical evidence, in the form of a hypothesis test, indicates otherwise — that is, when the researcher has a certain degree of confidence, usually 95% to 99%, that the data does not support the null hypothesis.
  • 7.
     T-test: Are the two groups statistically different from each other? Source: http://www.socialresearchmethods.net/kb/stat_t.php
  • 8.
     The "student's"distribution was actually published in 1908 by W. S. Gosset.  Gosset was employed at a brewery that forbade the publication of research by its staff members  Gosset devised the t-test as a way to cheaply monitor the quality of beer.  To circumvent this restriction, Gosset used the name "Student", and consequently the distribution was named "Student t-distribution" Source: wikipedia
  • 11.
    Critical T values: 1-tailed: 1.65 2-tailed: 1.96  Reject the null hypothesis when the t value is greater than the cut-off critical value  Because the signal-to-noise ratio is sufficiently high Source: http://janda.org/c10/Lectures/topic07/L19-Ttestresearch.htm
  • 12.
    T statistic • The ratio of group mean difference relative to the sum of deviations  Degrees of Freedom (df) • the number of values in the final calculation of a statistic that are free to vary P value (probability) • the probability that H0 is true, given the statistic (e.g., T, ANOVA F, etc) and the degrees of freedom
  • 13.
    T statisticis negative when the mean of group 1 is smaller than the mean of group 2  df is always N – 1

Editor's Notes

  • #4 This slide is pretty much self explanatoryA hypothesis is a clear, logical and straightforward statement of what you predict will happen about one, two or more variablesSomeone who reads your hypothesis should be able to clearly identify what variables are involvedFor example:Hypothesis 1: City of Pittsburgh wants to know what’s the best social media policyIt’s not very clear what variables (a variable is a dimension along which data can vary) are involved. City of Pittsburgh is not a variable (because it doesn’t vary – it’s what it is!) and social media policy is not exactly a variable unless you’re talking about a range of possible policiesHypothesis 2: City of Seattle has the best social media policyThis hypothesis is very difficult to test empirically because – 1. what’s the definition of “the best policy” and also 2. how do you know how many social media policies exist in the world and that you’ve looked at every single one and that Seattle has the absolutely best?
  • #5 One very important idea about hypotheses is that we can only prove that a hypothesis is wrong. We can NEVER prove that a hypothesis is true.This is a tricky concept to get but it’s extremely important.For example, couple of hundreds of years ago scientists wanted to know if all swans are white. European scientists had always seen white swans. They had never seen a swan of a different color. Every new swan they saw was a white swan. Does seeing more white swans help them prove that All Swans are White?This continued until someone found a black swan in Australia and this single swan proved the previous hypothesis to be wrong. When we have negative evidence to prove a hypothesis wrong, we’re always 100% certain about our conclusion.However, when we only positive evidence, we are never 10% certain if a hypothesis is correct.Therefore, the scientific approach is always the following:Set up a null hypothesis (e.g., there’s no difference between men and women about movie preferences)Design a study to collect data hoping to prove the null hypothesis is wrongData that proves the null hypothesis wrong will help you support the alternative hypothesis (e.g., there IS indeed differences between men and women about movie preferences.)
  • #6 Students often ask me this question.What do you think?
  • #7 The basic assumption is “all hypotheses are innocent (null) until proven guilty”And we don’t need to be 100% sure when we prove the null hypothesis wrongWe just need to have enough evidence to be 95% - 99% sure
  • #8 When the research question is about whether two groups differ in terms of their means, we can use a t test For example, we can use the t test to find out if the revenue from GoogleAds is significantly different from (or higher than) revenue from sponsors
  • #9 A little historical background on the t testIt was developed for a very practical problem – to monitor the quality of beer production!
  • #10 Just because two groups have different means, it doesn’t mean the difference is big enough to make a differenceFor example, if girls get 1401 on SAT scores on average, and boys get 1402 on SAT scores on average, does the difference mean that boys are better at SAT than girls?Or let’s say the average temperature in Pittsburgh is 34.2, and 34.1 in Cleveland. Yes there is a difference, but is the difference significant? Does it matter?To answer the question we have to look at not just the central tendency (the mean) but also the data’s dispersion (how fat/skinny, tall/short the distribution is.)Look at the three graphsThey all have the same means. However, the third one probably has the most distinctive two groups (the least overlap) because both are skinny distributions with little overlap between the two. The difference between the two group is more likely than the other two graphs to be statistically significantThe middle one has two fat distributions that overlap for the most part. The difference between the two group is unlikely to be statistically significant
  • #11 The t test, in essence, is a ratio of signal to noise, with the noise being the overlap between the two groupsThis diagram illustrates how the t value is calculated. SPSS will calculate the value for you
  • #12 When the ratio of signal-to-noise is high enough, we say we’re confident that the two groups are differentThe cut-off point for “high enough” is 1.65 or 1.96 for the t test (depending on if the comparison is 1 tail or two tail)1 tail comparison: revenue from Google is GREATER THAN revenue from sponsors2 tail comparison: revenue from Google is DIFFERENT FROM revenue from sponsors
  • #13 Terminologies to understandYou will see “degrees of freedom” of a lot. It’s just a number that shows how many things can vary in the calculation. It’s usually based on number of participants and number of variables.In our blog revenue example, if there are 40 blogs, the DF is 39 = sample size – 1P value is the probability that what we are observing is due to chance and is not a reflection of a true group difference.For example, if the average temperature in Pittsburgh is 34.1 and 34.2 in Cleveland, and people in Cleveland claims that it’s a warmer city. We should do a t test of the daily temperature for a whole year in Pittsburgh (365 data points) versus the daily temperature for a whole year in Cleveland. If the p value for the t test result is .65, then we can say that there’s 65% probability that the .1 degree difference in temperature between the two groups happened due to chance(aka a fluke) and those Clevelanders are liars!However if the p value is .05 or lower, then we can the chance that it happened due to chance is so low (only 5%) that we have to admit that Cleveland is a warmer city (Liars!!!)
  • #14 To sum up, the t test is really just to determine if a meaningful group difference exists.If you’re comparing Pittsburgh vs. Cleveland, the temperature difference is -.1  the t test value would be negativeIf you’re comparing Cleveland vs. Pittsburgh, the temperature difference is +.1  the t test value would be positive