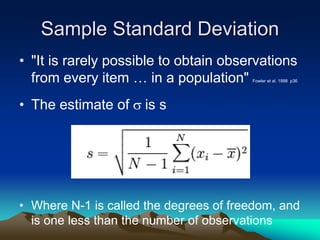
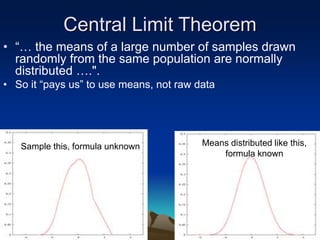
SlideShare a Scribd company logo
1 of 34
Hypothesis Testing - the scientists'
moral imperative
• To tell whether our data supports or rejects our ideas,
we use statistical hypothesis testing.
• The problem is that we often get data that seem to
support our ideas. The literature is full of papers that
accept a pet idea uncritically. Statistical testing keeps
scientists honest.
• If you read a paper that suggests some alternative
hypothesis should be accepted, but there is no statistical
test, don't believe it.
“If you haven't measured it
you don't know what you
are talking about.”
-William Thompson, Lord Kelvin
If a topic is part of science, ideas have consequences that can be checked.
We can count and measure aspects of nature to check our ideas.
If our measurements are contrary to the
predictions of our model, our hypothesis
is FALSE, and we reject it
"It does not make any difference how beautiful your guess is. It does not make
any difference how smart you are, who made the guess, or what his name is--
if it disagrees with experiment it is wrong. That is all there is to it."
-Richard Feynman (The Character of Physical Law)
http://video.google.com/videoplay?docid=-5157969812375041230&hl=en
The Mean
• The mean is one of the commonly used
statistics in science. It is often the
"Expected Value" i.e. the value we expect
to get.
• The mean is found by totalling the values
for all observations (∑x) and dividing by
the total number of observations (n).
The formula for finding
the mean is:
Mean = ∑x
n
• Measures of the spread of data are the
standard deviation, s, and variance s2
Standard Deviation
• For s.d. calculate the difference of each observation and the
mean, square it, add all these up, divide by the sample size, and
take the square root.
•Refers to actual population
Sample
variance
Sample Standard Deviation
• "It is rarely possible to obtain observations
from every item … in a population" Fowler et al. 1998 p36
• The estimate of s is s
• Where N-1 is called the degrees of freedom, and
is one less than the number of observations
Knowing the Distribution
• In coin toss experiments, we know a formula for
calculating the probability of any number of k
heads in n trials, the Binomial Distribution.
• Fortunately, we don’t have to know the
distribution for every situation in nature.
• We are saved by the Central Limit Theorem
• “… the means of a large number of samples drawn
randomly from the same population are normally
distributed ….".
• So it “pays us” to use means, not raw data
Central Limit Theorem
Sample this, formula unknown Means distributed like this,
formula known
• So if we make many observations and use
averages as our data, we can draw valid
conclusions because we know their distribution
• Many test statistics
are available for this.
• In a few moments we will
learn Chi-Square (X2)
Normal Distribution
Expected Value
• The expected value is the average result we
expect.
• It is the product of the probability times the
number of observations E = p x n
• A really useful case is the where the probability
of all cases is equal.
• For example, in fair coin tosses, the probability
of Heads =1/2. If we flip a coin 24 times, we
EXPECT ½ x 24 = 12 Heads
• Equal probability cases are usually the basis of
the "Null Hypothesis"
Hypotheses
• A hypothesis is a statement of the
researcher’s idea or guess.
• To test a hypothesis the first thing we do is
write down a statement – called the null
hypothesis.
• The null hypothesis is often the opposite of
the researcher’s guess.
For Example
• Some null hypotheses may be:
– “there is no difference in lava viscosity
between Hawaiian and Cascades volcanoes”.
– “there is no relation between a volcanic
islands’ height and its age.”
– “there is no connection between the time
since subaerial exposure of sediment and the
height of the hills it forms”
The Hypotheses
• Null Hypothesis H0: ‘There is no difference
between the average number of streams per
square kilometer and the bedrock type.'
• Alternative Hypothesis HA or H1: ‘There is a
difference between the average number of
streams per square kilometer and the bedrock
type.'
Significance (1)
• Before carrying out any test we have to
decide on a significance level which lets
us determine at what point to reject the
null hypothesis and accept the alternative
hypothesis.
Significance (2)
• Significance is based on the probability of a
particular result.
• Statisticians have calculated the probability
of all possible ‘chance’ events occurring.
Significance (3)
• Many trials, and the use of a higher significance level
(P=.01 not P=.05) , make this less likely
• If the probability of a particular result is less than 1
in 20 (P=0.05), we say the result is significant, ie: the
result is not just a chance event.
• If the probability of a particular result is less than 1
in 100 (P=0.01), we say the result is highly
significant; again, the result is not just a chance
event.
Avoiding Decision Errors
• We always run the risk that we will observe a rare
event, and we will draw the wrong conclusion.
• Usually we want to avoid a Type I error, where we
reject H0 even though it is true.
• Many trials, and the use of a higher significance level
(P=.01 not P=.05) , make this less likely
• In a Type II error, we accept the null hypothesis even
though it is false.
• We will see an example of a type II error later.
Test Statistics
• We often want to see if two things are
different from each other.
• In science we calculate what we would
expect if there was no difference between
them (the usual null hypothesis).
• We can then compare this to what we
actually observe.
Test Statistics
• To check the null hypothesis we calculate a
figure known as a test statistic, which is based
on data from our samples.
• Different types of problems require different test
statistics. Values for comparison to our data
have all been put into statistical tables.
• All we need to do is to calculate our value and
compare it with the value in the table to get our
answer.
Using a Test Statistic
If the test statistic shows you “observed an
unlikely result”, you reject the null
hypothesis and accept the alternative
hypothesis
x2 Significance Tables
• The significance levels available on a x2
table are usually 0.05, 0.01, and .001,
which means there is, respectively, only a
1 in 20 (0.05), a 1 in 100 (0.01), or a 1 in
1000 (0.001), probability of the event
occurring by chance if that x2 is obtained.
• The values in the tables are called critical
values.
Chi-Square (X2) Critical Values In Use
• For Chi-Square (X2) :
If the value of the test statistic you have
calculated is greater than the value in the
table (the critical value) you decided to
use, you can reject the null hypothesis
and accept the alternative hypothesis.
H0: There is no relation between the number of peaks along a ridge and the time since exposure
df P = 0.05 P = 0.01 P = 0.001
1 3.84 6.64 10.83
2 5.99 9.21 13.82
3 7.82 11.35 16.27
4 9.49 13.28 18.47
5 11.07 15.09 20.52
6 12.59 16.81 22.46
7 14.07 18.48 24.32
8 15.51 20.09 26.13
9 16.92 21.67 27.88
10 18.31 23.21 29.59
11 19.68 24.73 31.26
12 21.03 26.22 32.91
13 22.36 27.69 34.53
14 23.69 29.14 36.12
15 25.00 30.58 37.70
Chi-Square (X2)
Critical Values
Significance table of X2 values.
This is the critical value table we
will use in the examples below.
Important
• The chi square test can only be used on
observations that have the following
characteristics:
The data must be in the form
of frequencies
The frequency data must have a
precise numerical value and must be
organised into categories or groups.
The total number of observations must be
greater than 20.
The expected frequency in any one cell
of the table must be greater than 5. *
It is prudent to use
means, not raw data,
to insure a normal
distribution
* See the exception next slide **There are statistics designed to test this assumption
Objects being counted are independent**
An Exception
• "The discrepancy is not large, however,
when X 2 is computed from contingency
tables with a fairly large number of cells
(more than 4, at a minimum) and only a
few theoretical frequencies are less than
5."
• Source: Spence, J. et al.(1968) Elementary Statistics
The expected frequency in any one cell
of the table must be greater than 5.
Other Statistics
• If any of the assumptions for X 2
are false, we cannot use X 2
• However, there are test statistics for most
situations, and they are all similar in their
use.
• Once you know X 2 you can look up the
correct statistic and apply it
The x 2 formula
S means take the sum
• Step 1. Write down the NULL HYPOTHESIS
(H0) and ALTERNATIVE HYPOTHESES (Ha) and
set the LEVEL OF SIGNIFICANCE.
• H0 'A basaltic sand pile will not spread further than
a quartz sand pile in the same time'
• Ha ' A basaltic sand pile will spread further than a
quartz sand pile in the same time '
• We will set the level of significance at 0.05.
Worked Example 1:
Step 2: Construct a table with the information you have
observed. Use averages as data
Method: 220 Hawaiian sand and 250 New Jersey sand
piles of 50 cc each are left out in the weather for 1 week
After 1 week, the distance of the furthest grain beyond the initial
perimeter is measured. Every 5 piles are averaged.
Furthest
grain
(mm)
1-5 6-10 11-15 16-20 21-25 Row
Total
Quartz 9 13 10 10 8 50
Basaltic 4 3 5 9 21 42
Column
Total
13 16 15 19 29 92
Note that although there are 3 cells in the table that are not greater than 5, these
are observed frequencies. It is only the expected frequencies that have to be
greater than 5.
Work out the expected frequency.
Expected frequency = row total x column total
Grand total
Furthest
grain
(mm)
1-5 6-10 11-15 16-20 21-25 Row
Total
Quartz 7.07
Basaltic
Column
Total
Eg: expected frequency for oaks in PL1 = (50 x 13) / 92 = 7.07
You do the rest
Furthest
grain
(mm)
1-5 6-10 11-15 16-20 21-25 Row
Total
Quartz 7.07 8.70 8.15 10.33 15.76 50
Basaltic 5.93 7.30 6.85 8.67 13.24 42
Column
Total
13 16 15 19 29 92
The Expected Frequencies
For each of the cells calculate:
Furthest
grain
(mm)
1-5 6-10 11-15 16-20 21-25 Row
Total
Quartz 0.53
Basaltic
Column
Total
Eg: Basaltic in 1-5 mm is (9 – 7.07)2 / 7.07 = 0.53
(O – E)2
E
You do the rest
Furthest
grain
(mm)
1-5 6-10 11-15 16-20 21-25
Quartz 0.53 2.13 0.42 0.01 3.82
Basaltic 0.63 2.54 0.50 0.01 4.55
Add up all of the above numbers to obtain
the value for chi square: x2 = 15.14.
(O – E)2
E
So:
x2
= (O – E) 2
E
These are the
But S
• Look up the X2 value on the table in the
slide above. This will tell you whether to
accept the null hypothesis or reject it.
The number of degrees of freedom to use is: the number
of rows in the table minus 1, multiplied by the number of
columns minus 1. This is (2-1) x (5-1) = 1 x 4 = 4 degrees of
freedom.
We find that our answer of 15.14 is greater than the
critical value of 9.49 (for 4 degrees of freedom and a
significance level of 0.05) and so we reject the null
hypothesis.
Now:
‘The distribution of grains spreading from sand
piles made of basaltic minerals versus quartz is
significantly different.’
Now you have to look for physical factors to
explain your findings
If you ask me, you should check the density.
Basaltic Hawaiian basaltic sands are mostly
pyroxenes
The density of pyroxene is 3.24 g/cm3.
The density of quartz is 2.536
The pyroxene has greater potential energy when hilled to the same height as
quartz sand
We conclude:

More Related Content

What's hot (20)

Hypothesis testing
Hypothesis testingHypothesis testing
Hypothesis testing
 
Introduction to ANOVAs
Introduction to ANOVAsIntroduction to ANOVAs
Introduction to ANOVAs
 
Hypothesis testing
Hypothesis testingHypothesis testing
Hypothesis testing
 
Multivariate Analysis
Multivariate AnalysisMultivariate Analysis
Multivariate Analysis
 
Process Capability: Step 5 (Non-Normal Distributions)
Process Capability: Step 5 (Non-Normal Distributions)Process Capability: Step 5 (Non-Normal Distributions)
Process Capability: Step 5 (Non-Normal Distributions)
 
Chi squared test
Chi squared test Chi squared test
Chi squared test
 
TEST OF HYPOTHESIS
TEST OF HYPOTHESISTEST OF HYPOTHESIS
TEST OF HYPOTHESIS
 
The normal distribution
The normal distributionThe normal distribution
The normal distribution
 
Sampling distribution
Sampling distributionSampling distribution
Sampling distribution
 
STATISTICS: Normal Distribution
STATISTICS: Normal Distribution STATISTICS: Normal Distribution
STATISTICS: Normal Distribution
 
Normal probability distribution
Normal probability distributionNormal probability distribution
Normal probability distribution
 
The Standard Normal Distribution
The Standard Normal Distribution  The Standard Normal Distribution
The Standard Normal Distribution
 
Negative binomial distribution
Negative binomial distributionNegative binomial distribution
Negative binomial distribution
 
Normal and standard normal distribution
Normal and standard normal distributionNormal and standard normal distribution
Normal and standard normal distribution
 
Standard Deviation and Variance
Standard Deviation and VarianceStandard Deviation and Variance
Standard Deviation and Variance
 
Non parametric-tests
Non parametric-testsNon parametric-tests
Non parametric-tests
 
Estimation in statistics
Estimation in statisticsEstimation in statistics
Estimation in statistics
 
Test of significance
Test of significanceTest of significance
Test of significance
 
Inferential Statistics
Inferential StatisticsInferential Statistics
Inferential Statistics
 
Hypothesis testing
Hypothesis testingHypothesis testing
Hypothesis testing
 

Similar to 8. Hypothesis Testing.ppt

TOPIC- HYPOTHESIS TESTING RMS.pptx
TOPIC- HYPOTHESIS TESTING  RMS.pptxTOPIC- HYPOTHESIS TESTING  RMS.pptx
TOPIC- HYPOTHESIS TESTING RMS.pptxanamikamishra29
 
Class 5 Hypothesis & Normal Disdribution.pptx
Class 5 Hypothesis & Normal Disdribution.pptxClass 5 Hypothesis & Normal Disdribution.pptx
Class 5 Hypothesis & Normal Disdribution.pptxCallplanetsDeveloper
 
hypothesis testing
 hypothesis testing hypothesis testing
hypothesis testingzoheb khan
 
AI_Probability.pptx
AI_Probability.pptxAI_Probability.pptx
AI_Probability.pptxssuserc8e745
 
Mayo: Evidence as Passing a Severe Test (How it Gets You Beyond the Statistic...
Mayo: Evidence as Passing a Severe Test (How it Gets You Beyond the Statistic...Mayo: Evidence as Passing a Severe Test (How it Gets You Beyond the Statistic...
Mayo: Evidence as Passing a Severe Test (How it Gets You Beyond the Statistic...jemille6
 
D.G. Mayo Slides LSE PH500 Meeting #1
D.G. Mayo Slides LSE PH500 Meeting #1D.G. Mayo Slides LSE PH500 Meeting #1
D.G. Mayo Slides LSE PH500 Meeting #1jemille6
 
D.g. mayo 1st mtg lse ph 500
D.g. mayo 1st mtg lse ph 500D.g. mayo 1st mtg lse ph 500
D.g. mayo 1st mtg lse ph 500jemille6
 
Statistics-3 : Statistical Inference - Core
Statistics-3 : Statistical Inference - CoreStatistics-3 : Statistical Inference - Core
Statistics-3 : Statistical Inference - CoreGiridhar Chandrasekaran
 
Introduction to probabilities and radom variables
Introduction to probabilities and radom variablesIntroduction to probabilities and radom variables
Introduction to probabilities and radom variablesmohammedderriche2
 
Topic 7 stat inference
Topic 7 stat inferenceTopic 7 stat inference
Topic 7 stat inferenceSizwan Ahammed
 
Statistics for IB Biology
Statistics for IB BiologyStatistics for IB Biology
Statistics for IB BiologyEran Earland
 
COM 201_Inferential Statistics_18032022.pptx
COM 201_Inferential Statistics_18032022.pptxCOM 201_Inferential Statistics_18032022.pptx
COM 201_Inferential Statistics_18032022.pptxAkinsolaAyomidotun
 
Morestatistics22 091208004743-phpapp01
Morestatistics22 091208004743-phpapp01Morestatistics22 091208004743-phpapp01
Morestatistics22 091208004743-phpapp01mandrewmartin
 
Statistics and probability pp
Statistics and  probability ppStatistics and  probability pp
Statistics and probability ppRuby Vidal
 
10. sampling and hypotehsis
10. sampling and hypotehsis10. sampling and hypotehsis
10. sampling and hypotehsisKaran Kukreja
 
Lecture 4 - probability distributions (2).pptx
Lecture 4 - probability distributions (2).pptxLecture 4 - probability distributions (2).pptx
Lecture 4 - probability distributions (2).pptxSinimol Aniyankunju
 
6 estimation hypothesis testing t test
6 estimation hypothesis testing t test6 estimation hypothesis testing t test
6 estimation hypothesis testing t testPenny Jiang
 

Similar to 8. Hypothesis Testing.ppt (20)

TOPIC- HYPOTHESIS TESTING RMS.pptx
TOPIC- HYPOTHESIS TESTING  RMS.pptxTOPIC- HYPOTHESIS TESTING  RMS.pptx
TOPIC- HYPOTHESIS TESTING RMS.pptx
 
Class 5 Hypothesis & Normal Disdribution.pptx
Class 5 Hypothesis & Normal Disdribution.pptxClass 5 Hypothesis & Normal Disdribution.pptx
Class 5 Hypothesis & Normal Disdribution.pptx
 
hypothesis testing
 hypothesis testing hypothesis testing
hypothesis testing
 
AI_Probability.pptx
AI_Probability.pptxAI_Probability.pptx
AI_Probability.pptx
 
Mayo: Evidence as Passing a Severe Test (How it Gets You Beyond the Statistic...
Mayo: Evidence as Passing a Severe Test (How it Gets You Beyond the Statistic...Mayo: Evidence as Passing a Severe Test (How it Gets You Beyond the Statistic...
Mayo: Evidence as Passing a Severe Test (How it Gets You Beyond the Statistic...
 
D.G. Mayo Slides LSE PH500 Meeting #1
D.G. Mayo Slides LSE PH500 Meeting #1D.G. Mayo Slides LSE PH500 Meeting #1
D.G. Mayo Slides LSE PH500 Meeting #1
 
D.g. mayo 1st mtg lse ph 500
D.g. mayo 1st mtg lse ph 500D.g. mayo 1st mtg lse ph 500
D.g. mayo 1st mtg lse ph 500
 
Hypothesis testing
Hypothesis testingHypothesis testing
Hypothesis testing
 
Hypothesis testing
Hypothesis testingHypothesis testing
Hypothesis testing
 
Statistics-3 : Statistical Inference - Core
Statistics-3 : Statistical Inference - CoreStatistics-3 : Statistical Inference - Core
Statistics-3 : Statistical Inference - Core
 
Introduction to probabilities and radom variables
Introduction to probabilities and radom variablesIntroduction to probabilities and radom variables
Introduction to probabilities and radom variables
 
Test of hypotheses part i
Test of hypotheses part iTest of hypotheses part i
Test of hypotheses part i
 
Topic 7 stat inference
Topic 7 stat inferenceTopic 7 stat inference
Topic 7 stat inference
 
Statistics for IB Biology
Statistics for IB BiologyStatistics for IB Biology
Statistics for IB Biology
 
COM 201_Inferential Statistics_18032022.pptx
COM 201_Inferential Statistics_18032022.pptxCOM 201_Inferential Statistics_18032022.pptx
COM 201_Inferential Statistics_18032022.pptx
 
Morestatistics22 091208004743-phpapp01
Morestatistics22 091208004743-phpapp01Morestatistics22 091208004743-phpapp01
Morestatistics22 091208004743-phpapp01
 
Statistics and probability pp
Statistics and  probability ppStatistics and  probability pp
Statistics and probability pp
 
10. sampling and hypotehsis
10. sampling and hypotehsis10. sampling and hypotehsis
10. sampling and hypotehsis
 
Lecture 4 - probability distributions (2).pptx
Lecture 4 - probability distributions (2).pptxLecture 4 - probability distributions (2).pptx
Lecture 4 - probability distributions (2).pptx
 
6 estimation hypothesis testing t test
6 estimation hypothesis testing t test6 estimation hypothesis testing t test
6 estimation hypothesis testing t test
 

More from ABDULRAUF411

Non-aqueous titration and complexometric Titration.pptx
Non-aqueous titration and complexometric Titration.pptxNon-aqueous titration and complexometric Titration.pptx
Non-aqueous titration and complexometric Titration.pptxABDULRAUF411
 
7. GAS CHROMATOGRAPHY.pptx
7. GAS CHROMATOGRAPHY.pptx7. GAS CHROMATOGRAPHY.pptx
7. GAS CHROMATOGRAPHY.pptxABDULRAUF411
 
Combinatorial Synthesis.pdf
Combinatorial Synthesis.pdfCombinatorial Synthesis.pdf
Combinatorial Synthesis.pdfABDULRAUF411
 
5. STRUCTURE BASED DD.pptx
5. STRUCTURE BASED DD.pptx5. STRUCTURE BASED DD.pptx
5. STRUCTURE BASED DD.pptxABDULRAUF411
 
2. DRUG DESIGN & RELATION OF FUNCTIONAL GROUPS.pptx
2. DRUG DESIGN & RELATION OF FUNCTIONAL GROUPS.pptx2. DRUG DESIGN & RELATION OF FUNCTIONAL GROUPS.pptx
2. DRUG DESIGN & RELATION OF FUNCTIONAL GROUPS.pptxABDULRAUF411
 
1. DRUG DISCOVERY FROM NATURAL PRODUCTS.pptx
1. DRUG DISCOVERY FROM NATURAL PRODUCTS.pptx1. DRUG DISCOVERY FROM NATURAL PRODUCTS.pptx
1. DRUG DISCOVERY FROM NATURAL PRODUCTS.pptxABDULRAUF411
 
6. AMINO ACIDS.pptx
6. AMINO ACIDS.pptx6. AMINO ACIDS.pptx
6. AMINO ACIDS.pptxABDULRAUF411
 
6. GLYCOSIDES.pptx
6. GLYCOSIDES.pptx6. GLYCOSIDES.pptx
6. GLYCOSIDES.pptxABDULRAUF411
 
Anti-HIV Agents- Advance Medicinal Chemistry-1.pptx
Anti-HIV Agents- Advance Medicinal Chemistry-1.pptxAnti-HIV Agents- Advance Medicinal Chemistry-1.pptx
Anti-HIV Agents- Advance Medicinal Chemistry-1.pptxABDULRAUF411
 
NMRbySSS.Complete-1.pptx
NMRbySSS.Complete-1.pptxNMRbySSS.Complete-1.pptx
NMRbySSS.Complete-1.pptxABDULRAUF411
 
3. Mean__Median__Mode__Range.ppt
3. Mean__Median__Mode__Range.ppt3. Mean__Median__Mode__Range.ppt
3. Mean__Median__Mode__Range.pptABDULRAUF411
 
7. stratified sampling.pptx
7. stratified sampling.pptx7. stratified sampling.pptx
7. stratified sampling.pptxABDULRAUF411
 
First dose size in humans and non linear pharmacokinetics.pptx
First dose size in humans and non linear pharmacokinetics.pptxFirst dose size in humans and non linear pharmacokinetics.pptx
First dose size in humans and non linear pharmacokinetics.pptxABDULRAUF411
 
b- Sulphonamides ppt.pptx
b- Sulphonamides ppt.pptxb- Sulphonamides ppt.pptx
b- Sulphonamides ppt.pptxABDULRAUF411
 
Cardioactive glycosides ppt.pptx
Cardioactive glycosides ppt.pptxCardioactive glycosides ppt.pptx
Cardioactive glycosides ppt.pptxABDULRAUF411
 
Anti histamines-1.pptx
Anti histamines-1.pptxAnti histamines-1.pptx
Anti histamines-1.pptxABDULRAUF411
 
Basic Metabolic Pathways and origin of secondary metabolites.pptx
Basic Metabolic Pathways and origin of secondary metabolites.pptxBasic Metabolic Pathways and origin of secondary metabolites.pptx
Basic Metabolic Pathways and origin of secondary metabolites.pptxABDULRAUF411
 
Autonomic nervous system 1
Autonomic nervous system 1Autonomic nervous system 1
Autonomic nervous system 1ABDULRAUF411
 

More from ABDULRAUF411 (19)

Non-aqueous titration and complexometric Titration.pptx
Non-aqueous titration and complexometric Titration.pptxNon-aqueous titration and complexometric Titration.pptx
Non-aqueous titration and complexometric Titration.pptx
 
7. GAS CHROMATOGRAPHY.pptx
7. GAS CHROMATOGRAPHY.pptx7. GAS CHROMATOGRAPHY.pptx
7. GAS CHROMATOGRAPHY.pptx
 
Combinatorial Synthesis.pdf
Combinatorial Synthesis.pdfCombinatorial Synthesis.pdf
Combinatorial Synthesis.pdf
 
5. STRUCTURE BASED DD.pptx
5. STRUCTURE BASED DD.pptx5. STRUCTURE BASED DD.pptx
5. STRUCTURE BASED DD.pptx
 
2. DRUG DESIGN & RELATION OF FUNCTIONAL GROUPS.pptx
2. DRUG DESIGN & RELATION OF FUNCTIONAL GROUPS.pptx2. DRUG DESIGN & RELATION OF FUNCTIONAL GROUPS.pptx
2. DRUG DESIGN & RELATION OF FUNCTIONAL GROUPS.pptx
 
1. DRUG DISCOVERY FROM NATURAL PRODUCTS.pptx
1. DRUG DISCOVERY FROM NATURAL PRODUCTS.pptx1. DRUG DISCOVERY FROM NATURAL PRODUCTS.pptx
1. DRUG DISCOVERY FROM NATURAL PRODUCTS.pptx
 
6. AMINO ACIDS.pptx
6. AMINO ACIDS.pptx6. AMINO ACIDS.pptx
6. AMINO ACIDS.pptx
 
6. GLYCOSIDES.pptx
6. GLYCOSIDES.pptx6. GLYCOSIDES.pptx
6. GLYCOSIDES.pptx
 
Anti-HIV Agents- Advance Medicinal Chemistry-1.pptx
Anti-HIV Agents- Advance Medicinal Chemistry-1.pptxAnti-HIV Agents- Advance Medicinal Chemistry-1.pptx
Anti-HIV Agents- Advance Medicinal Chemistry-1.pptx
 
NMRbySSS.Complete-1.pptx
NMRbySSS.Complete-1.pptxNMRbySSS.Complete-1.pptx
NMRbySSS.Complete-1.pptx
 
3. Mean__Median__Mode__Range.ppt
3. Mean__Median__Mode__Range.ppt3. Mean__Median__Mode__Range.ppt
3. Mean__Median__Mode__Range.ppt
 
7. stratified sampling.pptx
7. stratified sampling.pptx7. stratified sampling.pptx
7. stratified sampling.pptx
 
First dose size in humans and non linear pharmacokinetics.pptx
First dose size in humans and non linear pharmacokinetics.pptxFirst dose size in humans and non linear pharmacokinetics.pptx
First dose size in humans and non linear pharmacokinetics.pptx
 
b- Sulphonamides ppt.pptx
b- Sulphonamides ppt.pptxb- Sulphonamides ppt.pptx
b- Sulphonamides ppt.pptx
 
Cardioactive glycosides ppt.pptx
Cardioactive glycosides ppt.pptxCardioactive glycosides ppt.pptx
Cardioactive glycosides ppt.pptx
 
Anti histamines-1.pptx
Anti histamines-1.pptxAnti histamines-1.pptx
Anti histamines-1.pptx
 
Basic Metabolic Pathways and origin of secondary metabolites.pptx
Basic Metabolic Pathways and origin of secondary metabolites.pptxBasic Metabolic Pathways and origin of secondary metabolites.pptx
Basic Metabolic Pathways and origin of secondary metabolites.pptx
 
Autonomic nervous system 1
Autonomic nervous system 1Autonomic nervous system 1
Autonomic nervous system 1
 
Indole
IndoleIndole
Indole
 

Recently uploaded

Call Girl Raipur 📲 9999965857 ヅ10k NiGhT Call Girls In Raipur
Call Girl Raipur 📲 9999965857 ヅ10k NiGhT Call Girls In RaipurCall Girl Raipur 📲 9999965857 ヅ10k NiGhT Call Girls In Raipur
Call Girl Raipur 📲 9999965857 ヅ10k NiGhT Call Girls In Raipurgragmanisha42
 
VIP Kolkata Call Girl New Town 👉 8250192130 Available With Room
VIP Kolkata Call Girl New Town 👉 8250192130  Available With RoomVIP Kolkata Call Girl New Town 👉 8250192130  Available With Room
VIP Kolkata Call Girl New Town 👉 8250192130 Available With Roomdivyansh0kumar0
 
❤️♀️@ Jaipur Call Girls ❤️♀️@ Meghna Jaipur Call Girls Number CRTHNR Call G...
❤️♀️@ Jaipur Call Girls ❤️♀️@ Meghna Jaipur Call Girls Number CRTHNR   Call G...❤️♀️@ Jaipur Call Girls ❤️♀️@ Meghna Jaipur Call Girls Number CRTHNR   Call G...
❤️♀️@ Jaipur Call Girls ❤️♀️@ Meghna Jaipur Call Girls Number CRTHNR Call G...Gfnyt.com
 
Vip Kolkata Call Girls Cossipore 👉 8250192130 ❣️💯 Available With Room 24×7
Vip Kolkata Call Girls Cossipore 👉 8250192130 ❣️💯 Available With Room 24×7Vip Kolkata Call Girls Cossipore 👉 8250192130 ❣️💯 Available With Room 24×7
Vip Kolkata Call Girls Cossipore 👉 8250192130 ❣️💯 Available With Room 24×7Miss joya
 
VIP Call Girls Noida Jhanvi 9711199171 Best VIP Call Girls Near Me
VIP Call Girls Noida Jhanvi 9711199171 Best VIP Call Girls Near MeVIP Call Girls Noida Jhanvi 9711199171 Best VIP Call Girls Near Me
VIP Call Girls Noida Jhanvi 9711199171 Best VIP Call Girls Near Memriyagarg453
 
VIP Call Girl Sector 25 Gurgaon Just Call Me 9899900591
VIP Call Girl Sector 25 Gurgaon Just Call Me 9899900591VIP Call Girl Sector 25 Gurgaon Just Call Me 9899900591
VIP Call Girl Sector 25 Gurgaon Just Call Me 9899900591adityaroy0215
 
No Advance 9053900678 Chandigarh Call Girls , Indian Call Girls For Full Ni...
No Advance 9053900678 Chandigarh  Call Girls , Indian Call Girls  For Full Ni...No Advance 9053900678 Chandigarh  Call Girls , Indian Call Girls  For Full Ni...
No Advance 9053900678 Chandigarh Call Girls , Indian Call Girls For Full Ni...Vip call girls In Chandigarh
 
Jalandhar Female Call Girls Contact Number 9053900678 💚Jalandhar Female Call...
Jalandhar  Female Call Girls Contact Number 9053900678 💚Jalandhar Female Call...Jalandhar  Female Call Girls Contact Number 9053900678 💚Jalandhar Female Call...
Jalandhar Female Call Girls Contact Number 9053900678 💚Jalandhar Female Call...Call Girls Service Chandigarh Ayushi
 
Call Now ☎ 9999965857 !! Call Girls in Hauz Khas Escort Service Delhi N.C.R.
Call Now ☎ 9999965857 !! Call Girls in Hauz Khas Escort Service Delhi N.C.R.Call Now ☎ 9999965857 !! Call Girls in Hauz Khas Escort Service Delhi N.C.R.
Call Now ☎ 9999965857 !! Call Girls in Hauz Khas Escort Service Delhi N.C.R.ktanvi103
 
Hot Call Girl In Ludhiana 👅🥵 9053'900678 Call Girls Service In Ludhiana
Hot  Call Girl In Ludhiana 👅🥵 9053'900678 Call Girls Service In LudhianaHot  Call Girl In Ludhiana 👅🥵 9053'900678 Call Girls Service In Ludhiana
Hot Call Girl In Ludhiana 👅🥵 9053'900678 Call Girls Service In LudhianaRussian Call Girls in Ludhiana
 
Dehradun Call Girls Service ❤️🍑 8854095900 👄🫦Independent Escort Service Dehradun
Dehradun Call Girls Service ❤️🍑 8854095900 👄🫦Independent Escort Service DehradunDehradun Call Girls Service ❤️🍑 8854095900 👄🫦Independent Escort Service Dehradun
Dehradun Call Girls Service ❤️🍑 8854095900 👄🫦Independent Escort Service DehradunNiamh verma
 
Russian Call Girls Kota * 8250192130 Service starts from just ₹9999 ✅
Russian Call Girls Kota * 8250192130 Service starts from just ₹9999 ✅Russian Call Girls Kota * 8250192130 Service starts from just ₹9999 ✅
Russian Call Girls Kota * 8250192130 Service starts from just ₹9999 ✅gragmanisha42
 
VIP Call Girl Sector 88 Gurgaon Delhi Just Call Me 9899900591
VIP Call Girl Sector 88 Gurgaon Delhi Just Call Me 9899900591VIP Call Girl Sector 88 Gurgaon Delhi Just Call Me 9899900591
VIP Call Girl Sector 88 Gurgaon Delhi Just Call Me 9899900591adityaroy0215
 
Hot Call Girl In Chandigarh 👅🥵 9053'900678 Call Girls Service In Chandigarh
Hot  Call Girl In Chandigarh 👅🥵 9053'900678 Call Girls Service In ChandigarhHot  Call Girl In Chandigarh 👅🥵 9053'900678 Call Girls Service In Chandigarh
Hot Call Girl In Chandigarh 👅🥵 9053'900678 Call Girls Service In ChandigarhVip call girls In Chandigarh
 
Enjoyment ★ 8854095900 Indian Call Girls In Dehradun 🍆🍌 By Dehradun Call Girl ★
Enjoyment ★ 8854095900 Indian Call Girls In Dehradun 🍆🍌 By Dehradun Call Girl ★Enjoyment ★ 8854095900 Indian Call Girls In Dehradun 🍆🍌 By Dehradun Call Girl ★
Enjoyment ★ 8854095900 Indian Call Girls In Dehradun 🍆🍌 By Dehradun Call Girl ★indiancallgirl4rent
 
Udaipur Call Girls 📲 9999965857 Call Girl in Udaipur
Udaipur Call Girls 📲 9999965857 Call Girl in UdaipurUdaipur Call Girls 📲 9999965857 Call Girl in Udaipur
Udaipur Call Girls 📲 9999965857 Call Girl in Udaipurseemahedar019
 
Call Girl In Zirakpur ❤️♀️@ 9988299661 Zirakpur Call Girls Near Me ❤️♀️@ Sexy...
Call Girl In Zirakpur ❤️♀️@ 9988299661 Zirakpur Call Girls Near Me ❤️♀️@ Sexy...Call Girl In Zirakpur ❤️♀️@ 9988299661 Zirakpur Call Girls Near Me ❤️♀️@ Sexy...
Call Girl In Zirakpur ❤️♀️@ 9988299661 Zirakpur Call Girls Near Me ❤️♀️@ Sexy...Sheetaleventcompany
 
Russian Call Girls Lucknow ₹7.5k Pick Up & Drop With Cash Payment 8923113531 ...
Russian Call Girls Lucknow ₹7.5k Pick Up & Drop With Cash Payment 8923113531 ...Russian Call Girls Lucknow ₹7.5k Pick Up & Drop With Cash Payment 8923113531 ...
Russian Call Girls Lucknow ₹7.5k Pick Up & Drop With Cash Payment 8923113531 ...gurkirankumar98700
 
pOOJA sexy Call Girls In Sector 49,9999965857 Young Female Escorts Service In...
pOOJA sexy Call Girls In Sector 49,9999965857 Young Female Escorts Service In...pOOJA sexy Call Girls In Sector 49,9999965857 Young Female Escorts Service In...
pOOJA sexy Call Girls In Sector 49,9999965857 Young Female Escorts Service In...Call Girls Noida
 

Recently uploaded (20)

Call Girl Raipur 📲 9999965857 ヅ10k NiGhT Call Girls In Raipur
Call Girl Raipur 📲 9999965857 ヅ10k NiGhT Call Girls In RaipurCall Girl Raipur 📲 9999965857 ヅ10k NiGhT Call Girls In Raipur
Call Girl Raipur 📲 9999965857 ヅ10k NiGhT Call Girls In Raipur
 
VIP Kolkata Call Girl New Town 👉 8250192130 Available With Room
VIP Kolkata Call Girl New Town 👉 8250192130  Available With RoomVIP Kolkata Call Girl New Town 👉 8250192130  Available With Room
VIP Kolkata Call Girl New Town 👉 8250192130 Available With Room
 
❤️♀️@ Jaipur Call Girls ❤️♀️@ Meghna Jaipur Call Girls Number CRTHNR Call G...
❤️♀️@ Jaipur Call Girls ❤️♀️@ Meghna Jaipur Call Girls Number CRTHNR   Call G...❤️♀️@ Jaipur Call Girls ❤️♀️@ Meghna Jaipur Call Girls Number CRTHNR   Call G...
❤️♀️@ Jaipur Call Girls ❤️♀️@ Meghna Jaipur Call Girls Number CRTHNR Call G...
 
Vip Kolkata Call Girls Cossipore 👉 8250192130 ❣️💯 Available With Room 24×7
Vip Kolkata Call Girls Cossipore 👉 8250192130 ❣️💯 Available With Room 24×7Vip Kolkata Call Girls Cossipore 👉 8250192130 ❣️💯 Available With Room 24×7
Vip Kolkata Call Girls Cossipore 👉 8250192130 ❣️💯 Available With Room 24×7
 
VIP Call Girls Noida Jhanvi 9711199171 Best VIP Call Girls Near Me
VIP Call Girls Noida Jhanvi 9711199171 Best VIP Call Girls Near MeVIP Call Girls Noida Jhanvi 9711199171 Best VIP Call Girls Near Me
VIP Call Girls Noida Jhanvi 9711199171 Best VIP Call Girls Near Me
 
VIP Call Girl Sector 25 Gurgaon Just Call Me 9899900591
VIP Call Girl Sector 25 Gurgaon Just Call Me 9899900591VIP Call Girl Sector 25 Gurgaon Just Call Me 9899900591
VIP Call Girl Sector 25 Gurgaon Just Call Me 9899900591
 
No Advance 9053900678 Chandigarh Call Girls , Indian Call Girls For Full Ni...
No Advance 9053900678 Chandigarh  Call Girls , Indian Call Girls  For Full Ni...No Advance 9053900678 Chandigarh  Call Girls , Indian Call Girls  For Full Ni...
No Advance 9053900678 Chandigarh Call Girls , Indian Call Girls For Full Ni...
 
Jalandhar Female Call Girls Contact Number 9053900678 💚Jalandhar Female Call...
Jalandhar  Female Call Girls Contact Number 9053900678 💚Jalandhar Female Call...Jalandhar  Female Call Girls Contact Number 9053900678 💚Jalandhar Female Call...
Jalandhar Female Call Girls Contact Number 9053900678 💚Jalandhar Female Call...
 
Call Now ☎ 9999965857 !! Call Girls in Hauz Khas Escort Service Delhi N.C.R.
Call Now ☎ 9999965857 !! Call Girls in Hauz Khas Escort Service Delhi N.C.R.Call Now ☎ 9999965857 !! Call Girls in Hauz Khas Escort Service Delhi N.C.R.
Call Now ☎ 9999965857 !! Call Girls in Hauz Khas Escort Service Delhi N.C.R.
 
Hot Call Girl In Ludhiana 👅🥵 9053'900678 Call Girls Service In Ludhiana
Hot  Call Girl In Ludhiana 👅🥵 9053'900678 Call Girls Service In LudhianaHot  Call Girl In Ludhiana 👅🥵 9053'900678 Call Girls Service In Ludhiana
Hot Call Girl In Ludhiana 👅🥵 9053'900678 Call Girls Service In Ludhiana
 
Dehradun Call Girls Service ❤️🍑 8854095900 👄🫦Independent Escort Service Dehradun
Dehradun Call Girls Service ❤️🍑 8854095900 👄🫦Independent Escort Service DehradunDehradun Call Girls Service ❤️🍑 8854095900 👄🫦Independent Escort Service Dehradun
Dehradun Call Girls Service ❤️🍑 8854095900 👄🫦Independent Escort Service Dehradun
 
Russian Call Girls Kota * 8250192130 Service starts from just ₹9999 ✅
Russian Call Girls Kota * 8250192130 Service starts from just ₹9999 ✅Russian Call Girls Kota * 8250192130 Service starts from just ₹9999 ✅
Russian Call Girls Kota * 8250192130 Service starts from just ₹9999 ✅
 
VIP Call Girl Sector 88 Gurgaon Delhi Just Call Me 9899900591
VIP Call Girl Sector 88 Gurgaon Delhi Just Call Me 9899900591VIP Call Girl Sector 88 Gurgaon Delhi Just Call Me 9899900591
VIP Call Girl Sector 88 Gurgaon Delhi Just Call Me 9899900591
 
Hot Call Girl In Chandigarh 👅🥵 9053'900678 Call Girls Service In Chandigarh
Hot  Call Girl In Chandigarh 👅🥵 9053'900678 Call Girls Service In ChandigarhHot  Call Girl In Chandigarh 👅🥵 9053'900678 Call Girls Service In Chandigarh
Hot Call Girl In Chandigarh 👅🥵 9053'900678 Call Girls Service In Chandigarh
 
(ILA) Call Girls in Kolkata Call Now 8617697112 Kolkata Escorts
(ILA) Call Girls in Kolkata Call Now 8617697112 Kolkata Escorts(ILA) Call Girls in Kolkata Call Now 8617697112 Kolkata Escorts
(ILA) Call Girls in Kolkata Call Now 8617697112 Kolkata Escorts
 
Enjoyment ★ 8854095900 Indian Call Girls In Dehradun 🍆🍌 By Dehradun Call Girl ★
Enjoyment ★ 8854095900 Indian Call Girls In Dehradun 🍆🍌 By Dehradun Call Girl ★Enjoyment ★ 8854095900 Indian Call Girls In Dehradun 🍆🍌 By Dehradun Call Girl ★
Enjoyment ★ 8854095900 Indian Call Girls In Dehradun 🍆🍌 By Dehradun Call Girl ★
 
Udaipur Call Girls 📲 9999965857 Call Girl in Udaipur
Udaipur Call Girls 📲 9999965857 Call Girl in UdaipurUdaipur Call Girls 📲 9999965857 Call Girl in Udaipur
Udaipur Call Girls 📲 9999965857 Call Girl in Udaipur
 
Call Girl In Zirakpur ❤️♀️@ 9988299661 Zirakpur Call Girls Near Me ❤️♀️@ Sexy...
Call Girl In Zirakpur ❤️♀️@ 9988299661 Zirakpur Call Girls Near Me ❤️♀️@ Sexy...Call Girl In Zirakpur ❤️♀️@ 9988299661 Zirakpur Call Girls Near Me ❤️♀️@ Sexy...
Call Girl In Zirakpur ❤️♀️@ 9988299661 Zirakpur Call Girls Near Me ❤️♀️@ Sexy...
 
Russian Call Girls Lucknow ₹7.5k Pick Up & Drop With Cash Payment 8923113531 ...
Russian Call Girls Lucknow ₹7.5k Pick Up & Drop With Cash Payment 8923113531 ...Russian Call Girls Lucknow ₹7.5k Pick Up & Drop With Cash Payment 8923113531 ...
Russian Call Girls Lucknow ₹7.5k Pick Up & Drop With Cash Payment 8923113531 ...
 
pOOJA sexy Call Girls In Sector 49,9999965857 Young Female Escorts Service In...
pOOJA sexy Call Girls In Sector 49,9999965857 Young Female Escorts Service In...pOOJA sexy Call Girls In Sector 49,9999965857 Young Female Escorts Service In...
pOOJA sexy Call Girls In Sector 49,9999965857 Young Female Escorts Service In...
 

8. Hypothesis Testing.ppt

  • 1. Hypothesis Testing - the scientists' moral imperative • To tell whether our data supports or rejects our ideas, we use statistical hypothesis testing. • The problem is that we often get data that seem to support our ideas. The literature is full of papers that accept a pet idea uncritically. Statistical testing keeps scientists honest. • If you read a paper that suggests some alternative hypothesis should be accepted, but there is no statistical test, don't believe it.
  • 2. “If you haven't measured it you don't know what you are talking about.” -William Thompson, Lord Kelvin If a topic is part of science, ideas have consequences that can be checked. We can count and measure aspects of nature to check our ideas. If our measurements are contrary to the predictions of our model, our hypothesis is FALSE, and we reject it "It does not make any difference how beautiful your guess is. It does not make any difference how smart you are, who made the guess, or what his name is-- if it disagrees with experiment it is wrong. That is all there is to it." -Richard Feynman (The Character of Physical Law) http://video.google.com/videoplay?docid=-5157969812375041230&hl=en
  • 3. The Mean • The mean is one of the commonly used statistics in science. It is often the "Expected Value" i.e. the value we expect to get. • The mean is found by totalling the values for all observations (∑x) and dividing by the total number of observations (n). The formula for finding the mean is: Mean = ∑x n
  • 4. • Measures of the spread of data are the standard deviation, s, and variance s2 Standard Deviation • For s.d. calculate the difference of each observation and the mean, square it, add all these up, divide by the sample size, and take the square root. •Refers to actual population Sample variance
  • 5. Sample Standard Deviation • "It is rarely possible to obtain observations from every item … in a population" Fowler et al. 1998 p36 • The estimate of s is s • Where N-1 is called the degrees of freedom, and is one less than the number of observations
  • 6. Knowing the Distribution • In coin toss experiments, we know a formula for calculating the probability of any number of k heads in n trials, the Binomial Distribution. • Fortunately, we don’t have to know the distribution for every situation in nature. • We are saved by the Central Limit Theorem
  • 7. • “… the means of a large number of samples drawn randomly from the same population are normally distributed ….". • So it “pays us” to use means, not raw data Central Limit Theorem Sample this, formula unknown Means distributed like this, formula known
  • 8. • So if we make many observations and use averages as our data, we can draw valid conclusions because we know their distribution • Many test statistics are available for this. • In a few moments we will learn Chi-Square (X2) Normal Distribution
  • 9. Expected Value • The expected value is the average result we expect. • It is the product of the probability times the number of observations E = p x n • A really useful case is the where the probability of all cases is equal. • For example, in fair coin tosses, the probability of Heads =1/2. If we flip a coin 24 times, we EXPECT ½ x 24 = 12 Heads • Equal probability cases are usually the basis of the "Null Hypothesis"
  • 10. Hypotheses • A hypothesis is a statement of the researcher’s idea or guess. • To test a hypothesis the first thing we do is write down a statement – called the null hypothesis. • The null hypothesis is often the opposite of the researcher’s guess.
  • 11. For Example • Some null hypotheses may be: – “there is no difference in lava viscosity between Hawaiian and Cascades volcanoes”. – “there is no relation between a volcanic islands’ height and its age.” – “there is no connection between the time since subaerial exposure of sediment and the height of the hills it forms”
  • 12. The Hypotheses • Null Hypothesis H0: ‘There is no difference between the average number of streams per square kilometer and the bedrock type.' • Alternative Hypothesis HA or H1: ‘There is a difference between the average number of streams per square kilometer and the bedrock type.'
  • 13. Significance (1) • Before carrying out any test we have to decide on a significance level which lets us determine at what point to reject the null hypothesis and accept the alternative hypothesis.
  • 14. Significance (2) • Significance is based on the probability of a particular result. • Statisticians have calculated the probability of all possible ‘chance’ events occurring.
  • 15. Significance (3) • Many trials, and the use of a higher significance level (P=.01 not P=.05) , make this less likely • If the probability of a particular result is less than 1 in 20 (P=0.05), we say the result is significant, ie: the result is not just a chance event. • If the probability of a particular result is less than 1 in 100 (P=0.01), we say the result is highly significant; again, the result is not just a chance event.
  • 16. Avoiding Decision Errors • We always run the risk that we will observe a rare event, and we will draw the wrong conclusion. • Usually we want to avoid a Type I error, where we reject H0 even though it is true. • Many trials, and the use of a higher significance level (P=.01 not P=.05) , make this less likely • In a Type II error, we accept the null hypothesis even though it is false. • We will see an example of a type II error later.
  • 17. Test Statistics • We often want to see if two things are different from each other. • In science we calculate what we would expect if there was no difference between them (the usual null hypothesis). • We can then compare this to what we actually observe.
  • 18. Test Statistics • To check the null hypothesis we calculate a figure known as a test statistic, which is based on data from our samples. • Different types of problems require different test statistics. Values for comparison to our data have all been put into statistical tables. • All we need to do is to calculate our value and compare it with the value in the table to get our answer.
  • 19. Using a Test Statistic If the test statistic shows you “observed an unlikely result”, you reject the null hypothesis and accept the alternative hypothesis
  • 20. x2 Significance Tables • The significance levels available on a x2 table are usually 0.05, 0.01, and .001, which means there is, respectively, only a 1 in 20 (0.05), a 1 in 100 (0.01), or a 1 in 1000 (0.001), probability of the event occurring by chance if that x2 is obtained. • The values in the tables are called critical values.
  • 21. Chi-Square (X2) Critical Values In Use • For Chi-Square (X2) : If the value of the test statistic you have calculated is greater than the value in the table (the critical value) you decided to use, you can reject the null hypothesis and accept the alternative hypothesis. H0: There is no relation between the number of peaks along a ridge and the time since exposure
  • 22. df P = 0.05 P = 0.01 P = 0.001 1 3.84 6.64 10.83 2 5.99 9.21 13.82 3 7.82 11.35 16.27 4 9.49 13.28 18.47 5 11.07 15.09 20.52 6 12.59 16.81 22.46 7 14.07 18.48 24.32 8 15.51 20.09 26.13 9 16.92 21.67 27.88 10 18.31 23.21 29.59 11 19.68 24.73 31.26 12 21.03 26.22 32.91 13 22.36 27.69 34.53 14 23.69 29.14 36.12 15 25.00 30.58 37.70 Chi-Square (X2) Critical Values Significance table of X2 values. This is the critical value table we will use in the examples below.
  • 23. Important • The chi square test can only be used on observations that have the following characteristics: The data must be in the form of frequencies The frequency data must have a precise numerical value and must be organised into categories or groups. The total number of observations must be greater than 20. The expected frequency in any one cell of the table must be greater than 5. * It is prudent to use means, not raw data, to insure a normal distribution * See the exception next slide **There are statistics designed to test this assumption Objects being counted are independent**
  • 24. An Exception • "The discrepancy is not large, however, when X 2 is computed from contingency tables with a fairly large number of cells (more than 4, at a minimum) and only a few theoretical frequencies are less than 5." • Source: Spence, J. et al.(1968) Elementary Statistics The expected frequency in any one cell of the table must be greater than 5.
  • 25. Other Statistics • If any of the assumptions for X 2 are false, we cannot use X 2 • However, there are test statistics for most situations, and they are all similar in their use. • Once you know X 2 you can look up the correct statistic and apply it
  • 26. The x 2 formula S means take the sum
  • 27. • Step 1. Write down the NULL HYPOTHESIS (H0) and ALTERNATIVE HYPOTHESES (Ha) and set the LEVEL OF SIGNIFICANCE. • H0 'A basaltic sand pile will not spread further than a quartz sand pile in the same time' • Ha ' A basaltic sand pile will spread further than a quartz sand pile in the same time ' • We will set the level of significance at 0.05. Worked Example 1:
  • 28. Step 2: Construct a table with the information you have observed. Use averages as data Method: 220 Hawaiian sand and 250 New Jersey sand piles of 50 cc each are left out in the weather for 1 week After 1 week, the distance of the furthest grain beyond the initial perimeter is measured. Every 5 piles are averaged. Furthest grain (mm) 1-5 6-10 11-15 16-20 21-25 Row Total Quartz 9 13 10 10 8 50 Basaltic 4 3 5 9 21 42 Column Total 13 16 15 19 29 92 Note that although there are 3 cells in the table that are not greater than 5, these are observed frequencies. It is only the expected frequencies that have to be greater than 5.
  • 29. Work out the expected frequency. Expected frequency = row total x column total Grand total Furthest grain (mm) 1-5 6-10 11-15 16-20 21-25 Row Total Quartz 7.07 Basaltic Column Total Eg: expected frequency for oaks in PL1 = (50 x 13) / 92 = 7.07 You do the rest
  • 30. Furthest grain (mm) 1-5 6-10 11-15 16-20 21-25 Row Total Quartz 7.07 8.70 8.15 10.33 15.76 50 Basaltic 5.93 7.30 6.85 8.67 13.24 42 Column Total 13 16 15 19 29 92 The Expected Frequencies
  • 31. For each of the cells calculate: Furthest grain (mm) 1-5 6-10 11-15 16-20 21-25 Row Total Quartz 0.53 Basaltic Column Total Eg: Basaltic in 1-5 mm is (9 – 7.07)2 / 7.07 = 0.53 (O – E)2 E You do the rest
  • 32. Furthest grain (mm) 1-5 6-10 11-15 16-20 21-25 Quartz 0.53 2.13 0.42 0.01 3.82 Basaltic 0.63 2.54 0.50 0.01 4.55 Add up all of the above numbers to obtain the value for chi square: x2 = 15.14. (O – E)2 E So: x2 = (O – E) 2 E These are the But S
  • 33. • Look up the X2 value on the table in the slide above. This will tell you whether to accept the null hypothesis or reject it. The number of degrees of freedom to use is: the number of rows in the table minus 1, multiplied by the number of columns minus 1. This is (2-1) x (5-1) = 1 x 4 = 4 degrees of freedom. We find that our answer of 15.14 is greater than the critical value of 9.49 (for 4 degrees of freedom and a significance level of 0.05) and so we reject the null hypothesis. Now:
  • 34. ‘The distribution of grains spreading from sand piles made of basaltic minerals versus quartz is significantly different.’ Now you have to look for physical factors to explain your findings If you ask me, you should check the density. Basaltic Hawaiian basaltic sands are mostly pyroxenes The density of pyroxene is 3.24 g/cm3. The density of quartz is 2.536 The pyroxene has greater potential energy when hilled to the same height as quartz sand We conclude: