Critical path method
•The critical path method is a technique that
allows you to identify tasks that are necessary
for project completion.
• The critical path in project management is the
longest sequence of activities that must be
finished on time to complete the entire
project.
4.
• A techniquewhere you identify tasks that are
necessary for project completion and determine
scheduling flexibilities.
• Critical path in project management is the longest
sequence of activities that must be finished on time in
order for the entire project to be complete.
• Any delays in critical tasks will delay the whole project.
5.
Why use criticalpath analysis?
• CPA can provide valuable insight on how to
plan projects, allocate resources, pace
towards milestones, and schedule tasks.
6.
• Here aresome reasons why you should use
the critical path method:
• Improves future planning: CPM can be used
to compare expectations with actual progress.
• The data used from current projects can
inform future project plans.
7.
• Facilitates moreeffective resource
management: CPM helps project managers
prioritize tasks, giving them a better idea of
how to avoid resource constraints.
8.
• Helps avoidbottlenecks: Bottlenecks in
projects can result in lost valuable time.
• Plotting out project dependencies using a
network diagram will give you a better idea of
which activities can and can’t run in parallel,
allowing you to schedule work accordingly.
9.
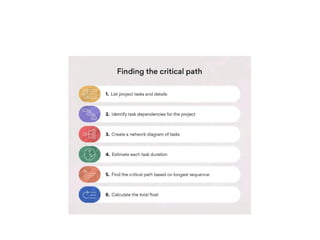
How to finda project's critical path
• Finding the critical path involves identifying
the longest path between the start and end of
the project by comparing the duration of
critical and non-critical tasks.
10.
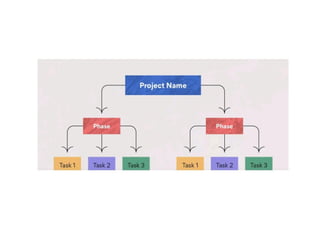
1. List activities
•Use a work breakdown structure to list all the
project activities or tasks required to produce
the deliverables.
• The list of activities in the work breakdown
structure serves as the foundation for the rest
of the CPM.
11.
• Use ato list all the project activities or tasks
required to produce the deliverables.
• The list of activities in the work breakdown
structure serves as the foundation for the rest
of the CPM.
13.
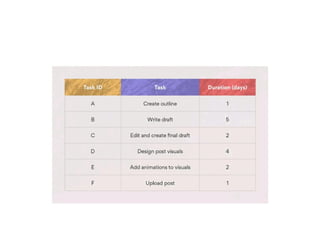
• For example,let’s say the marketing team is producing a new
interactive blog post.
• Here are some tasks that might be in the work breakdown
structure:
15.
• Once youhave a high-level idea of everything
that needs to be done, you can start
identifying task dependencies for the whole
project.
16.
2. Identify dependencies
•Based on your work breakdown structure,
determine the tasks that are dependent on
one another.
• This will also help you identify any work that
can be done in parallel with other tasks.
17.
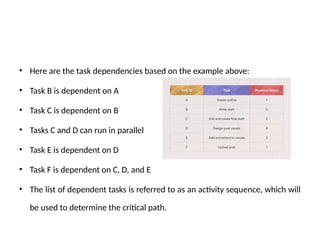
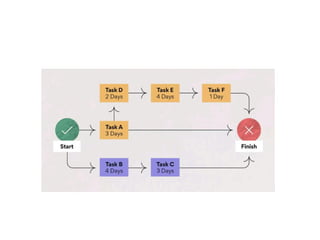
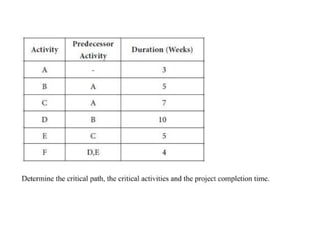
• Here arethe task dependencies based on the example above:
• Task B is dependent on A
• Task C is dependent on B
• Tasks C and D can run in parallel
• Task E is dependent on D
• Task F is dependent on C, D, and E
• The list of dependent tasks is referred to as an activity sequence, which will
be used to determine the critical path.
18.
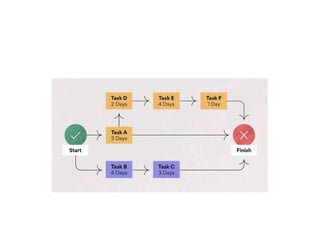
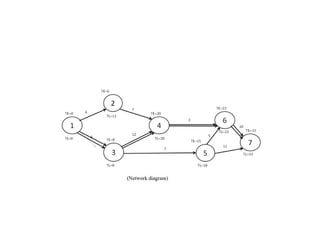
3. Create anetwork diagram
• The next step is to turn the work breakdown structure into a network
diagram, which is a flowchart displaying the chronology of critical path
activities.
• Create a box for each task and use arrows to depict task dependencies.
• You’ll add other time-bound components to the network diagram until you
have the general project schedule figured out.
20.
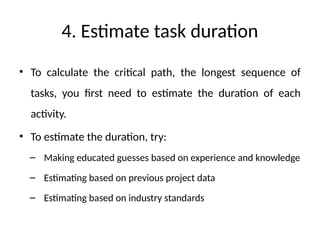
4. Estimate taskduration
• To calculate the critical path, the longest sequence of
tasks, you first need to estimate the duration of each
activity.
• To estimate the duration, try:
– Making educated guesses based on experience and knowledge
– Estimating based on previous project data
– Estimating based on industry standards
21.
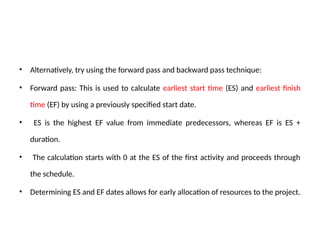
• Alternatively, tryusing the forward pass and backward pass technique:
• Forward pass: This is used to calculate earliest start time (ES) and earliest finish
time (EF) by using a previously specified start date.
• ES is the highest EF value from immediate predecessors, whereas EF is ES +
duration.
• The calculation starts with 0 at the ES of the first activity and proceeds through
the schedule.
• Determining ES and EF dates allows for early allocation of resources to the project.
22.
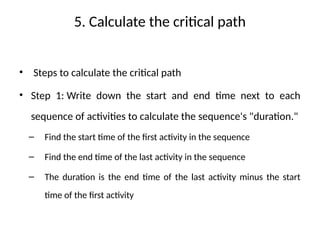
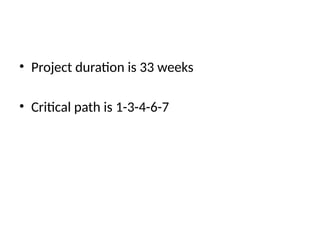
5. Calculate thecritical path
• Steps to calculate the critical path
• Step 1: Write down the start and end time next to each
sequence of activities to calculate the sequence's "duration."
– Find the start time of the first activity in the sequence
– Find the end time of the last activity in the sequence
– The duration is the end time of the last activity minus the start
time of the first activity
23.
• Step 2:Determine the number of dependencies along each
sequence.
• Step 3: The sequence of activities with the longest duration (end of
sequence date - beginning of sequence date) is the critical path.
• If multiple sequences of activities have the same duration, the
sequence with the greater number of dependencies is the critical
path.
24.
6. Calculate thefloat
• Float, or slack, refers to the amount of flexibility of a
given task.
• It indicates how much the task can be delayed without
impacting subsequent tasks or the project end date.
• Finding the float is useful in gauging how much flexibility
the project has. Float is a resource that should be used to
cover project risks or unexpected issues that come up.
27.
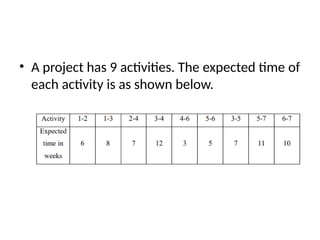
• A projecthas 9 activities. The expected time of
each activity is as shown below.
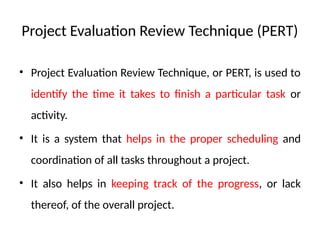
Project Evaluation ReviewTechnique (PERT)
• Project Evaluation Review Technique, or PERT, is used to
identify the time it takes to finish a particular task or
activity.
• It is a system that helps in the proper scheduling and
coordination of all tasks throughout a project.
• It also helps in keeping track of the progress, or lack
thereof, of the overall project.
34.
• In the1950s, the Project Evaluation Review
Technique was developed by the US Navy to
manage the Polaris submarine missile
program of their Special Projects Office.
36.
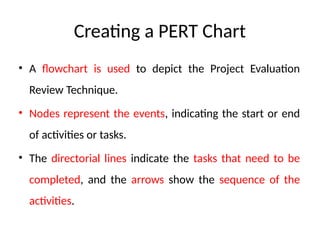
Creating a PERTChart
• A flowchart is used to depict the Project Evaluation
Review Technique.
• Nodes represent the events, indicating the start or end
of activities or tasks.
• The directorial lines indicate the tasks that need to be
completed, and the arrows show the sequence of the
activities.
37.
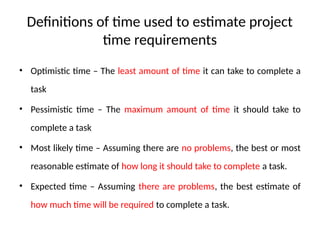
Definitions of timeused to estimate project
time requirements
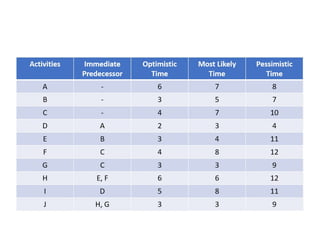
• Optimistic time – The least amount of time it can take to complete a
task
• Pessimistic time – The maximum amount of time it should take to
complete a task
• Most likely time – Assuming there are no problems, the best or most
reasonable estimate of how long it should take to complete a task.
• Expected time – Assuming there are problems, the best estimate of
how much time will be required to complete a task.
38.
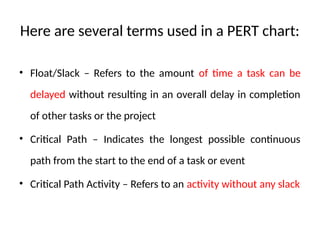
Here are severalterms used in a PERT chart:
• Float/Slack – Refers to the amount of time a task can be
delayed without resulting in an overall delay in completion
of other tasks or the project
• Critical Path – Indicates the longest possible continuous
path from the start to the end of a task or event
• Critical Path Activity – Refers to an activity without any slack
39.
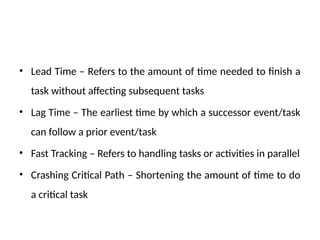
• Lead Time– Refers to the amount of time needed to finish a
task without affecting subsequent tasks
• Lag Time – The earliest time by which a successor event/task
can follow a prior event/task
• Fast Tracking – Refers to handling tasks or activities in parallel
• Crashing Critical Path – Shortening the amount of time to do
a critical task
40.
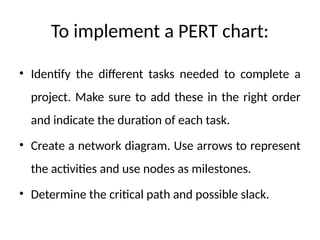
To implement aPERT chart:
• Identify the different tasks needed to complete a
project. Make sure to add these in the right order
and indicate the duration of each task.
• Create a network diagram. Use arrows to represent
the activities and use nodes as milestones.
• Determine the critical path and possible slack.
41.
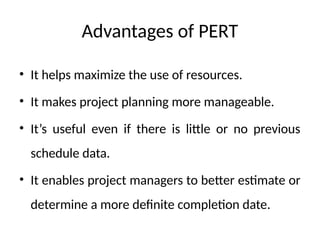
Advantages of PERT
•It helps maximize the use of resources.
• It makes project planning more manageable.
• It’s useful even if there is little or no previous
schedule data.
• It enables project managers to better estimate or
determine a more definite completion date.
42.
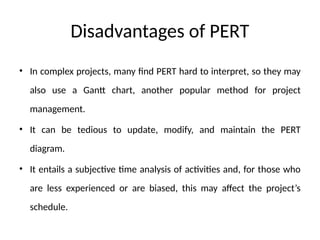
Disadvantages of PERT
•In complex projects, many find PERT hard to interpret, so they may
also use a Gantt chart, another popular method for project
management.
• It can be tedious to update, modify, and maintain the PERT
diagram.
• It entails a subjective time analysis of activities and, for those who
are less experienced or are biased, this may affect the project’s
schedule.
43.
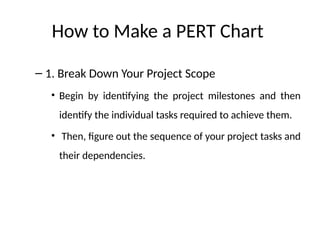
How to Makea PERT Chart
– 1. Break Down Your Project Scope
• Begin by identifying the project milestones and then
identify the individual tasks required to achieve them.
• Then, figure out the sequence of your project tasks and
their dependencies.
44.
• 2. CreateYour PERT Chart
– Now that you have the information that you need,
you can now make the PERT diagram.
45.
• 3. EstimateYour Project Duration
– Now that you have drafted a PERT diagram and
added task details, it’s time to add the estimated
durations of all tasks to create a project schedule.
– If you’re drawing your PERT diagram, you’ll use
the PERT chart formula to do so.
46.
• 4. Findthe Critical Path & Slack
– While CPM and PERT are two different methods,
once you have a PERT chart that has your project
tasks, their durations and due dates, you can
calculate the critical path and identify any possible
slack.
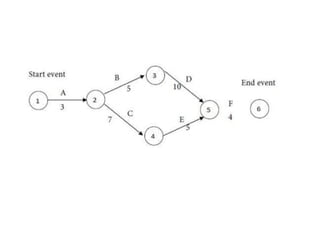
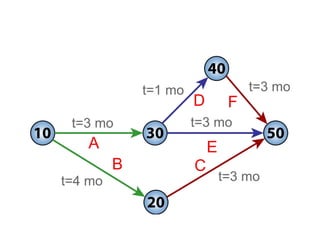
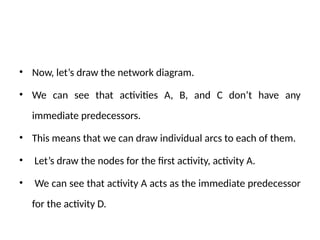
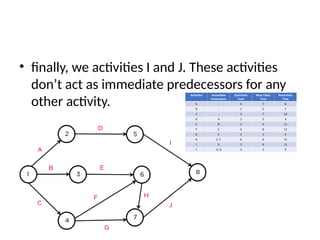
• Now, let’sdraw the network diagram.
• We can see that activities A, B, and C don’t have any
immediate predecessors.
• This means that we can draw individual arcs to each of them.
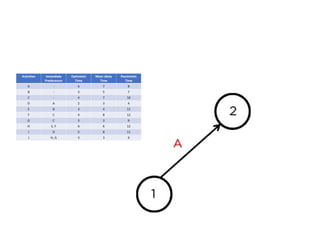
• Let’s draw the nodes for the first activity, activity A.
• We can see that activity A acts as the immediate predecessor
for the activity D.
51.
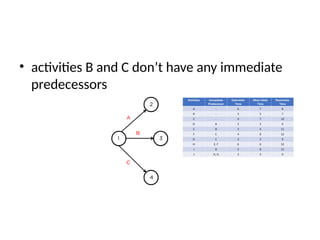
• activities Band C don’t have any immediate
predecessors
52.
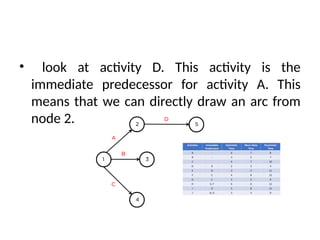
• look atactivity D. This activity is the
immediate predecessor for activity A. This
means that we can directly draw an arc from
node 2.
53.
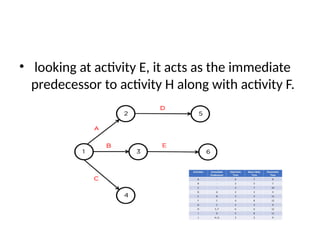
• looking atactivity E, it acts as the immediate
predecessor to activity H along with activity F.
54.
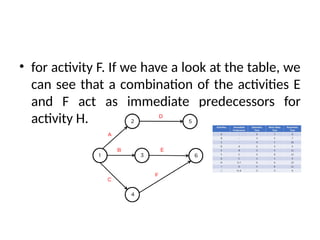
• for activityF. If we have a look at the table, we
can see that a combination of the activities E
and F act as immediate predecessors for
activity H.
55.
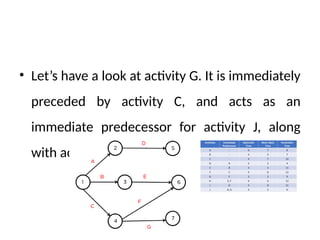
• Let’s havea look at activity G. It is immediately
preceded by activity C, and acts as an
immediate predecessor for activity J, along
with activity H.
56.
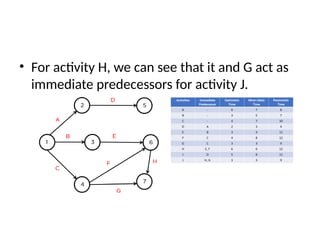
• For activityH, we can see that it and G act as
immediate predecessors for activity J.
57.
• finally, weactivities I and J. These activities
don’t act as immediate predecessors for any
other activity.
58.
Linear programming (LP)
•Linear programming (LP) is a mathematical
technique used in management to optimize
resource allocation and decision-making
processes.
59.
Definition
• Linear Programmingis a method for achieving the
best outcome (such as maximum profit or minimum
cost) in a mathematical model whose requirements
are represented by linear relationships.
• The goal is to determine the optimal way to allocate
limited resources.
60.
Key Components
• ObjectiveFunction: This is the function that needs to be
optimized. For instance, maximizing profit or minimizing costs.
• Decision Variables: These are the variables that decision-
makers will decide the values of, such as the quantity of
products to produce or the number of workers to hire.
61.
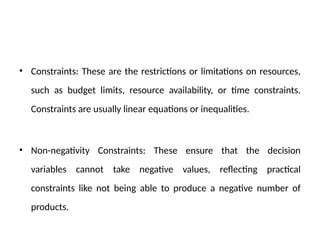
• Constraints: Theseare the restrictions or limitations on resources,
such as budget limits, resource availability, or time constraints.
Constraints are usually linear equations or inequalities.
• Non-negativity Constraints: These ensure that the decision
variables cannot take negative values, reflecting practical
constraints like not being able to produce a negative number of
products.
62.
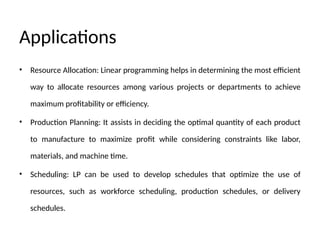
Applications
• Resource Allocation:Linear programming helps in determining the most efficient
way to allocate resources among various projects or departments to achieve
maximum profitability or efficiency.
• Production Planning: It assists in deciding the optimal quantity of each product
to manufacture to maximize profit while considering constraints like labor,
materials, and machine time.
• Scheduling: LP can be used to develop schedules that optimize the use of
resources, such as workforce scheduling, production schedules, or delivery
schedules.
63.
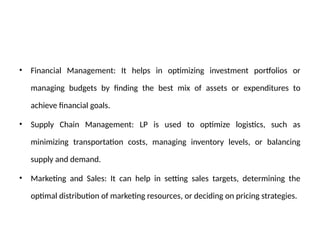
• Financial Management:It helps in optimizing investment portfolios or
managing budgets by finding the best mix of assets or expenditures to
achieve financial goals.
• Supply Chain Management: LP is used to optimize logistics, such as
minimizing transportation costs, managing inventory levels, or balancing
supply and demand.
• Marketing and Sales: It can help in setting sales targets, determining the
optimal distribution of marketing resources, or deciding on pricing strategies.
64.
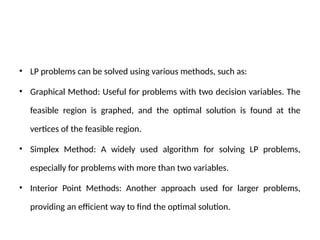
• LP problemscan be solved using various methods, such as:
• Graphical Method: Useful for problems with two decision variables. The
feasible region is graphed, and the optimal solution is found at the
vertices of the feasible region.
• Simplex Method: A widely used algorithm for solving LP problems,
especially for problems with more than two variables.
• Interior Point Methods: Another approach used for larger problems,
providing an efficient way to find the optimal solution.
65.
Transportation problem
• Thetransportation problem is a type of linear
programming problem used to determine the most
cost-effective way to transport goods from multiple
suppliers to multiple consumers.
• The objective is to minimize the total transportation
cost while satisfying supply and demand constraints.
66.
Definition
• Transportation Problem:It involves finding the
optimal distribution plan that minimizes the
total transportation cost of shipping goods
from a set of suppliers (or sources) to a set of
consumers (or destinations), given the supply
and demand constraints.
67.
Key Components
• Suppliers:Entities that provide goods. Each
supplier has a certain supply capacity.
• Consumers: Entities that receive goods. Each
consumer has a certain demand that needs to
be fulfilled.
• Cost Matrix: A matrix representing the cost of
transporting one unit of goods from each
supplier to each consumer.
68.
• Supply Constraints:Each supplier's total
shipment must not exceed its supply capacity.
• Demand Constraints: Each consumer’s total
receipt must meet its demand exactly.
69.
Special Cases
• BalancedTransportation Problem: If the total
supply equals the total demand, the problem
is balanced.
• In this case, every unit of supply is exactly
used to meet demand.
70.
• Unbalanced TransportationProblem: If the
total supply does not equal total demand,
dummy suppliers or consumers are introduced
to balance the problem.
• Dummy suppliers have zero costs and supply,
while dummy consumers have zero demand.
71.
Benefits
• Cost Efficiency:Helps in minimizing transportation
costs, leading to significant savings.
• Optimal Allocation: Ensures that supply meets
demand in the most economical way.
• Scalability: Can be adapted to various sizes and
complexities of transportation networks.
72.
Limitations
• Linear Assumptions:Assumes linear costs and
constraints, which may not capture all real-
world scenarios.
• Complexity in Large Problems: Solving large-
scale transportation problems can be
computationally intensive.