Downloaded 1,103 times
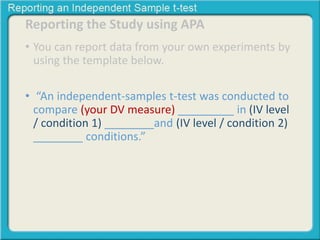
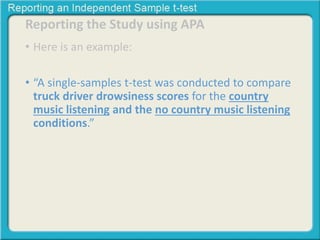
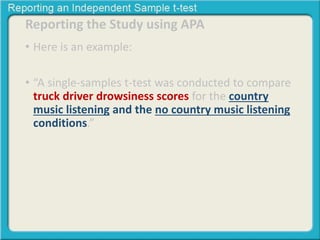
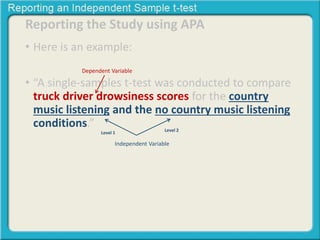
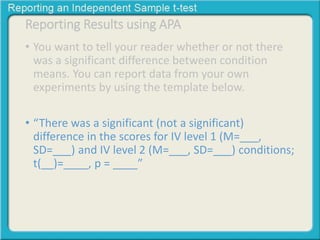
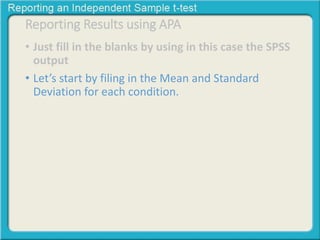
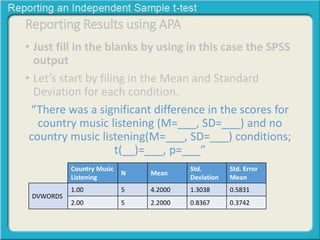
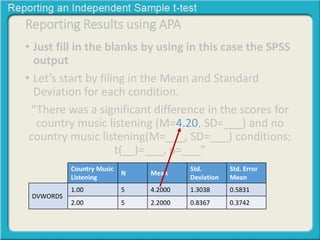
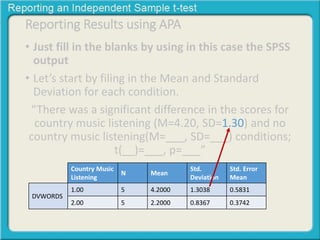

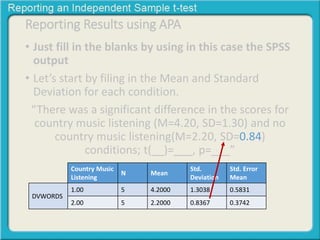
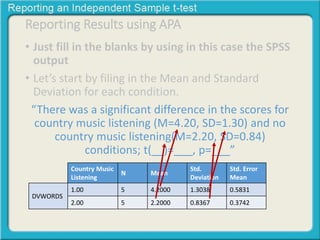

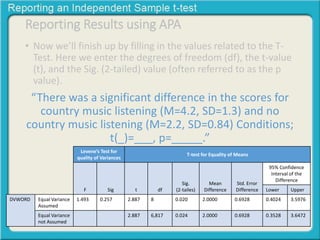
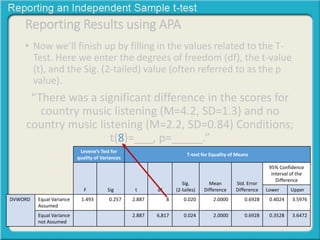
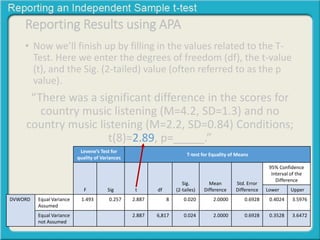
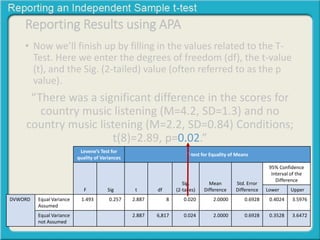
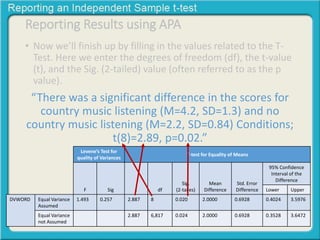
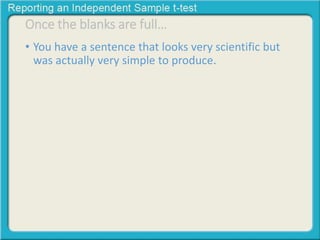
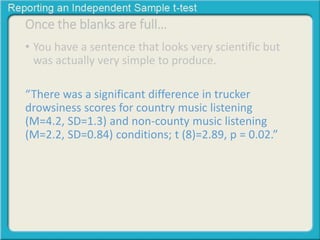

The document provides a template for reporting the results of an independent samples t-test in APA format. It demonstrates how to write a sentence summarizing that there was a significant/non-significant difference between two groups by including the group means, standard deviations, t-statistic, and p-value filled in from a sample SPSS output.


