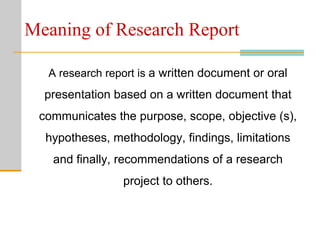
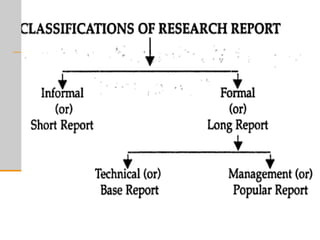
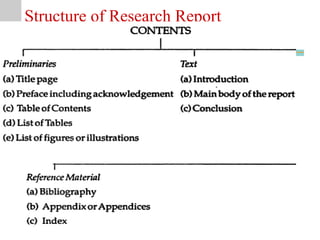
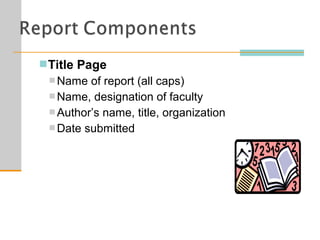
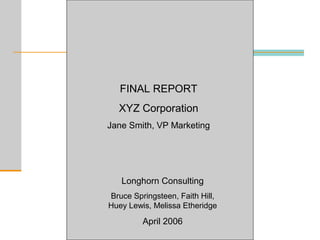
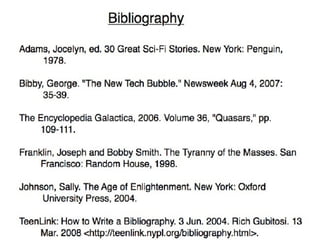
Report Preparation
Meaning of Research Report
A research report is a written document or oral
presentation based on a written document that
communicates the purpose, scope, objective (s),
hypotheses, methodology, findings, limitations
and finally, recommendations of a research
project to others.
Structure of Research Report
Title Page
 Name of report (all caps)
 Name, designation of faculty
 Author’s name, title, organization
 Date submitted
FINAL REPORT
XYZ Corporation
Jane Smith, VP Marketing
Longhorn Consulting
Bruce Springsteen, Faith Hill,
Huey Lewis, Melissa Etheridge
April 2006
Table of Contents
 Show beginning page number where each
report heading appears
 Connect page numbers with leaders (spaced
dots)
Executive Summary
 One of most important parts of report
 Synopsis (overview) of report
 Concentrate on what management needs to
know
 Summarizes
 Purpose
 Scope
 Methodology
 Findings
 Conclusions
 Recommendations
Executive Summary
 Organized same as report
 Style and tone same as report
 Avoid unexplained jargon/abbreviations
 Do not refer to figures/tables presented later
 Should not contain exhibits or footnotes
 Include headings/make skimmable
 Use transitional words
 Length should be generally 1/10 of whole
report
Body
 Discuss, analyze, interpret research findings
 Arrange findings in logical segments following
outline
 Use clear, descriptive headings/skimmable
Conclusions
 It ties the whole thesis together.
 Explain findings in relation to original problem
Recommendations
 Make recommendations on suggested action to
be taken
Appendix
 All items must be referred to in the text and
listed on the table of contents
 Items of interest to some, but not all, readers
 For example, data questionnaires or computer
printouts
References
 List all references in section called “Works
Cited” or “References”
 Include all text, online, and live sources
 Follow style manual for citing sources
Bibliography
Language
 Be clear, concise and correct. Use:
 Familiar words
 technical terms should be defined within the text
 Active verbs for majority of the report
 Avoid
 Ambiguity
 Loaded words
 Clichés e.g. ‘a can of worms’
 Jargon
Language cont.
 Avoid:
 Superfluous words and phrases e.g. in order
to = to, in the event that = if
 Tautology - saying the same thing twice with
different words in the same sentence e.g. the
brevity of the notice given was far too short
 Split infinitives e.g. to boldly go
 Double negatives; not never = sometimes
Language cont.
 Avoid
 Joining two sentences which are not logically
related
 Sentences ending with prepositions e.g. to put
up with
 Long sentences
 Professional report may have to be written in
the third person
Spelling and punctuation
 Spelling
 Word processed material should always use
the spell checker
 Word uses the American spelling e.g. formalize
not formalise
 Punctuation
Report Writing
 Readers. A report should be written for a specific reader or
readers: the marketing managers who will use the results.
 Easy to follow. The report should be easy to follow. It should
be structured logically and written clearly.
 Presentable and professional appearance. The looks of a
report are important.
 Objective. Objectivity is a virtue that should guide report
writing. The rule is, "Tell it like it is."
 Reinforce text with tables and graphs. It is important to
reinforce key information in the text with tables, graphs,
pictures, maps, and other visual devices.
 Brief. A report should be brief and concise. Yet, brevity should
not be achieved at the expense of completeness.
Guidelines for Tables
 Title and number. Every table should have a number (1a) and title
(1b).
 Arrangement of data items. The arrangement of data items in a table
should emphasize the most significant aspect of the data.
 Basis of measurement. The basis or unit of measurement should be
clearly stated (3a).
 Leaders, rulings, spaces. Leaders, dots or hyphens used to lead the
eye horizontally, impart uniformity and improve readability (4a). Instead
of ruling the table horizontally or vertically, white spaces (4b) are used
to set off data items. Skipping lines after different sections of the data
can also assist the eye. Horizontal rules (4c) are often used after the
headings.
 Explanations and comments: Headings, stubs, and footnotes.
Designations placed over the vertical columns are called headings (5a).
Designations placed in the left-hand column are called stubs (5b).
Information that cannot be incorporated in the table should be explained
by footnotes (5c).
 Sources of the data. If the data contained in the table are secondary,
the source of data should be cited (6a).
MFG 1997 1998 1999 2000 2001
GM 4,766,000 4,604,000 5,017,000 4,953,000 4,898,517
Ford 4,432,000 4,370,000 4,787,000 4,933,000 4,661,685
Chrysler 2,312,400 2,548,900 2,693,000 2,470,000 2,196,000
Honda 940,037 1,009,600 1,076,893 1,158,860 1,207,639
Toyota 1,230,583 1,361,025 1,515,366 1,656,981 1,787,882
Nissan 658,000 628,000 713,000 744,000 695,640
Other* 1,161,980 1,444,475 1,615,741 1,901,159 1,752,637
Total 15,501,000 15,966,000 17,418,000 17,817,000 17,200,000
TABLE 22.1
U.S. Automotive Sales 1997-2001
Unit Sales
1
b
1
a 3
a
6
a
5
b
5
a
4
c
2
a
4
a
5
c
4
b
* - includes all other producers
Source: Company Websites
U.S. Auto Sales 1997 - 2001
Table 22.1
Guidelines for Graphs
Geographic and Other Maps
 Geographic maps can pertain to countries, states, counties,
sales territories, and other divisions.
 Chapter 21 showed examples of product-positioning.
Guidelines for Graphs
Round or Pie Charts
 In a pie chart, the area of each section, as a percentage of the
total area of the circle, reflects the percentage associated with
the value of a specific variable.
 A pie chart is not useful for displaying relationships over time or
relationships among several variables.
 As a general guideline, a pie chart should not require more than
seven sections.
Pie Chart of 1996 U.S. Auto Sales
Fig. 22.2
Guidelines for Graphs
Line Charts
 A line chart connects a series of data points using continuous
lines.
 This is an attractive way of illustrating trends and changes over
time.
 Several series can be compared on the same chart, and
forecasts, interpolations, and extrapolations can be shown.
Guidelines for Graphs
Line Charts
 A stratum chart is a set of line charts in which the data are
successively aggregated over the series.
 Areas between the line charts display the magnitudes of the
relevant variables.
Stratum Chart of Auto Sales by Manufacturer (1997-2001)
0
2,000,000
4,000,000
6,000,000
8,000,000
10,000,000
12,000,000
14,000,000
16,000,000
18,000,000
20,000,000
1997 1998 1999 2000 2001
Other
Nissan
Toyota
Honda
Chrysler
Ford
GM
Fig. 22.4
Stratum Chart of U.S. Auto Sales
Guidelines for Graphs
Pictographs
 A pictograph uses small pictures or symbols to display the
data.
 Pictographs do not depict results precisely. Hence, caution
should be exercised when using them.
Pictograph of Auto Sales (2001)
0 1,000,000 2,000,000 3,000,000 4,000,000 5,000,000 6,000,000
GM
Ford
Chrysler
Honda
Toyota
Nissan
Manufacturer
Cars Sold
Pictograph for 1996 U.S. Auto
Sales
*Each Symbol Equals 1,000,000 Units
Guidelines for Graphs
Histograms and Bar Charts
 A bar chart displays data in various bars that may be positioned
horizontally or vertically.
 The histogram is a vertical bar chart and in which the height of
the bars represents the relative or cumulative frequency of
occurrence of a specific variable.
Histogram of Auto Sales by Manufacturer (2001)
0
1,000,000
2,000,000
3,000,000
4,000,000
5,000,000
6,000,000
GM Ford Chrysler Honda Toyota Nissan Other
Figure 22.6
Histogram of 1996 U.S. Auto Sales
Make
Units
Can be
OR
Report preparation

Report preparation

  • 3.
  • 4.
    Meaning of ResearchReport A research report is a written document or oral presentation based on a written document that communicates the purpose, scope, objective (s), hypotheses, methodology, findings, limitations and finally, recommendations of a research project to others.
  • 6.
  • 7.
    Title Page  Nameof report (all caps)  Name, designation of faculty  Author’s name, title, organization  Date submitted
  • 8.
    FINAL REPORT XYZ Corporation JaneSmith, VP Marketing Longhorn Consulting Bruce Springsteen, Faith Hill, Huey Lewis, Melissa Etheridge April 2006
  • 9.
    Table of Contents Show beginning page number where each report heading appears  Connect page numbers with leaders (spaced dots)
  • 10.
    Executive Summary  Oneof most important parts of report  Synopsis (overview) of report  Concentrate on what management needs to know  Summarizes  Purpose  Scope  Methodology  Findings  Conclusions  Recommendations
  • 11.
    Executive Summary  Organizedsame as report  Style and tone same as report  Avoid unexplained jargon/abbreviations  Do not refer to figures/tables presented later  Should not contain exhibits or footnotes  Include headings/make skimmable  Use transitional words  Length should be generally 1/10 of whole report
  • 12.
    Body  Discuss, analyze,interpret research findings  Arrange findings in logical segments following outline  Use clear, descriptive headings/skimmable
  • 13.
    Conclusions  It tiesthe whole thesis together.  Explain findings in relation to original problem
  • 14.
    Recommendations  Make recommendationson suggested action to be taken
  • 15.
    Appendix  All itemsmust be referred to in the text and listed on the table of contents  Items of interest to some, but not all, readers  For example, data questionnaires or computer printouts
  • 16.
    References  List allreferences in section called “Works Cited” or “References”  Include all text, online, and live sources  Follow style manual for citing sources
  • 17.
  • 20.
    Language  Be clear,concise and correct. Use:  Familiar words  technical terms should be defined within the text  Active verbs for majority of the report  Avoid  Ambiguity  Loaded words  Clichés e.g. ‘a can of worms’  Jargon
  • 21.
    Language cont.  Avoid: Superfluous words and phrases e.g. in order to = to, in the event that = if  Tautology - saying the same thing twice with different words in the same sentence e.g. the brevity of the notice given was far too short  Split infinitives e.g. to boldly go  Double negatives; not never = sometimes
  • 22.
    Language cont.  Avoid Joining two sentences which are not logically related  Sentences ending with prepositions e.g. to put up with  Long sentences  Professional report may have to be written in the third person
  • 23.
    Spelling and punctuation Spelling  Word processed material should always use the spell checker  Word uses the American spelling e.g. formalize not formalise  Punctuation
  • 24.
    Report Writing  Readers.A report should be written for a specific reader or readers: the marketing managers who will use the results.  Easy to follow. The report should be easy to follow. It should be structured logically and written clearly.  Presentable and professional appearance. The looks of a report are important.  Objective. Objectivity is a virtue that should guide report writing. The rule is, "Tell it like it is."  Reinforce text with tables and graphs. It is important to reinforce key information in the text with tables, graphs, pictures, maps, and other visual devices.  Brief. A report should be brief and concise. Yet, brevity should not be achieved at the expense of completeness.
  • 25.
    Guidelines for Tables Title and number. Every table should have a number (1a) and title (1b).  Arrangement of data items. The arrangement of data items in a table should emphasize the most significant aspect of the data.  Basis of measurement. The basis or unit of measurement should be clearly stated (3a).  Leaders, rulings, spaces. Leaders, dots or hyphens used to lead the eye horizontally, impart uniformity and improve readability (4a). Instead of ruling the table horizontally or vertically, white spaces (4b) are used to set off data items. Skipping lines after different sections of the data can also assist the eye. Horizontal rules (4c) are often used after the headings.  Explanations and comments: Headings, stubs, and footnotes. Designations placed over the vertical columns are called headings (5a). Designations placed in the left-hand column are called stubs (5b). Information that cannot be incorporated in the table should be explained by footnotes (5c).  Sources of the data. If the data contained in the table are secondary, the source of data should be cited (6a).
  • 26.
    MFG 1997 19981999 2000 2001 GM 4,766,000 4,604,000 5,017,000 4,953,000 4,898,517 Ford 4,432,000 4,370,000 4,787,000 4,933,000 4,661,685 Chrysler 2,312,400 2,548,900 2,693,000 2,470,000 2,196,000 Honda 940,037 1,009,600 1,076,893 1,158,860 1,207,639 Toyota 1,230,583 1,361,025 1,515,366 1,656,981 1,787,882 Nissan 658,000 628,000 713,000 744,000 695,640 Other* 1,161,980 1,444,475 1,615,741 1,901,159 1,752,637 Total 15,501,000 15,966,000 17,418,000 17,817,000 17,200,000 TABLE 22.1 U.S. Automotive Sales 1997-2001 Unit Sales 1 b 1 a 3 a 6 a 5 b 5 a 4 c 2 a 4 a 5 c 4 b * - includes all other producers Source: Company Websites U.S. Auto Sales 1997 - 2001 Table 22.1
  • 27.
    Guidelines for Graphs Geographicand Other Maps  Geographic maps can pertain to countries, states, counties, sales territories, and other divisions.  Chapter 21 showed examples of product-positioning.
  • 28.
    Guidelines for Graphs Roundor Pie Charts  In a pie chart, the area of each section, as a percentage of the total area of the circle, reflects the percentage associated with the value of a specific variable.  A pie chart is not useful for displaying relationships over time or relationships among several variables.  As a general guideline, a pie chart should not require more than seven sections.
  • 29.
    Pie Chart of1996 U.S. Auto Sales Fig. 22.2
  • 30.
    Guidelines for Graphs LineCharts  A line chart connects a series of data points using continuous lines.  This is an attractive way of illustrating trends and changes over time.  Several series can be compared on the same chart, and forecasts, interpolations, and extrapolations can be shown.
  • 31.
    Guidelines for Graphs LineCharts  A stratum chart is a set of line charts in which the data are successively aggregated over the series.  Areas between the line charts display the magnitudes of the relevant variables.
  • 32.
    Stratum Chart ofAuto Sales by Manufacturer (1997-2001) 0 2,000,000 4,000,000 6,000,000 8,000,000 10,000,000 12,000,000 14,000,000 16,000,000 18,000,000 20,000,000 1997 1998 1999 2000 2001 Other Nissan Toyota Honda Chrysler Ford GM Fig. 22.4 Stratum Chart of U.S. Auto Sales
  • 33.
    Guidelines for Graphs Pictographs A pictograph uses small pictures or symbols to display the data.  Pictographs do not depict results precisely. Hence, caution should be exercised when using them.
  • 34.
    Pictograph of AutoSales (2001) 0 1,000,000 2,000,000 3,000,000 4,000,000 5,000,000 6,000,000 GM Ford Chrysler Honda Toyota Nissan Manufacturer Cars Sold Pictograph for 1996 U.S. Auto Sales *Each Symbol Equals 1,000,000 Units
  • 35.
    Guidelines for Graphs Histogramsand Bar Charts  A bar chart displays data in various bars that may be positioned horizontally or vertically.  The histogram is a vertical bar chart and in which the height of the bars represents the relative or cumulative frequency of occurrence of a specific variable.
  • 36.
    Histogram of AutoSales by Manufacturer (2001) 0 1,000,000 2,000,000 3,000,000 4,000,000 5,000,000 6,000,000 GM Ford Chrysler Honda Toyota Nissan Other Figure 22.6 Histogram of 1996 U.S. Auto Sales Make Units
  • 37.