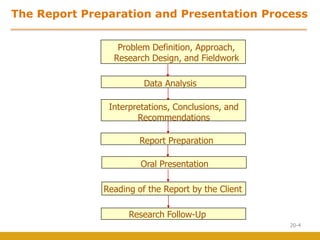
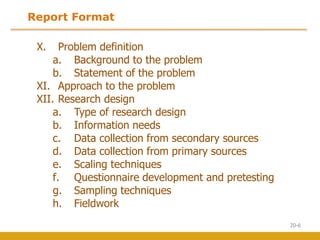
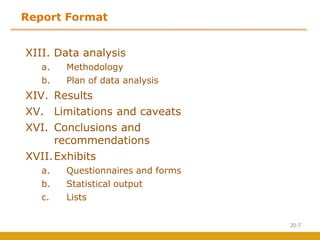
20-1
REPORT PREPARATION AND
PRESENTATION
MAR 3325 - Marketing Research I
Department of Marketing Management
Faculty of Management Studies and Commerce
University of Sri Jayewardenepura
20-2
Session Outline
1) Overview
2) Importance of the Report and Presentation
3) The Report Preparation and Presentation
Process
4) Report Preparation
i. Report Format
ii. Report Writing
iii. Guidelines for Tables
iv. Guidelines for Graphs
5) Oral Presentation
20-3
Importance of the Report and Presentation
For the following reasons, the report and its presentation
are important parts of the marketing research project:
1. They are the tangible products of the research effort.
2. Management decisions are guided by the report and the
presentation.
3. The involvement of many marketing managers in the
project is limited to the written report and the oral
presentation.
4. Management's decision to undertake marketing research in
the future or to use the particular research supplier again
will be influenced by the perceived usefulness of the report
and the presentation.
20-4
The Report Preparation and Presentation Process
Data Analysis
Oral Presentation
Report Preparation
Interpretations, Conclusions, and
Recommendations
Reading of the Report by the Client
Research Follow-Up
Problem Definition, Approach,
Research Design, and Fieldwork
20-5
Report Format
I. Title page
II. Letter of transmittal
III. Letter of authorization
IV. Table of contents
V. List of tables
VI. List of graphs
VII. List of appendices
VIII. List of exhibits
IX. Executive summary
a. Major findings
b. Conclusions
c. Recommendations
20-6
Report Format
X. Problem definition
a. Background to the problem
b. Statement of the problem
XI. Approach to the problem
XII. Research design
a. Type of research design
b. Information needs
c. Data collection from secondary sources
d. Data collection from primary sources
e. Scaling techniques
f. Questionnaire development and pretesting
g. Sampling techniques
h. Fieldwork
20-7
Report Format
XIII. Data analysis
a. Methodology
b. Plan of data analysis
XIV. Results
XV. Limitations and caveats
XVI. Conclusions and
recommendations
XVII.Exhibits
a. Questionnaires and forms
b. Statistical output
c. Lists
20-8
Report Writing
• Readers. A report should be written for a specific reader or
readers: the marketing managers who will use the results.
• Easy to follow. The report should be easy to follow. It
should be structured logically and written clearly.
• Presentable and professional appearance. The look of a
report is important.
• Objective. Objectivity is a virtue that should guide report
writing. The rule is, "Tell it like it is."
• Reinforce text with tables and graphs. It is important to
reinforce key information in the text with tables, graphs,
pictures, maps, and other visual devices.
• Terse. A report should be terse and concise. Yet, brevity
should not be achieved at the expense of completeness.
20-9
Guidelines for Tables
• Title and number. Every table should have a number (1a) and title
(1b).
• Arrangement of data items. The arrangement of data items in a table
should emphasize the most significant aspect of the data.
• Basis of measurement. The basis or unit of measurement should be
clearly stated (3a).
• Leaders, rulings, spaces. Leaders, dots or hyphens used to lead the
eye horizontally, impart uniformity and improve readability (4a). Instead
of ruling the table horizontally or vertically, white spaces (4b) are used to
set off data items. Skipping lines after different sections of the data can
also assist the eye. Horizontal rules (4c) are often used after the
headings.
• Explanations and comments: Headings, stubs, and footnotes.
Designations placed over the vertical columns are called headings (5a).
Designations placed in the left-hand column are called stubs (5b).
Information that cannot be incorporated in the table should be explained
by footnotes (5c).
• Sources of the data. If the data contained in the table are secondary,
the source of data should be cited (6a).
20-10
U.S. Auto Sales 2003 - 2007
20-11
Guidelines for Graphs: Round or Pie Charts
• In a pie chart, the area of each section, as a
percentage of the total area of the circle, reflects
the percentage associated with the value of a
specific variable.
• A pie chart is not useful for displaying
relationships over time or relationships among
several variables.
• As a general guideline, a pie chart should not
require more than seven sections.
20-12
Pie Chart of 2007 U.S. Auto Sales
24%
18%
13%
18%
11%
7%
9%
GM
Ford
Chrysler
Toyota
Honda
Nissan
Other
Fig. 23.2
Include the units
of value within
each slice
20-13
Guidelines for Graphs: Line Charts
• A line chart connects a series of data points
using continuous lines.
• This is an attractive way of illustrating trends
and changes over time.
• Several series can be compared on the same
chart, and forecasts can be shown.
20-14
Line Chart of Total U.S. Auto Sales
Fig. 23.3
0
500000
1000000
1500000
2000000
2500000
3000000
3500000
4000000
4500000
5000000
2003 2004 2005 2006 2007
Year
Unit
Sales
GM
Ford
Chrysler
Toyota
Honda
Nissan
Other
20-15
Guidelines for Graphs: Pictographs
• A pictograph uses small pictures or symbols
to display the data.
• Pictographs do not depict results precisely.
Hence, caution should be exercised when
using them.
20-16
Pictograph for 2007 U.S. Auto Sales
Fig. 23.5
*Each Symbol Equals 1,000,000 Units
GM
Chrysler
Toyota
Honda
Nissan
Other
Ford
20-17
Guidelines for Graphs:
Histograms and Bar Charts
• A bar chart displays data in various bars
that may be positioned horizontally or
vertically.
• The histogram is a vertical bar chart in
which the height of the bars represents the
relative or cumulative frequency of
occurrence of a specific variable.
20-18
Figure 23.6
Histogram of 2007 U.S. Auto Sales
0
500,000
1,000,000
1,500,000
2,000,000
2,500,000
3,000,000
3,500,000
4,000,000
4,500,000
GM
Ford
Chrysler
Toyota
Honda
Nissan
other
Figure Number : Title
Unit
of
Measure
Legend
20-19
Oral Presentation
• The key to an effective presentation is preparation.
• A written script or detailed outline should be prepared
following the format of the written report.
• The presentation must be geared to the audience.
• The presentation should be rehearsed several times
before it is made to the management.
• Visual aids, such as tables and graphs, should be
displayed with a variety of media.
• It is important to maintain eye contact and interact
with the audience during the presentation.
20-20
• SPSS OLAP cubes are interactive tables that enable
you to slice your data in different ways for data
exploration and presentation.
• Smart Viewer enables the researcher to distribute
reports, graphs, tables, even pivotal report cubes,
over the web. Company managers can be
empowered to interact with the results by putting a
report cube on the Web, intranet, or extranet. Thus,
they can answer their own questions by drilling down
for more detail and creating new views of the data.

Report Preperation.ppt

  • 1.
    20-1 REPORT PREPARATION AND PRESENTATION MAR3325 - Marketing Research I Department of Marketing Management Faculty of Management Studies and Commerce University of Sri Jayewardenepura
  • 2.
    20-2 Session Outline 1) Overview 2)Importance of the Report and Presentation 3) The Report Preparation and Presentation Process 4) Report Preparation i. Report Format ii. Report Writing iii. Guidelines for Tables iv. Guidelines for Graphs 5) Oral Presentation
  • 3.
    20-3 Importance of theReport and Presentation For the following reasons, the report and its presentation are important parts of the marketing research project: 1. They are the tangible products of the research effort. 2. Management decisions are guided by the report and the presentation. 3. The involvement of many marketing managers in the project is limited to the written report and the oral presentation. 4. Management's decision to undertake marketing research in the future or to use the particular research supplier again will be influenced by the perceived usefulness of the report and the presentation.
  • 4.
    20-4 The Report Preparationand Presentation Process Data Analysis Oral Presentation Report Preparation Interpretations, Conclusions, and Recommendations Reading of the Report by the Client Research Follow-Up Problem Definition, Approach, Research Design, and Fieldwork
  • 5.
    20-5 Report Format I. Titlepage II. Letter of transmittal III. Letter of authorization IV. Table of contents V. List of tables VI. List of graphs VII. List of appendices VIII. List of exhibits IX. Executive summary a. Major findings b. Conclusions c. Recommendations
  • 6.
    20-6 Report Format X. Problemdefinition a. Background to the problem b. Statement of the problem XI. Approach to the problem XII. Research design a. Type of research design b. Information needs c. Data collection from secondary sources d. Data collection from primary sources e. Scaling techniques f. Questionnaire development and pretesting g. Sampling techniques h. Fieldwork
  • 7.
    20-7 Report Format XIII. Dataanalysis a. Methodology b. Plan of data analysis XIV. Results XV. Limitations and caveats XVI. Conclusions and recommendations XVII.Exhibits a. Questionnaires and forms b. Statistical output c. Lists
  • 8.
    20-8 Report Writing • Readers.A report should be written for a specific reader or readers: the marketing managers who will use the results. • Easy to follow. The report should be easy to follow. It should be structured logically and written clearly. • Presentable and professional appearance. The look of a report is important. • Objective. Objectivity is a virtue that should guide report writing. The rule is, "Tell it like it is." • Reinforce text with tables and graphs. It is important to reinforce key information in the text with tables, graphs, pictures, maps, and other visual devices. • Terse. A report should be terse and concise. Yet, brevity should not be achieved at the expense of completeness.
  • 9.
    20-9 Guidelines for Tables •Title and number. Every table should have a number (1a) and title (1b). • Arrangement of data items. The arrangement of data items in a table should emphasize the most significant aspect of the data. • Basis of measurement. The basis or unit of measurement should be clearly stated (3a). • Leaders, rulings, spaces. Leaders, dots or hyphens used to lead the eye horizontally, impart uniformity and improve readability (4a). Instead of ruling the table horizontally or vertically, white spaces (4b) are used to set off data items. Skipping lines after different sections of the data can also assist the eye. Horizontal rules (4c) are often used after the headings. • Explanations and comments: Headings, stubs, and footnotes. Designations placed over the vertical columns are called headings (5a). Designations placed in the left-hand column are called stubs (5b). Information that cannot be incorporated in the table should be explained by footnotes (5c). • Sources of the data. If the data contained in the table are secondary, the source of data should be cited (6a).
  • 10.
  • 11.
    20-11 Guidelines for Graphs:Round or Pie Charts • In a pie chart, the area of each section, as a percentage of the total area of the circle, reflects the percentage associated with the value of a specific variable. • A pie chart is not useful for displaying relationships over time or relationships among several variables. • As a general guideline, a pie chart should not require more than seven sections.
  • 12.
    20-12 Pie Chart of2007 U.S. Auto Sales 24% 18% 13% 18% 11% 7% 9% GM Ford Chrysler Toyota Honda Nissan Other Fig. 23.2 Include the units of value within each slice
  • 13.
    20-13 Guidelines for Graphs:Line Charts • A line chart connects a series of data points using continuous lines. • This is an attractive way of illustrating trends and changes over time. • Several series can be compared on the same chart, and forecasts can be shown.
  • 14.
    20-14 Line Chart ofTotal U.S. Auto Sales Fig. 23.3 0 500000 1000000 1500000 2000000 2500000 3000000 3500000 4000000 4500000 5000000 2003 2004 2005 2006 2007 Year Unit Sales GM Ford Chrysler Toyota Honda Nissan Other
  • 15.
    20-15 Guidelines for Graphs:Pictographs • A pictograph uses small pictures or symbols to display the data. • Pictographs do not depict results precisely. Hence, caution should be exercised when using them.
  • 16.
    20-16 Pictograph for 2007U.S. Auto Sales Fig. 23.5 *Each Symbol Equals 1,000,000 Units GM Chrysler Toyota Honda Nissan Other Ford
  • 17.
    20-17 Guidelines for Graphs: Histogramsand Bar Charts • A bar chart displays data in various bars that may be positioned horizontally or vertically. • The histogram is a vertical bar chart in which the height of the bars represents the relative or cumulative frequency of occurrence of a specific variable.
  • 18.
    20-18 Figure 23.6 Histogram of2007 U.S. Auto Sales 0 500,000 1,000,000 1,500,000 2,000,000 2,500,000 3,000,000 3,500,000 4,000,000 4,500,000 GM Ford Chrysler Toyota Honda Nissan other Figure Number : Title Unit of Measure Legend
  • 19.
    20-19 Oral Presentation • Thekey to an effective presentation is preparation. • A written script or detailed outline should be prepared following the format of the written report. • The presentation must be geared to the audience. • The presentation should be rehearsed several times before it is made to the management. • Visual aids, such as tables and graphs, should be displayed with a variety of media. • It is important to maintain eye contact and interact with the audience during the presentation.
  • 20.
    20-20 • SPSS OLAPcubes are interactive tables that enable you to slice your data in different ways for data exploration and presentation. • Smart Viewer enables the researcher to distribute reports, graphs, tables, even pivotal report cubes, over the web. Company managers can be empowered to interact with the results by putting a report cube on the Web, intranet, or extranet. Thus, they can answer their own questions by drilling down for more detail and creating new views of the data.