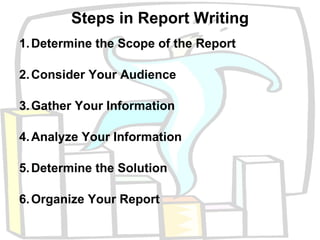
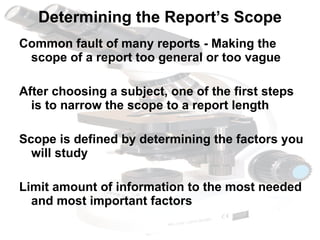
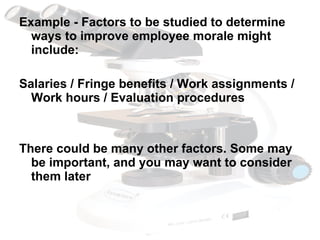
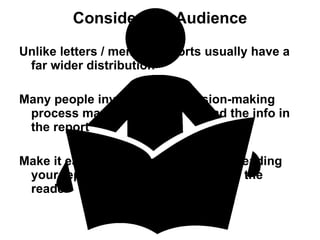
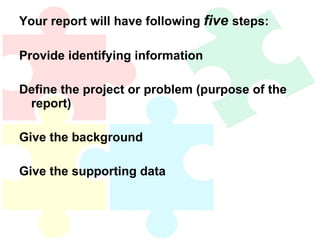
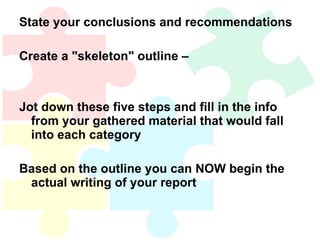
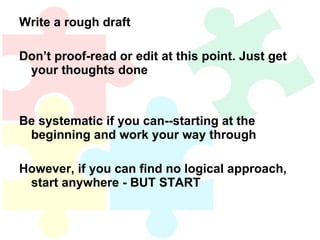
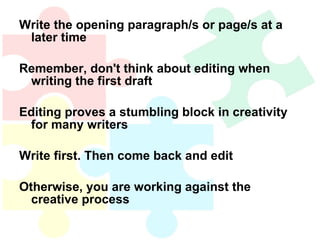
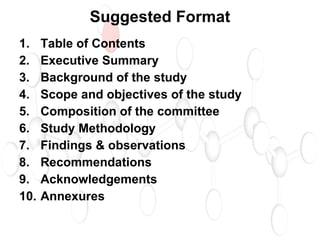
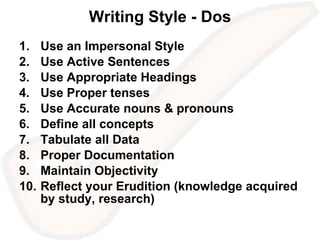
Basics of  Report Writing  A Presentation by Rajiv Bajaj
Learning Objectives  To understand: 1. Purpose of Reports  2. Steps in Writing a Report  3. Elements of Effective Reports 4. Use of Graphics in a Report
Defining Reports A Business Report is an orderly & objective communication of factual information that serves a business purpose The keywords are  Orderly, Objective, Communication, Factual Information & Serves A Business Purpose  Reports are vital to larger organisations – you will probably write them
Types of Business Reports Routine Reports : Monthly Report, Performance Report, Review Report, Sales Report, Press Report Research Reports, Survey Reports & Special Reports Enquiry Reports & Investigation Reports Confidential Reports
Information Reports & Analytical Reports Technical Reports Directors’ Report Annual Reports Committee Reports
Purpose of a Report To have a clear understanding of why a report is written, a written purpose sentence is essential This purpose sentence could be written as either a statement or a question
Examples To determine ways to improve employee morale. (statement) To design a new procedure for the company’s annual inventory. (statement) Should new computers be purchased to replaced the older models? (question) Should the office arrangement be open or modular? (question)
Steps in Report Writing 1. Determine the Scope of the Report 2. Consider Your Audience 3. Gather Your Information 4. Analyze Your Information 5. Determine the Solution 6. Organize Your Report
Determining the Report’s Scope Common fault of many reports - Making the scope of a report too general or too vague After choosing a subject, one of the first steps is to narrow the scope to a report length   Scope is defined by determining the factors you will study Limit amount of information to the most needed and most important factors
Example - Factors to be studied to determine ways to improve employee morale might include: Salaries / Fringe benefits / Work assignments / Work hours / Evaluation procedures There could be many other factors. Some may be important, and you may want to consider them later
For any one report, however, a  reasonable  scope must be clearly defined by determining what factors will be included
Consider the Audience Unlike letters / memos, reports usually have a far wider distribution Many people involved in a decision-making process may have a need to read the info in the report Make it easy for the reader. To make reading your report easier, think in terms of the reader
Each audience has unique needs. Audience considerations include: Need (from your report) Education level Position in the organization Knowledge of your topic or area Responsibility to act Age Biases Preferences Attitudes
Some  false  assumptions regarding audiences: 1. That the person who will first read or edit the report is the audience 2. Audience is a group of specialists in their field 3. Audience is familiar with the subject of the report 4. Audience has time to read the entire report
5. Audience has a strong interest in the subject of the report 6. Author will always be available to discuss the report Avoid false assumptions . Identify everyone who might read the report;  Characterize readers according to professional training, position, personal traits - Determine how & when reader might use the report
Kinds of audiences -  Primary  - People who have to act or make decisions on the basis of the report Secondary - People affected by whatever actions primary audiences would take in response to the report Immediate  - People responsible for evaluating the report and getting it to the right people
Additional questions  to consider regarding your audience are: How much background will they need ? Do you need to define any terms you are using? What language level will be most appropriate for your readers ?
How many and what kind of visual aids should you use ? What will they expect from your report ? Do they prefer finer details or merely a brief presentation that touches upon the highlights ?
Gather Your Information Information you gather can be of two types - Secondary and Primary Secondary  is information gathered and recorded by others Primary  is information you gather and record yourself
Information must be gathered carefully to ensure it is accurate and bias free   Questionnaires, surveys, observation, experiments, historical information, and raw data   Primary Information may be inaccurate, out of date, or biased   Books, internet, reports, newspapers, magazines, pamphlets, and journals   Secondary Caution Sources Information
Do more research  Think WHERE you can find your information May even require purchase of information Check with vendors and distributors for features and pricing information
Check the library (books, magazines, journals, or newspapers) Search the internet using key words Create a way to manage information as you gather it Difficult to sort through if it is not organized
Suggestion - place different pieces of information on note cards (with the source on that card) By separating pieces of information on cards, the information later can be "rearranged" and sorted when you are determining your plan of presentation
Analyse your Information After gathering info, you need to analyze it The purpose of the analysis is to make sense, objectively, out of the information you have gathered Avoid personal bias of any kind entering into the analysis
Information is compared and contrasted in an effort to try to find new ideas or the best ideas Separate facts and figures need to be interpreted by explaining what they mean--what significance they have Once all information is gathered, organised and analysed, you are ready to determine solutions
Determine the Solution Based on your analysis, you will be ready to offer a solution/s to the problem Caution:  The gathered information should be the basis for making this decision A tendency in business report writing is to "slant" information in the report to lead the reader to the decision that  you  may prefer, which  amounts to a bias
Include  all  pertinent information – good and bad. The credibility of the report (and yours as well) is at stake Make sure, however, that a solution is even requested in the first place .  A solution may NOT be requested in the report. Your purpose would then be to present facts objectively.  These facts would be used by someone else to determine the best solution
Organise your Report Before actually writing, organize your information into an outline form Formulate an outline by choosing the major & supporting ideas, developing details, and eliminating unnecessary ideas you've gathered. This outline becomes the basic "structure" of your report A report could be presented as a memo report, a standardized form report, or a formal report
Your report will have following  five  steps: Provide identifying information Define the project or problem (purpose of the report) Give the background Give the supporting data
State your conclusions and recommendations Create a "skeleton" outline –  Jot down these five steps and fill in the info from your gathered material that would fall into each category Based on the outline you can NOW begin the actual writing of your report
Write a rough draft Don’t proof-read or edit at this point. Just get your thoughts done Be systematic if you can--starting at the beginning and work your way through However, if you can find no logical approach, start anywhere - BUT START
Write the opening paragraph/s or page/s at a later time Remember, don't think about editing when writing the first draft Editing proves a stumbling block in creativity for many writers Write first. Then come back and edit Otherwise, you are working against the creative process
Use headings for each of section of your report Headings & sub-headings are used as organizational tools in writing to identify major parts of a report They serve as guideposts for a reader, dividing the information into segments that make it easy for a reader to understand
Structuring the Report Following aspects need particular attention : Outlining and report organisation Length of the Report Formal Report Sequence of presentation Annexures Sub-Committee Report Dissenting Notes, if any
Suggested Format Table of Contents Executive Summary Background of the study Scope and objectives of the study Composition of the committee Study Methodology Findings & observations Recommendations Acknowledgements Annexures
Writing Style - Dos Use an Impersonal Style Use Active Sentences Use Appropriate Headings Use Proper tenses  Use Accurate nouns & pronouns Define all concepts Tabulate all Data Proper Documentation Maintain Objectivity Reflect your Erudition (knowledge acquired by study, research)
Writing Style – Don’ts  Avoid Excessive Jargon Avoid Verbosity & Involved Writing Avoid Personal Bias Avoid Factual Inaccuracies Avoid Grammatical Blunders Avoid Absence of Reasoning Avoid Absence of Sequencing & References
Graphics in Business Reports Consider including pictures or graphics in the report Why use graphics ? What types of graphics could I use ?  How do I relate the graphic to the written text
Why use graphics ? Not mandatory However,  your goal in a business report is to convey information  clearly  to the reader A graphic can  often be clearer than text
A graphic does the following: Presents message in an economical manner using less space than would be needed to provide the same information in the text Saves your reader’s time Focuses the reader’s attention on specific information
Adds interest Shows relationships Presents facts and figures in a condensed manner
What types of graphics could you use ? Depends upon type of information you want to present Example, to show sales broken down by categories, a pie chart will be effective
To show sales trend for the past six months, a line or bar graphic would be more effective Some of the more common graphics that you might want to consider would include: Tables / Pie Charts / Line Charts / Bar Charts /  Organisational Charts / Others (pictograms, maps, photographs, time lines, flow charts, etc)
How do I relate the graphics to the written text? Remember- graphics are PART of the report, not a supplement Work the graphic into the flow of your text Place graphic within the text, immediately after the paragraph in which the graphic is first mentioned
Refer to each graphic by its figure number Interpret the information found in the graphic within the text material Textual material should not merely repeat what can be seen in the graph or table
Questions ? T H A N K Y O U

Basics of Report Writing

  • 1.
    Basics of Report Writing A Presentation by Rajiv Bajaj
  • 2.
    Learning Objectives To understand: 1. Purpose of Reports 2. Steps in Writing a Report 3. Elements of Effective Reports 4. Use of Graphics in a Report
  • 3.
    Defining Reports ABusiness Report is an orderly & objective communication of factual information that serves a business purpose The keywords are Orderly, Objective, Communication, Factual Information & Serves A Business Purpose Reports are vital to larger organisations – you will probably write them
  • 4.
    Types of BusinessReports Routine Reports : Monthly Report, Performance Report, Review Report, Sales Report, Press Report Research Reports, Survey Reports & Special Reports Enquiry Reports & Investigation Reports Confidential Reports
  • 5.
    Information Reports &Analytical Reports Technical Reports Directors’ Report Annual Reports Committee Reports
  • 6.
    Purpose of aReport To have a clear understanding of why a report is written, a written purpose sentence is essential This purpose sentence could be written as either a statement or a question
  • 7.
    Examples To determineways to improve employee morale. (statement) To design a new procedure for the company’s annual inventory. (statement) Should new computers be purchased to replaced the older models? (question) Should the office arrangement be open or modular? (question)
  • 8.
    Steps in ReportWriting 1. Determine the Scope of the Report 2. Consider Your Audience 3. Gather Your Information 4. Analyze Your Information 5. Determine the Solution 6. Organize Your Report
  • 9.
    Determining the Report’sScope Common fault of many reports - Making the scope of a report too general or too vague After choosing a subject, one of the first steps is to narrow the scope to a report length Scope is defined by determining the factors you will study Limit amount of information to the most needed and most important factors
  • 10.
    Example - Factorsto be studied to determine ways to improve employee morale might include: Salaries / Fringe benefits / Work assignments / Work hours / Evaluation procedures There could be many other factors. Some may be important, and you may want to consider them later
  • 11.
    For any onereport, however, a reasonable scope must be clearly defined by determining what factors will be included
  • 12.
    Consider the AudienceUnlike letters / memos, reports usually have a far wider distribution Many people involved in a decision-making process may have a need to read the info in the report Make it easy for the reader. To make reading your report easier, think in terms of the reader
  • 13.
    Each audience hasunique needs. Audience considerations include: Need (from your report) Education level Position in the organization Knowledge of your topic or area Responsibility to act Age Biases Preferences Attitudes
  • 14.
    Some false assumptions regarding audiences: 1. That the person who will first read or edit the report is the audience 2. Audience is a group of specialists in their field 3. Audience is familiar with the subject of the report 4. Audience has time to read the entire report
  • 15.
    5. Audience hasa strong interest in the subject of the report 6. Author will always be available to discuss the report Avoid false assumptions . Identify everyone who might read the report; Characterize readers according to professional training, position, personal traits - Determine how & when reader might use the report
  • 16.
    Kinds of audiences- Primary - People who have to act or make decisions on the basis of the report Secondary - People affected by whatever actions primary audiences would take in response to the report Immediate - People responsible for evaluating the report and getting it to the right people
  • 17.
    Additional questions to consider regarding your audience are: How much background will they need ? Do you need to define any terms you are using? What language level will be most appropriate for your readers ?
  • 18.
    How many andwhat kind of visual aids should you use ? What will they expect from your report ? Do they prefer finer details or merely a brief presentation that touches upon the highlights ?
  • 19.
    Gather Your InformationInformation you gather can be of two types - Secondary and Primary Secondary is information gathered and recorded by others Primary is information you gather and record yourself
  • 20.
    Information must begathered carefully to ensure it is accurate and bias free Questionnaires, surveys, observation, experiments, historical information, and raw data Primary Information may be inaccurate, out of date, or biased Books, internet, reports, newspapers, magazines, pamphlets, and journals Secondary Caution Sources Information
  • 21.
    Do more research Think WHERE you can find your information May even require purchase of information Check with vendors and distributors for features and pricing information
  • 22.
    Check the library(books, magazines, journals, or newspapers) Search the internet using key words Create a way to manage information as you gather it Difficult to sort through if it is not organized
  • 23.
    Suggestion - placedifferent pieces of information on note cards (with the source on that card) By separating pieces of information on cards, the information later can be "rearranged" and sorted when you are determining your plan of presentation
  • 24.
    Analyse your InformationAfter gathering info, you need to analyze it The purpose of the analysis is to make sense, objectively, out of the information you have gathered Avoid personal bias of any kind entering into the analysis
  • 25.
    Information is comparedand contrasted in an effort to try to find new ideas or the best ideas Separate facts and figures need to be interpreted by explaining what they mean--what significance they have Once all information is gathered, organised and analysed, you are ready to determine solutions
  • 26.
    Determine the SolutionBased on your analysis, you will be ready to offer a solution/s to the problem Caution: The gathered information should be the basis for making this decision A tendency in business report writing is to "slant" information in the report to lead the reader to the decision that you may prefer, which amounts to a bias
  • 27.
    Include all pertinent information – good and bad. The credibility of the report (and yours as well) is at stake Make sure, however, that a solution is even requested in the first place . A solution may NOT be requested in the report. Your purpose would then be to present facts objectively. These facts would be used by someone else to determine the best solution
  • 28.
    Organise your ReportBefore actually writing, organize your information into an outline form Formulate an outline by choosing the major & supporting ideas, developing details, and eliminating unnecessary ideas you've gathered. This outline becomes the basic "structure" of your report A report could be presented as a memo report, a standardized form report, or a formal report
  • 29.
    Your report willhave following five steps: Provide identifying information Define the project or problem (purpose of the report) Give the background Give the supporting data
  • 30.
    State your conclusionsand recommendations Create a "skeleton" outline – Jot down these five steps and fill in the info from your gathered material that would fall into each category Based on the outline you can NOW begin the actual writing of your report
  • 31.
    Write a roughdraft Don’t proof-read or edit at this point. Just get your thoughts done Be systematic if you can--starting at the beginning and work your way through However, if you can find no logical approach, start anywhere - BUT START
  • 32.
    Write the openingparagraph/s or page/s at a later time Remember, don't think about editing when writing the first draft Editing proves a stumbling block in creativity for many writers Write first. Then come back and edit Otherwise, you are working against the creative process
  • 33.
    Use headings foreach of section of your report Headings & sub-headings are used as organizational tools in writing to identify major parts of a report They serve as guideposts for a reader, dividing the information into segments that make it easy for a reader to understand
  • 34.
    Structuring the ReportFollowing aspects need particular attention : Outlining and report organisation Length of the Report Formal Report Sequence of presentation Annexures Sub-Committee Report Dissenting Notes, if any
  • 35.
    Suggested Format Tableof Contents Executive Summary Background of the study Scope and objectives of the study Composition of the committee Study Methodology Findings & observations Recommendations Acknowledgements Annexures
  • 36.
    Writing Style -Dos Use an Impersonal Style Use Active Sentences Use Appropriate Headings Use Proper tenses Use Accurate nouns & pronouns Define all concepts Tabulate all Data Proper Documentation Maintain Objectivity Reflect your Erudition (knowledge acquired by study, research)
  • 37.
    Writing Style –Don’ts Avoid Excessive Jargon Avoid Verbosity & Involved Writing Avoid Personal Bias Avoid Factual Inaccuracies Avoid Grammatical Blunders Avoid Absence of Reasoning Avoid Absence of Sequencing & References
  • 38.
    Graphics in BusinessReports Consider including pictures or graphics in the report Why use graphics ? What types of graphics could I use ? How do I relate the graphic to the written text
  • 39.
    Why use graphics? Not mandatory However, your goal in a business report is to convey information clearly to the reader A graphic can often be clearer than text
  • 40.
    A graphic doesthe following: Presents message in an economical manner using less space than would be needed to provide the same information in the text Saves your reader’s time Focuses the reader’s attention on specific information
  • 41.
    Adds interest Showsrelationships Presents facts and figures in a condensed manner
  • 42.
    What types ofgraphics could you use ? Depends upon type of information you want to present Example, to show sales broken down by categories, a pie chart will be effective
  • 43.
    To show salestrend for the past six months, a line or bar graphic would be more effective Some of the more common graphics that you might want to consider would include: Tables / Pie Charts / Line Charts / Bar Charts / Organisational Charts / Others (pictograms, maps, photographs, time lines, flow charts, etc)
  • 44.
    How do Irelate the graphics to the written text? Remember- graphics are PART of the report, not a supplement Work the graphic into the flow of your text Place graphic within the text, immediately after the paragraph in which the graphic is first mentioned
  • 45.
    Refer to eachgraphic by its figure number Interpret the information found in the graphic within the text material Textual material should not merely repeat what can be seen in the graph or table
  • 46.
    Questions ? TH A N K Y O U