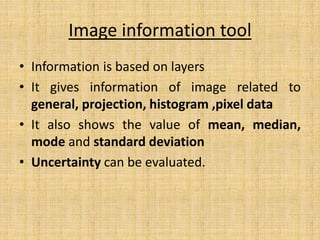
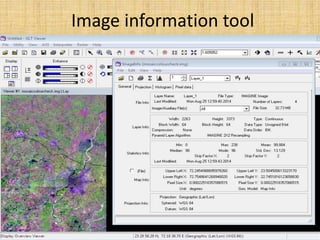
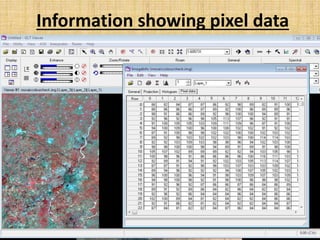
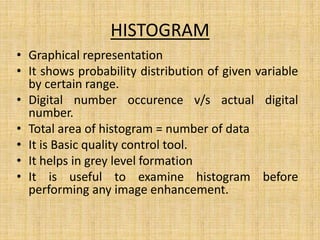
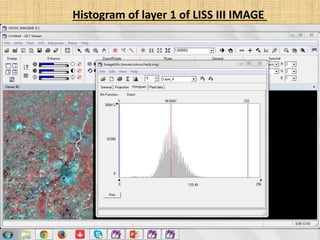
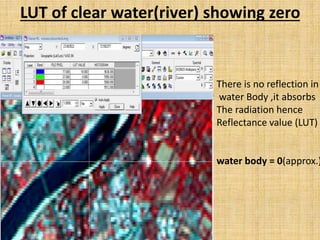
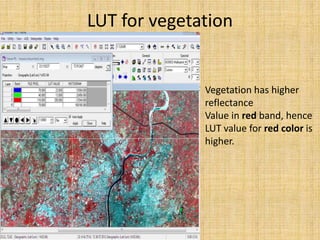
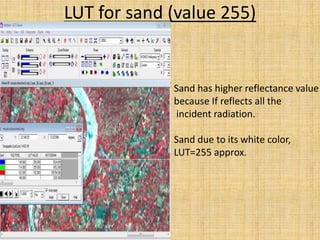
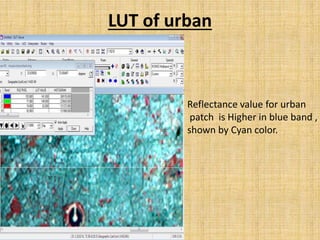
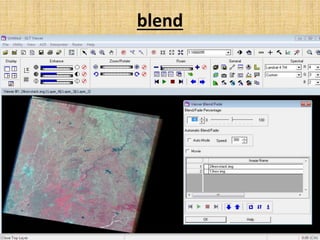
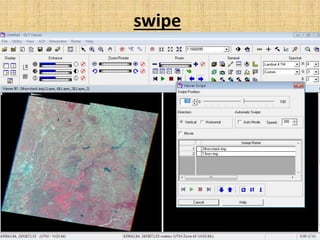
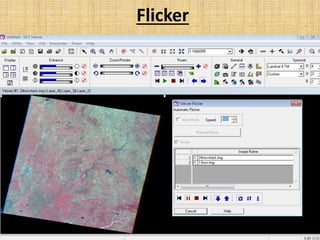
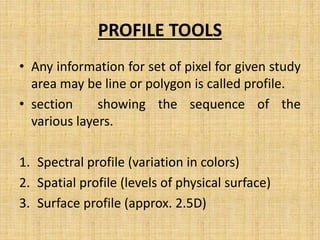
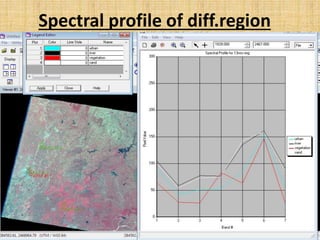
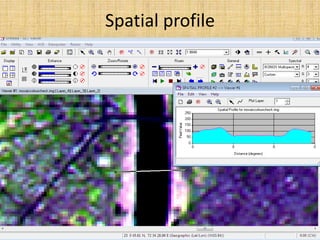
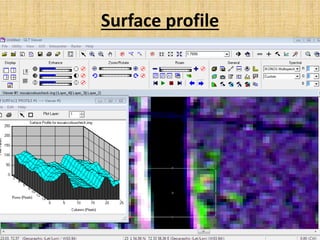
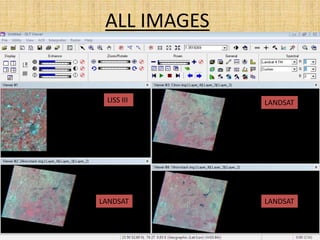
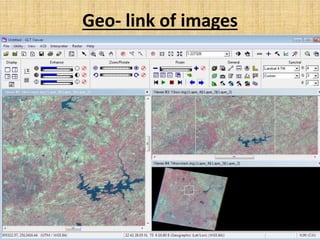
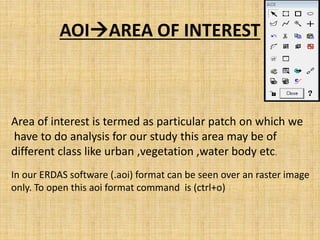
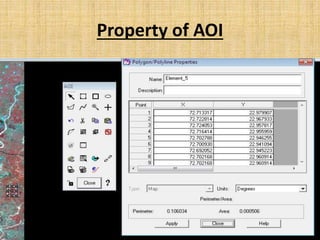
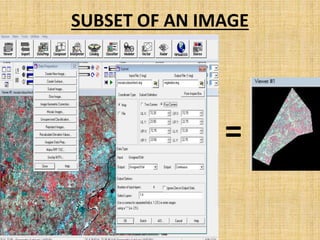
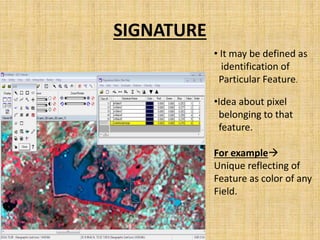
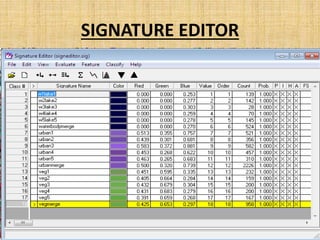
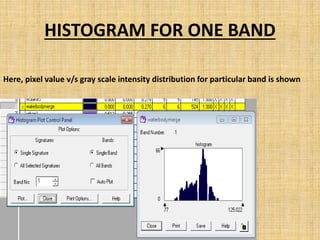
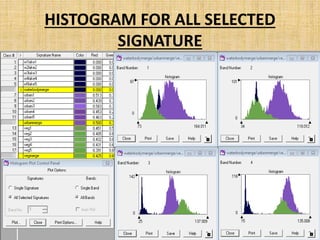
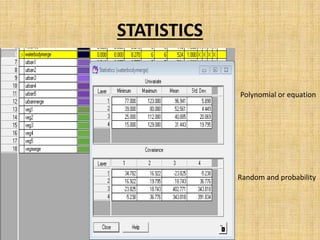
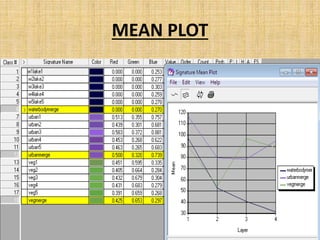
ASSIGNMENT
on REMOTE SENSING
EXPLAINING TOOLS BY PERFORMING TASK ON
DIFFERENT IMAGES
SUBMITTED TO SUBMITTED BY
Prof.BINDI MAM MAYANK SINGH SAKLA
In ERDAS IMAGINE SOFTWARE 
Image information tool
• Information is based on layers
• It gives information of image related to
general, projection, histogram ,pixel data
• It also shows the value of mean, median,
mode and standard deviation
• Uncertainty can be evaluated.
Image information tool
Information showing pixel data
HISTOGRAM
• Graphical representation
• It shows probability distribution of given variable
by certain range.
• Digital number occurence v/s actual digital
number.
• Total area of histogram = number of data
• It is Basic quality control tool.
• It helps in grey level formation
• It is useful to examine histogram before
performing any image enhancement.
Histogram of layer 1 of LISS III IMAGE
DESCRIPTION OF HISTOGRAM
• Histogram always starts with zero as a initial
on gray scale (0-255), because of the reason
that many times pixels are missing ,some time
no data body may be present like pure water
• By moving cursor on histogram mean,median
and mode can be obtained for any perticular
layer.
Significance of histogram
• For example like 
1. Useful in thematic map
2. If any field (crop) for any area is given than by
taking customers expectation study can be
generated.
Inquire cursor
• It is used to get PIXEL INFORMATION
• it shows look up table (LUT)
LUT LOOK UP TABLE
• It shows reflectance value
• Every color has its own reflectance value
• Black color = zero approx. LUT value for
example clear water body
• White color = 255 approx. LUT value for
example sand
• LUT compares with tabulated data.
Significance of LUT
For example 
1. in study of water inherent property which may
be optical like to calculate shallow depth or
bottom depth as per according to reflection.
2. If is helpful in knowing turbidity of water with
respect to preowned tabulated data.
3. According to LUT, density of urban (or any area)
can be calculated.
4. Height or elevation of any structure can be
obtained.
LUT of clear water(river) showing zero
There is no reflection in
water Body ,it absorbs
The radiation hence
Reflectance value (LUT)
water body = 0(approx.)
LUT for vegetation
Vegetation has higher
reflectance
Value in red band, hence
LUT value for red color is
higher.
LUT for sand (value 255)
Sand has higher reflectance value
because If reflects all the
incident radiation.
Sand due to its white color,
LUT=255 approx.
LUT of urban
Reflectance value for urban
patch is Higher in blue band ,
shown by Cyan color.
Utility tool
• Spatio-temporal analysis visually
1. Blend
2. Swipe
3. Flicker
(they shows visual effects tools)
blend
swipe
Flicker
PROFILE TOOLS
• Any information for set of pixel for given study
area may be line or polygon is called profile.
• section showing the sequence of the
various layers.
1. Spectral profile (variation in colors)
2. Spatial profile (levels of physical surface)
3. Surface profile (approx. 2.5D)
Spectral profile of diff.region
Spatial profile
Surface profile
ALL IMAGES
LISS III LANDSAT
LANDSATLANDSAT
Geo- link of images
AOIAREA OF INTEREST
Area of interest is termed as particular patch on which we
have to do analysis for our study this area may be of
different class like urban ,vegetation ,water body etc.
In our ERDAS software (.aoi) format can be seen over an raster image
only. To open this aoi format command is (ctrl+o)
Property of AOI
SUBSET
• A part of image for a selected identity or field.
• The significance of making subset is used to
make thematic map. This may be polygon or
rectangle or ellipse.
• This subset can be made for particular layer
also.
SUBSET OF AN IMAGE
=
SIGNATURE
• It may be defined as
identification of
Particular Feature.
•Idea about pixel
belonging to that
feature.
For example
Unique reflecting of
Feature as color of any
Field.
SIGNATURE EDITOR
HISTOGRAM FOR ONE BAND
Here, pixel value v/s gray scale intensity distribution for particular band is shown
HISTOGRAM FOR ALL SELECTED
SIGNATURE
STATISTICS
Random and probability
Polynomial or equation
MEAN PLOT
Thank you

REMOTE SENSING ANALYSIS

  • 1.
    ASSIGNMENT on REMOTE SENSING EXPLAININGTOOLS BY PERFORMING TASK ON DIFFERENT IMAGES SUBMITTED TO SUBMITTED BY Prof.BINDI MAM MAYANK SINGH SAKLA In ERDAS IMAGINE SOFTWARE 
  • 2.
    Image information tool •Information is based on layers • It gives information of image related to general, projection, histogram ,pixel data • It also shows the value of mean, median, mode and standard deviation • Uncertainty can be evaluated.
  • 3.
  • 4.
  • 5.
    HISTOGRAM • Graphical representation •It shows probability distribution of given variable by certain range. • Digital number occurence v/s actual digital number. • Total area of histogram = number of data • It is Basic quality control tool. • It helps in grey level formation • It is useful to examine histogram before performing any image enhancement.
  • 6.
    Histogram of layer1 of LISS III IMAGE
  • 7.
    DESCRIPTION OF HISTOGRAM •Histogram always starts with zero as a initial on gray scale (0-255), because of the reason that many times pixels are missing ,some time no data body may be present like pure water • By moving cursor on histogram mean,median and mode can be obtained for any perticular layer.
  • 8.
    Significance of histogram •For example like  1. Useful in thematic map 2. If any field (crop) for any area is given than by taking customers expectation study can be generated.
  • 9.
    Inquire cursor • Itis used to get PIXEL INFORMATION • it shows look up table (LUT)
  • 10.
    LUT LOOK UPTABLE • It shows reflectance value • Every color has its own reflectance value • Black color = zero approx. LUT value for example clear water body • White color = 255 approx. LUT value for example sand • LUT compares with tabulated data.
  • 11.
    Significance of LUT Forexample  1. in study of water inherent property which may be optical like to calculate shallow depth or bottom depth as per according to reflection. 2. If is helpful in knowing turbidity of water with respect to preowned tabulated data. 3. According to LUT, density of urban (or any area) can be calculated. 4. Height or elevation of any structure can be obtained.
  • 12.
    LUT of clearwater(river) showing zero There is no reflection in water Body ,it absorbs The radiation hence Reflectance value (LUT) water body = 0(approx.)
  • 13.
    LUT for vegetation Vegetationhas higher reflectance Value in red band, hence LUT value for red color is higher.
  • 14.
    LUT for sand(value 255) Sand has higher reflectance value because If reflects all the incident radiation. Sand due to its white color, LUT=255 approx.
  • 15.
    LUT of urban Reflectancevalue for urban patch is Higher in blue band , shown by Cyan color.
  • 16.
    Utility tool • Spatio-temporalanalysis visually 1. Blend 2. Swipe 3. Flicker (they shows visual effects tools)
  • 17.
  • 18.
  • 19.
  • 20.
    PROFILE TOOLS • Anyinformation for set of pixel for given study area may be line or polygon is called profile. • section showing the sequence of the various layers. 1. Spectral profile (variation in colors) 2. Spatial profile (levels of physical surface) 3. Surface profile (approx. 2.5D)
  • 21.
  • 22.
  • 23.
  • 24.
    ALL IMAGES LISS IIILANDSAT LANDSATLANDSAT
  • 25.
  • 26.
    AOIAREA OF INTEREST Areaof interest is termed as particular patch on which we have to do analysis for our study this area may be of different class like urban ,vegetation ,water body etc. In our ERDAS software (.aoi) format can be seen over an raster image only. To open this aoi format command is (ctrl+o)
  • 27.
  • 28.
    SUBSET • A partof image for a selected identity or field. • The significance of making subset is used to make thematic map. This may be polygon or rectangle or ellipse. • This subset can be made for particular layer also.
  • 29.
    SUBSET OF ANIMAGE =
  • 30.
    SIGNATURE • It maybe defined as identification of Particular Feature. •Idea about pixel belonging to that feature. For example Unique reflecting of Feature as color of any Field.
  • 31.
  • 32.
    HISTOGRAM FOR ONEBAND Here, pixel value v/s gray scale intensity distribution for particular band is shown
  • 33.
    HISTOGRAM FOR ALLSELECTED SIGNATURE
  • 34.
  • 35.
  • 36.