Download to read offline

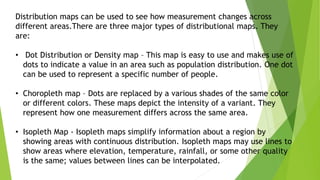
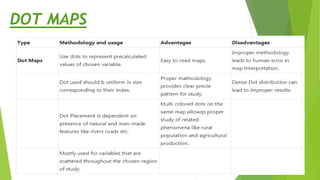
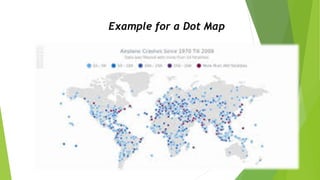
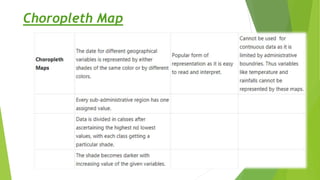

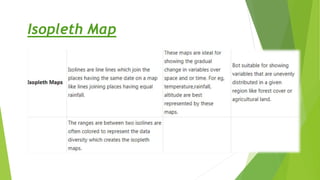
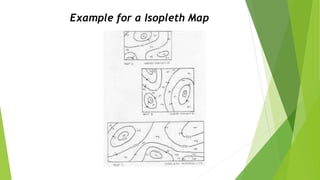
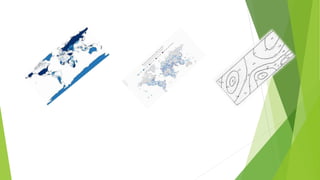

Distribution maps can show how measurements vary across areas using three main types: dot maps represent values like population with dots, choropleth maps use color shades to depict variations of a measurement across a uniform area, and isopleth maps simplify continuous distributions with lines connecting equal values allowing interpolation between them.