Download as PDF, PPTX
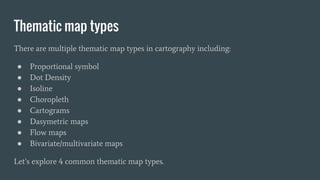
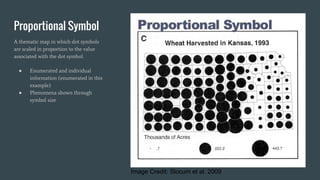
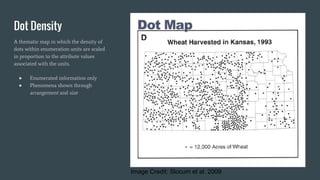
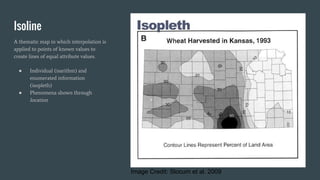
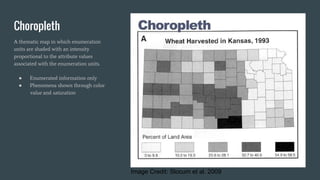


This document discusses thematic mapping and provides an overview of four common thematic map types: proportional symbol maps, dot density maps, isoline maps, and choropleth maps. It explains what thematic maps are, the different types of information they can show, and considerations for making choropleth maps such as using appropriate enumeration units, normalizing data, classifying data, choosing color schemes, and using the proper map projections. The document concludes by explaining how to make a choropleth map using the Carto online mapping tool.


