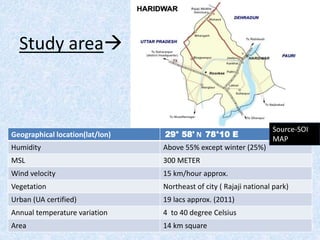
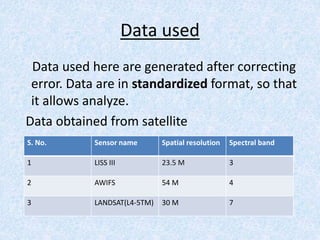
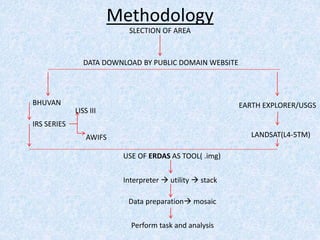
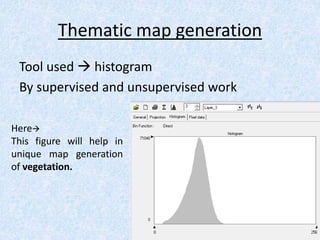
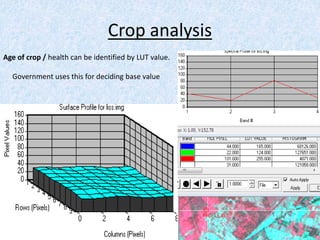
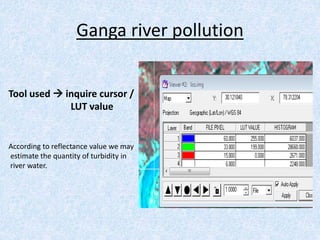
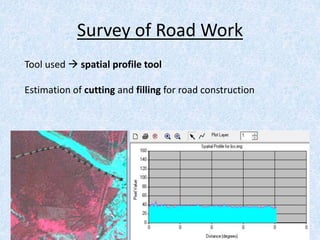
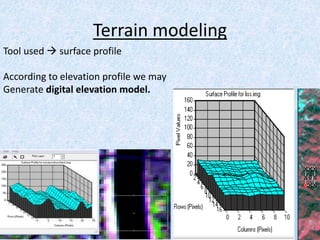
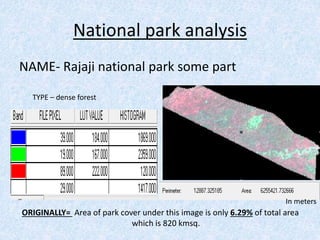
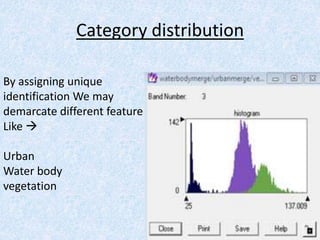
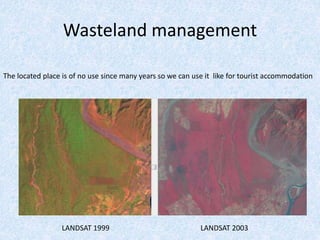
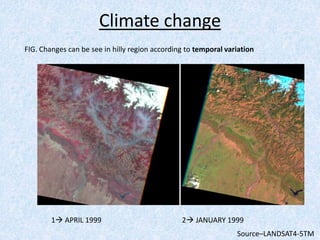
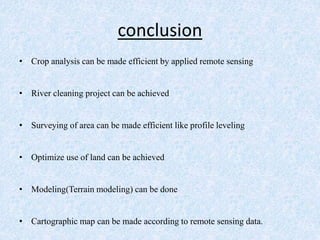
Analysis of satellite
imagery
Based on remote sensing
Submitted to-
Bindi mam
Submitted by –
Mayank singh sakla
Introduction
Remote sensing is method which is used to get
information about any object without coming
in contact with it. data analysis is done by 2
methods 1.visual interpretation
2.Digital techniques
we are using Erdas imagine as a tool to
analysis images.
Objective
The object of this report is data analysis of remotely
sensed images and understanding End utilisation
process. The aim consists of following study –
Analysis of urban feature
Analysis of water body
Analysis of man-made feature
Analysis of vegetation (crop) or land feature
Geographical location(lat/lon) 29° 58' N 78°10 E
Humidity Above 55% except winter (25%)
MSL 300 METER
Wind velocity 15 km/hour approx.
Vegetation Northeast of city ( Rajaji national park)
Urban (UA certified) 19 lacs approx. (2011)
Annual temperature variation 4 to 40 degree Celsius
Area 14 km square
Study area
Source-SOI
MAP map
Data used
Data used here are generated after correcting
error. Data are in standardized format, so that
it allows analyze.
Data obtained from satellite
S. No. Sensor name Spatial resolution Spectral band
1 LISS III 23.5 M 3
2 AWIFS 54 M 4
3 LANDSAT(L4-5TM) 30 M 7
Methodology
SLECTION OF AREA
DATA DOWNLOAD BY PUBLIC DOMAIN WEBSITE
BHUVAN EARTH EXPLORER/USGS
IRS SERIES
LISS III
AWIFS LANDSAT(L4-5TM)
USE OF ERDAS AS TOOL( .img)
Interpreter  utility  stack
Data preparation mosaic
Perform task and analysis
Thematic map generation
Tool used  histogram
By supervised and unsupervised work
Here
This figure will help in
unique map generation
of vegetation.
Crop analysis
Age of crop / health can be identified by LUT value.
Government uses this for deciding base value
• Age of crop can be identified by look up table
value it is fully based on reflectance amount
by leave of crop .
• Area under histogram of this area can be used
to estimate quantity of crop.
• In digital technique Band 3 (LISS III) is very
useful in vegetation study.
• Calibrated scale is use by client to measure
quantity .
• calculation of ratio vegetation index (RVI)
Continuation…..
• Normalized different vegetation index (NDVI)
calculation. It is high in NIR than red band.
Rain fall 1054 mm annual
Soil type sandy
Sown area 118.4 ha
Kharif crop rice
Rabi crop wheat
Source:- agricoop.nic.in
Ganga river pollution
Tool used  inquire cursor /
LUT value
According to reflectance value we may
estimate the quantity of turbidity in
river water.
Survey of Road Work
Tool used  spatial profile tool
Estimation of cutting and filling for road construction
Terrain modeling
Tool used  surface profile
According to elevation profile we may
Generate digital elevation model.
National park analysis
NAME- Rajaji national park some part
In meters
TYPE – dense forest
ORIGINALLY= Area of park cover under this image is only 6.29% of total area
which is 820 kmsq.
Category distribution
By assigning unique
identification We may
demarcate different feature
Like 
Urban
Water body
vegetation
Wasteland management
LANDSAT 1999 LANDSAT 2003
The located place is of no use since many years so we can use it like for tourist accommodation
Climate change
Source–LANDSAT4-5TM
1 APRIL 1999 2 JANUARY 1999
FIG. Changes can be see in hilly region according to temporal variation
conclusion
• Crop analysis can be made efficient by applied remote sensing
• River cleaning project can be achieved
• Surveying of area can be made efficient like profile leveling
• Optimize use of land can be achieved
• Modeling(Terrain modeling) can be done
• Cartographic map can be made according to remote sensing data.
Reference
Website
www.crisp.nus.edu.sg/research/tutorial/opt.tn
www.Agricoop.nic.in
www.Whatwhenhow.com/remotsensing/from/a
ir.com
BOOK
TITLE-Fundamental of remote sensing by George
Joseph
Thank you..

remote sensong analysis

  • 1.
    Analysis of satellite imagery Basedon remote sensing Submitted to- Bindi mam Submitted by – Mayank singh sakla
  • 2.
    Introduction Remote sensing ismethod which is used to get information about any object without coming in contact with it. data analysis is done by 2 methods 1.visual interpretation 2.Digital techniques we are using Erdas imagine as a tool to analysis images.
  • 3.
    Objective The object ofthis report is data analysis of remotely sensed images and understanding End utilisation process. The aim consists of following study – Analysis of urban feature Analysis of water body Analysis of man-made feature Analysis of vegetation (crop) or land feature
  • 4.
    Geographical location(lat/lon) 29°58' N 78°10 E Humidity Above 55% except winter (25%) MSL 300 METER Wind velocity 15 km/hour approx. Vegetation Northeast of city ( Rajaji national park) Urban (UA certified) 19 lacs approx. (2011) Annual temperature variation 4 to 40 degree Celsius Area 14 km square Study area Source-SOI MAP map
  • 5.
    Data used Data usedhere are generated after correcting error. Data are in standardized format, so that it allows analyze. Data obtained from satellite S. No. Sensor name Spatial resolution Spectral band 1 LISS III 23.5 M 3 2 AWIFS 54 M 4 3 LANDSAT(L4-5TM) 30 M 7
  • 6.
    Methodology SLECTION OF AREA DATADOWNLOAD BY PUBLIC DOMAIN WEBSITE BHUVAN EARTH EXPLORER/USGS IRS SERIES LISS III AWIFS LANDSAT(L4-5TM) USE OF ERDAS AS TOOL( .img) Interpreter  utility  stack Data preparation mosaic Perform task and analysis
  • 7.
    Thematic map generation Toolused  histogram By supervised and unsupervised work Here This figure will help in unique map generation of vegetation.
  • 8.
    Crop analysis Age ofcrop / health can be identified by LUT value. Government uses this for deciding base value
  • 9.
    • Age ofcrop can be identified by look up table value it is fully based on reflectance amount by leave of crop . • Area under histogram of this area can be used to estimate quantity of crop. • In digital technique Band 3 (LISS III) is very useful in vegetation study. • Calibrated scale is use by client to measure quantity . • calculation of ratio vegetation index (RVI)
  • 10.
    Continuation….. • Normalized differentvegetation index (NDVI) calculation. It is high in NIR than red band. Rain fall 1054 mm annual Soil type sandy Sown area 118.4 ha Kharif crop rice Rabi crop wheat Source:- agricoop.nic.in
  • 11.
    Ganga river pollution Toolused  inquire cursor / LUT value According to reflectance value we may estimate the quantity of turbidity in river water.
  • 12.
    Survey of RoadWork Tool used  spatial profile tool Estimation of cutting and filling for road construction
  • 13.
    Terrain modeling Tool used surface profile According to elevation profile we may Generate digital elevation model.
  • 14.
    National park analysis NAME-Rajaji national park some part In meters TYPE – dense forest ORIGINALLY= Area of park cover under this image is only 6.29% of total area which is 820 kmsq.
  • 15.
    Category distribution By assigningunique identification We may demarcate different feature Like  Urban Water body vegetation
  • 16.
    Wasteland management LANDSAT 1999LANDSAT 2003 The located place is of no use since many years so we can use it like for tourist accommodation
  • 17.
    Climate change Source–LANDSAT4-5TM 1 APRIL1999 2 JANUARY 1999 FIG. Changes can be see in hilly region according to temporal variation
  • 18.
    conclusion • Crop analysiscan be made efficient by applied remote sensing • River cleaning project can be achieved • Surveying of area can be made efficient like profile leveling • Optimize use of land can be achieved • Modeling(Terrain modeling) can be done • Cartographic map can be made according to remote sensing data.
  • 19.
  • 20.