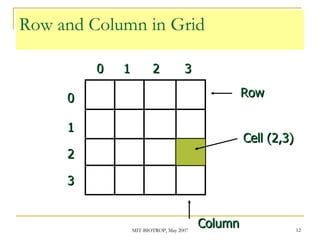
![Grid: cell – row – column Grid themes are matrix organized by cells Cells in row and column Cell and row have one index position Cell on Upper-left : [ 0, 0].](https://image.slidesharecdn.com/3-d-analyst-16326/85/3-D-Analyst-11-320.jpg)
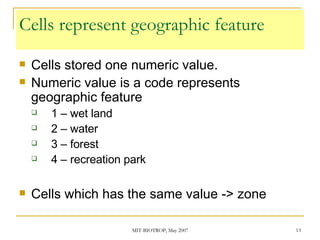
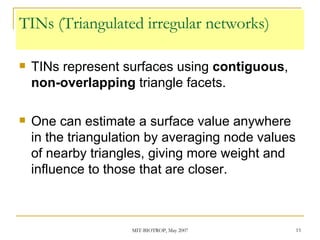
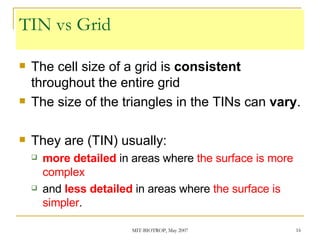
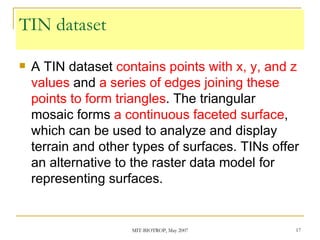
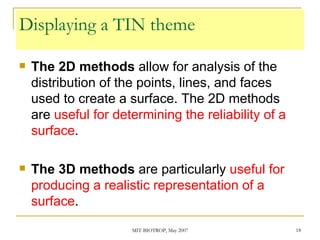


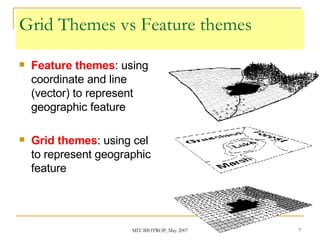
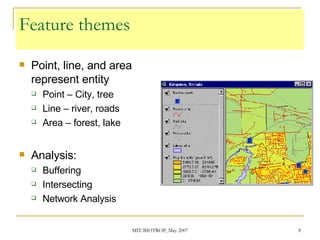
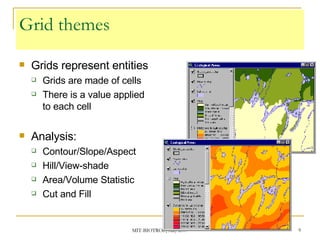
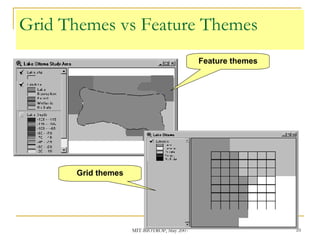
The document discusses the capabilities of ArcView's 3D Analyst extension. It can create and analyze 3D shapes, surfaces, and terrain data. Surface modeling in 3D Analyst uses either grids or triangulated irregular networks (TINs) to represent terrain. Grids partition space into cells storing numeric values, while TINs use triangles connecting points with x, y, z coordinates. 3D Analyst allows visualization and analysis of 3D data including contours, slopes, aspects, areas, volumes, and visibility.