The document explains the concept of regression, starting from its origin with Sir Francis Galton, who identified the relationship between parents' height and their children's height. It discusses linear and curvilinear regression along with the methods to calculate regression lines and correlation coefficients using equations derived from the principle of least squares. Additionally, it provides examples illustrating how to calculate regression lines and make predictions based on given data.
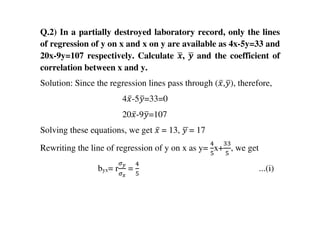
![Q.1) The two regression equations of the variables x and y are
x=19.13-0.87y and y=11.64-0.50x. Find:
i. Mean of x’s,
ii. Mean of y’s,
iii. The correlation coefficient between x and y.
Solution: since the mean of x’s and mean of y’s lie on two
regression lines, we have
ݔഥ=19.13-0.87ݕത ... (i)
ݕത=11.64-0.50 ݔഥ ...(ii)
Multiplying (ii) by 0.87 and subtracting from (i), we have,
[1-(0.87)(0.50)] ̅ݔ=19.13-(11.64)(0.87)](https://image.slidesharecdn.com/regressionanalysis-180517162440/85/Regression-analysis-4-320.jpg)
![Or 0.57̅ݔ=9.00
Or ̅ݔ=15.79
∴ ݕത= 11.64-(0.50)(15.79)=3.74
∴ Regression coefficient of x on y is -0.87 and that of y on x is
-0.50
Now since the coefficient of correlation is the geometric mean
between two regression coefficients.
∴ r=√[(-0.50)(-0.87)] = √(0.43) = -0.66
[-ve sign is taken since both regression coefficients are –ve]](https://image.slidesharecdn.com/regressionanalysis-180517162440/85/Regression-analysis-5-320.jpg)