This document presents a presentation on regression analysis submitted to Dr. Adeel. It includes:
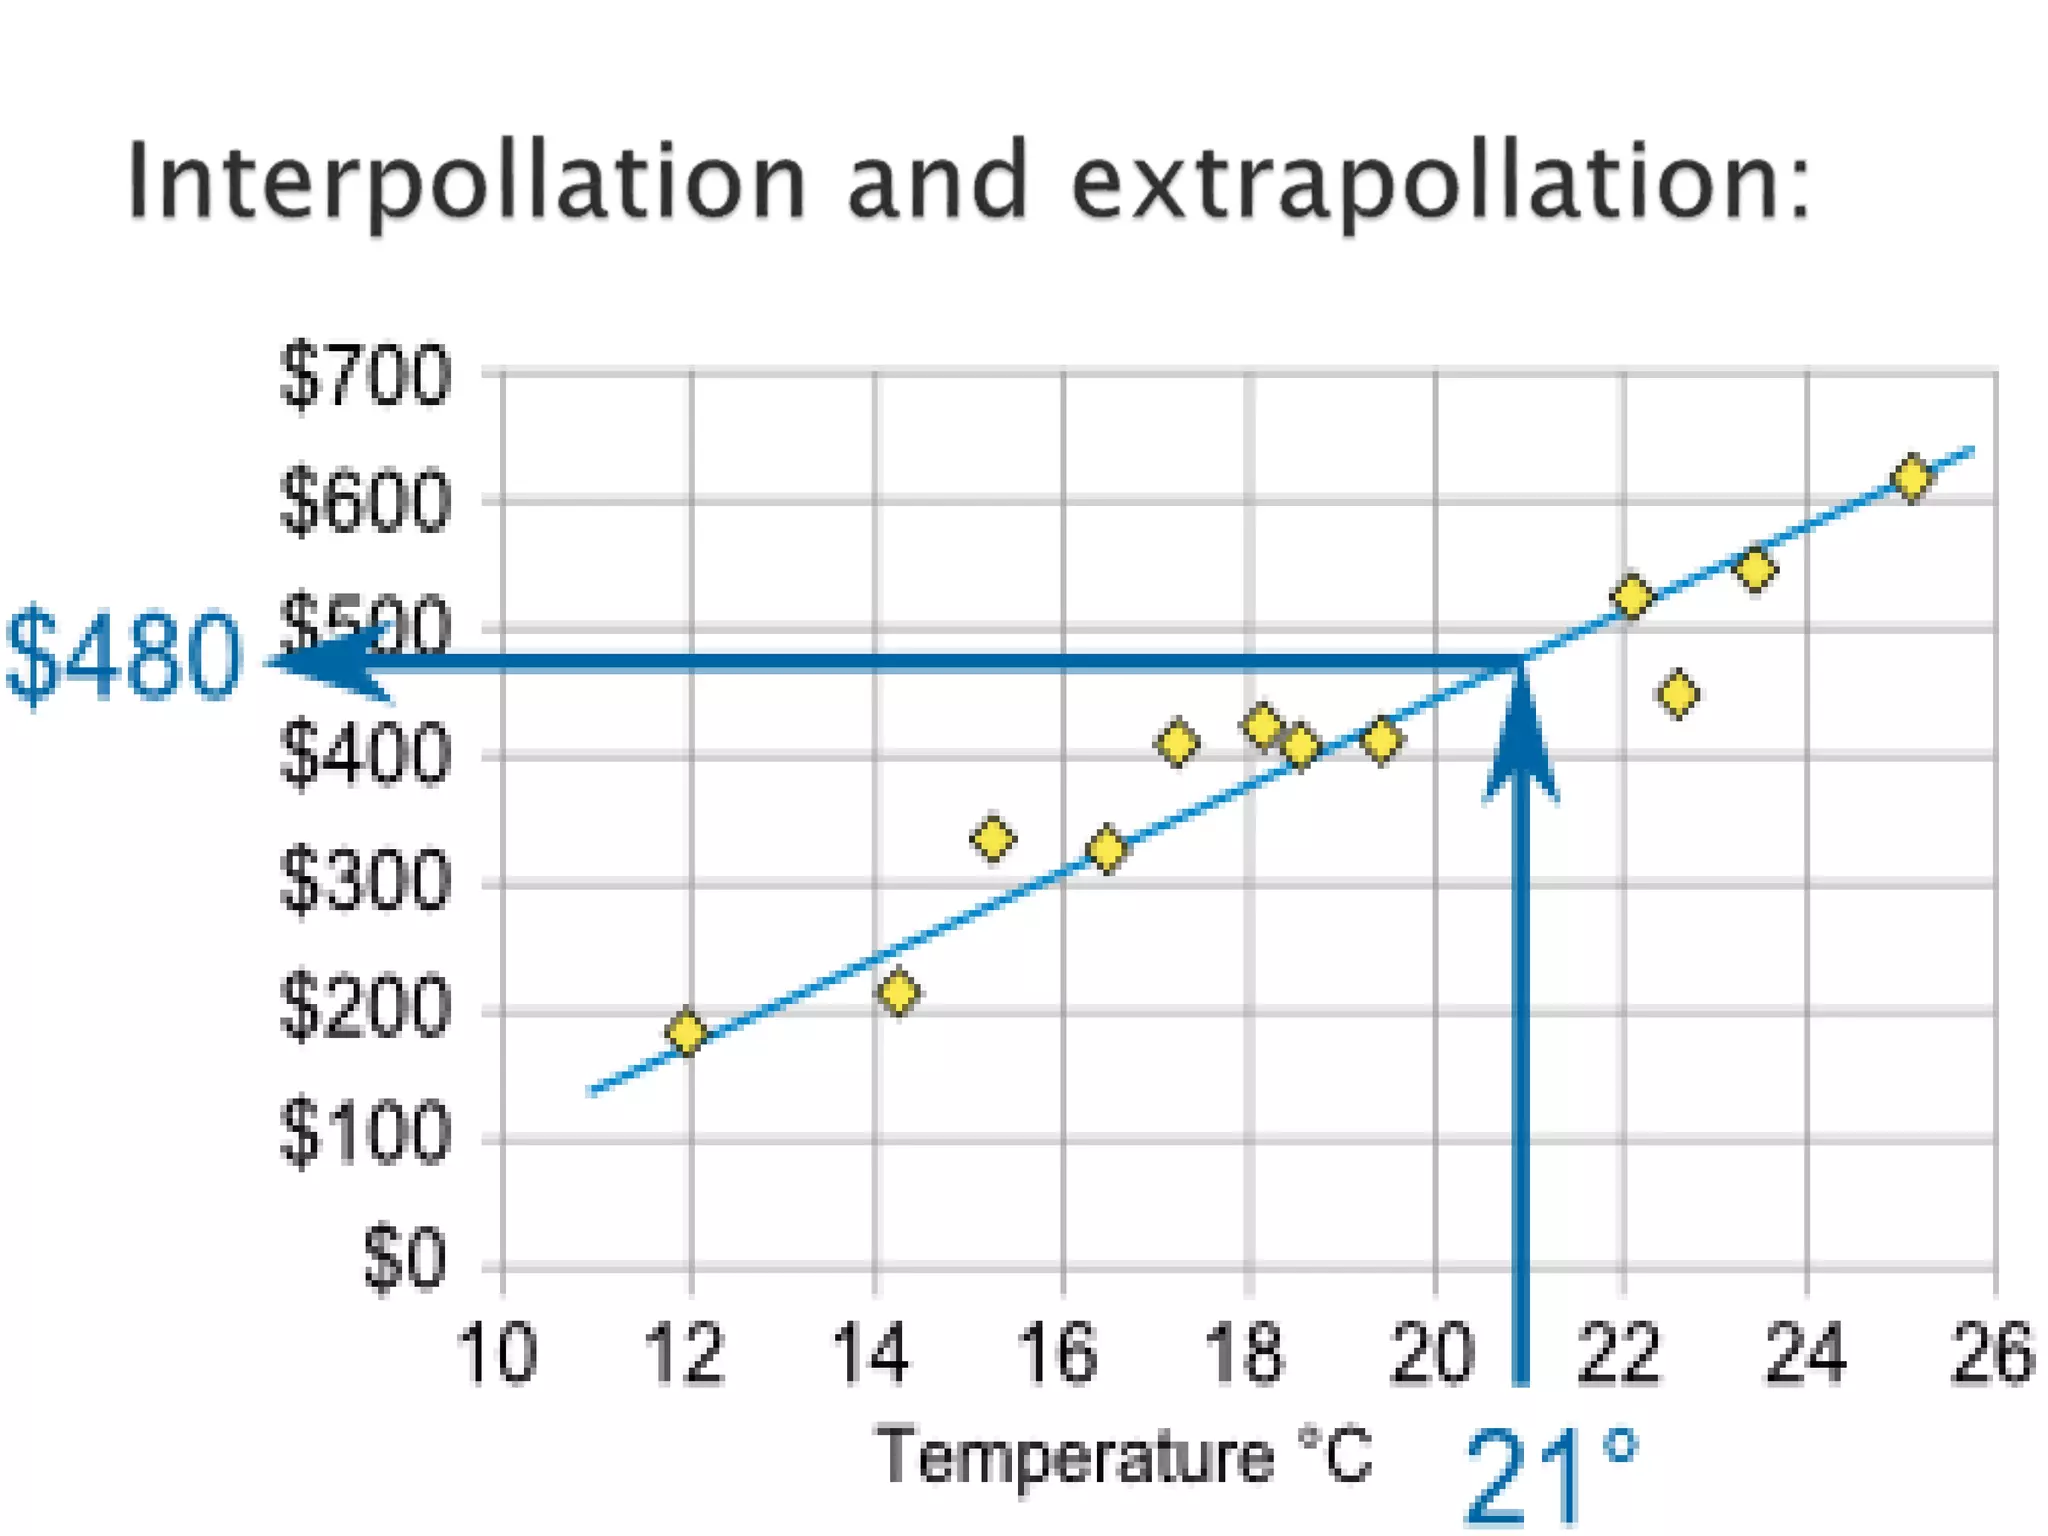
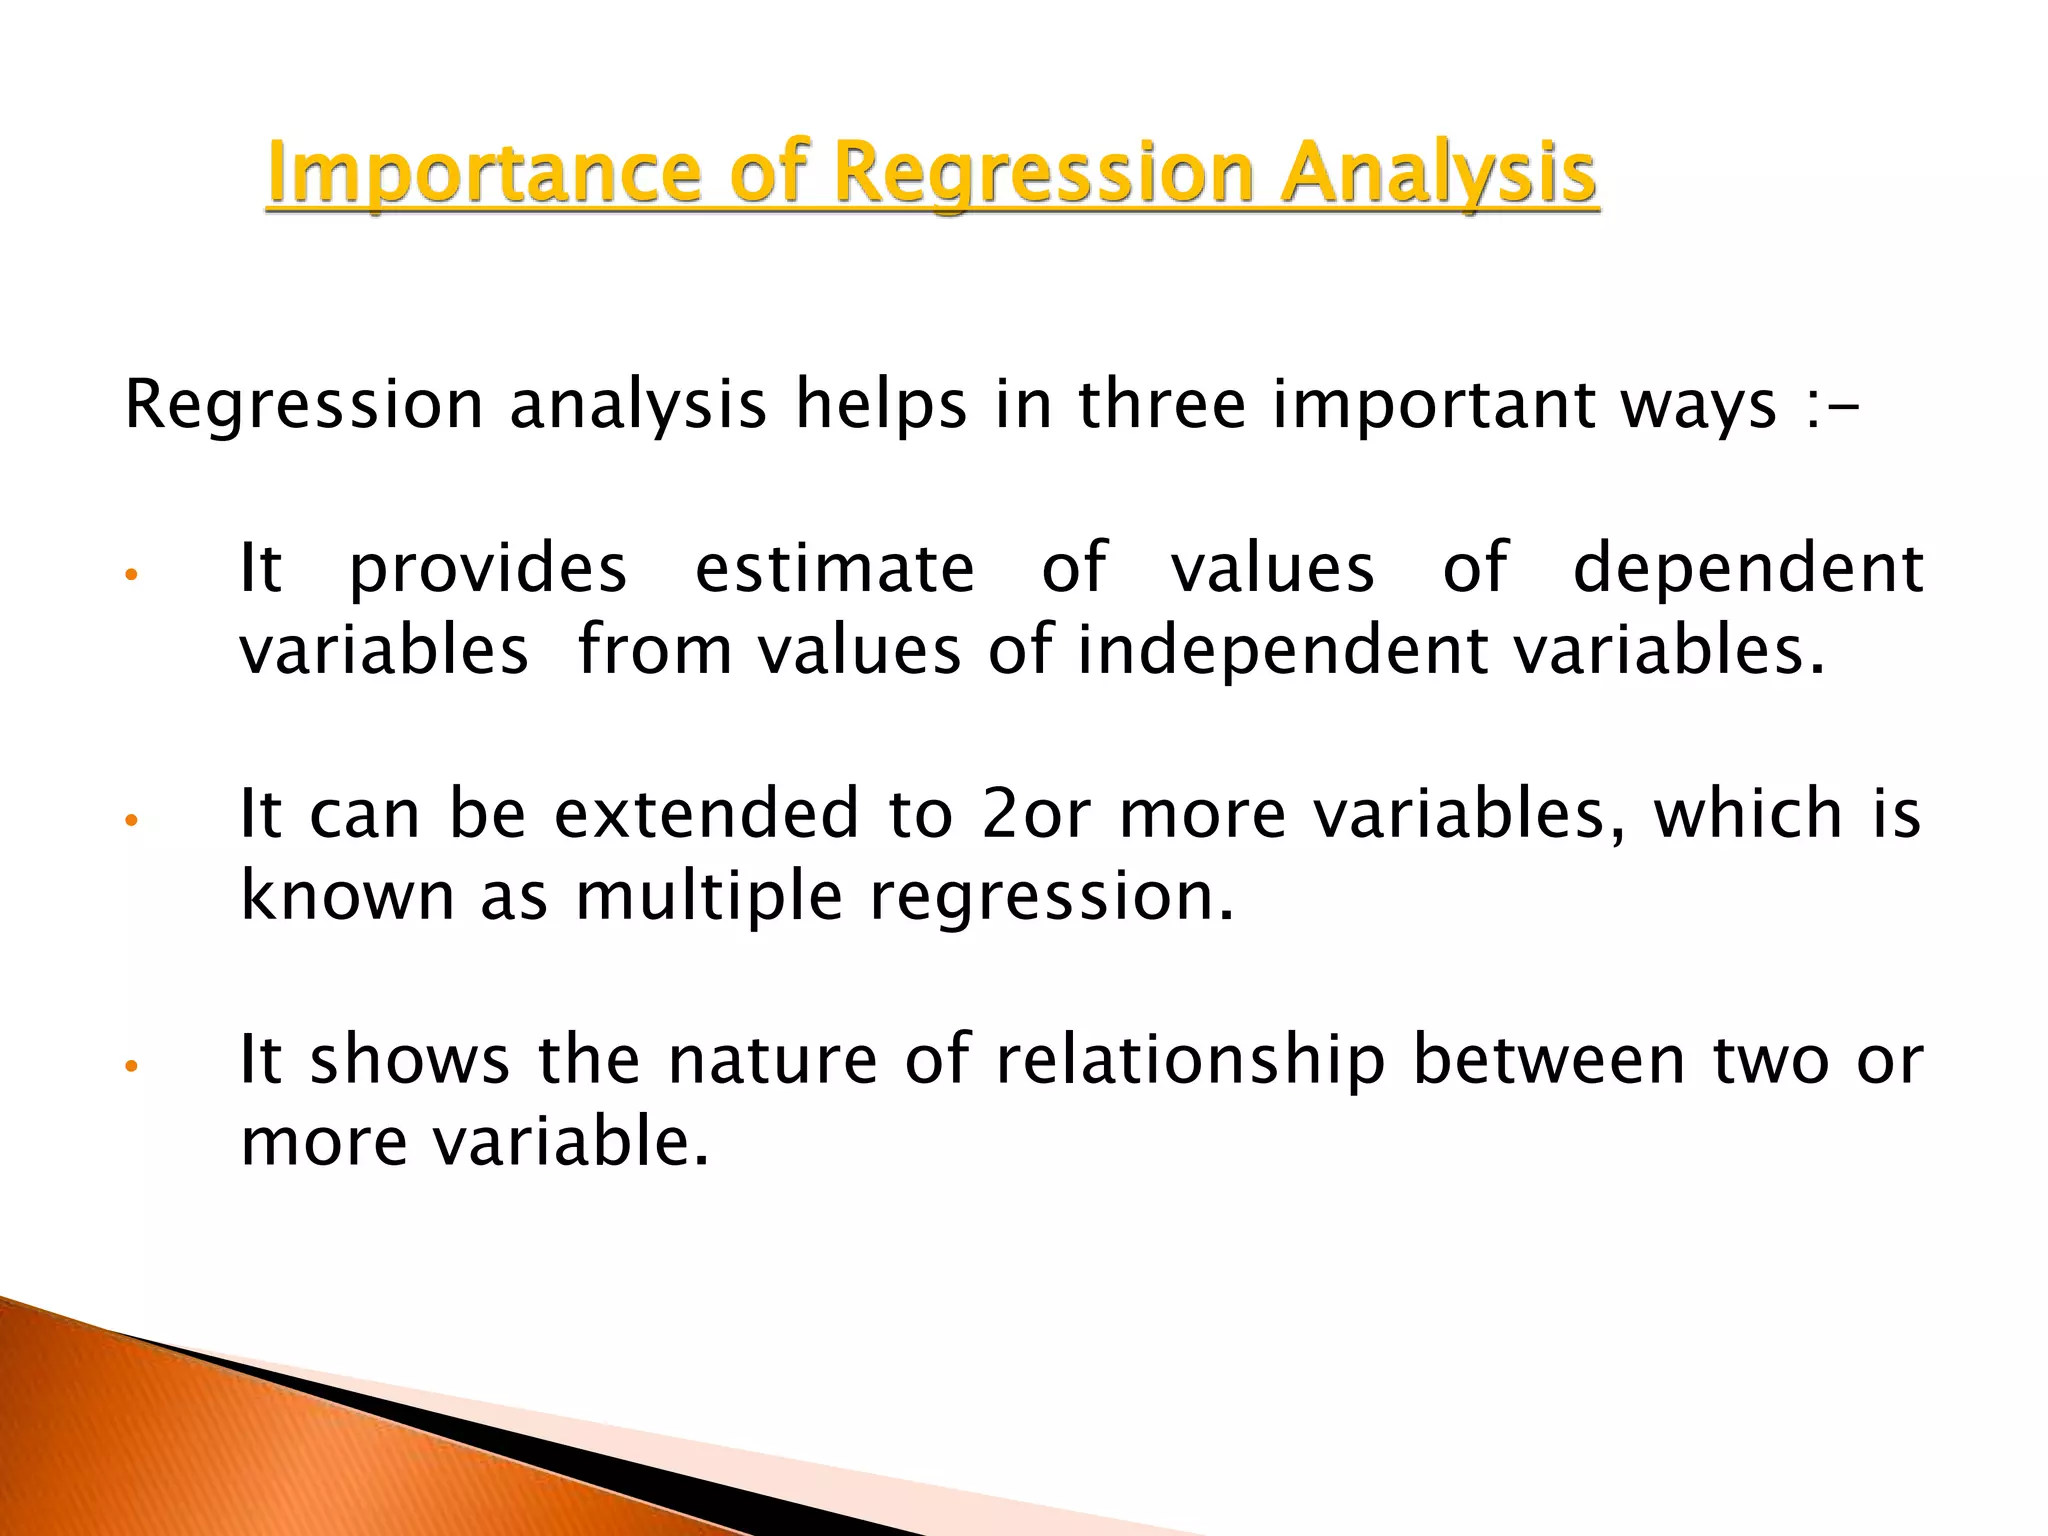
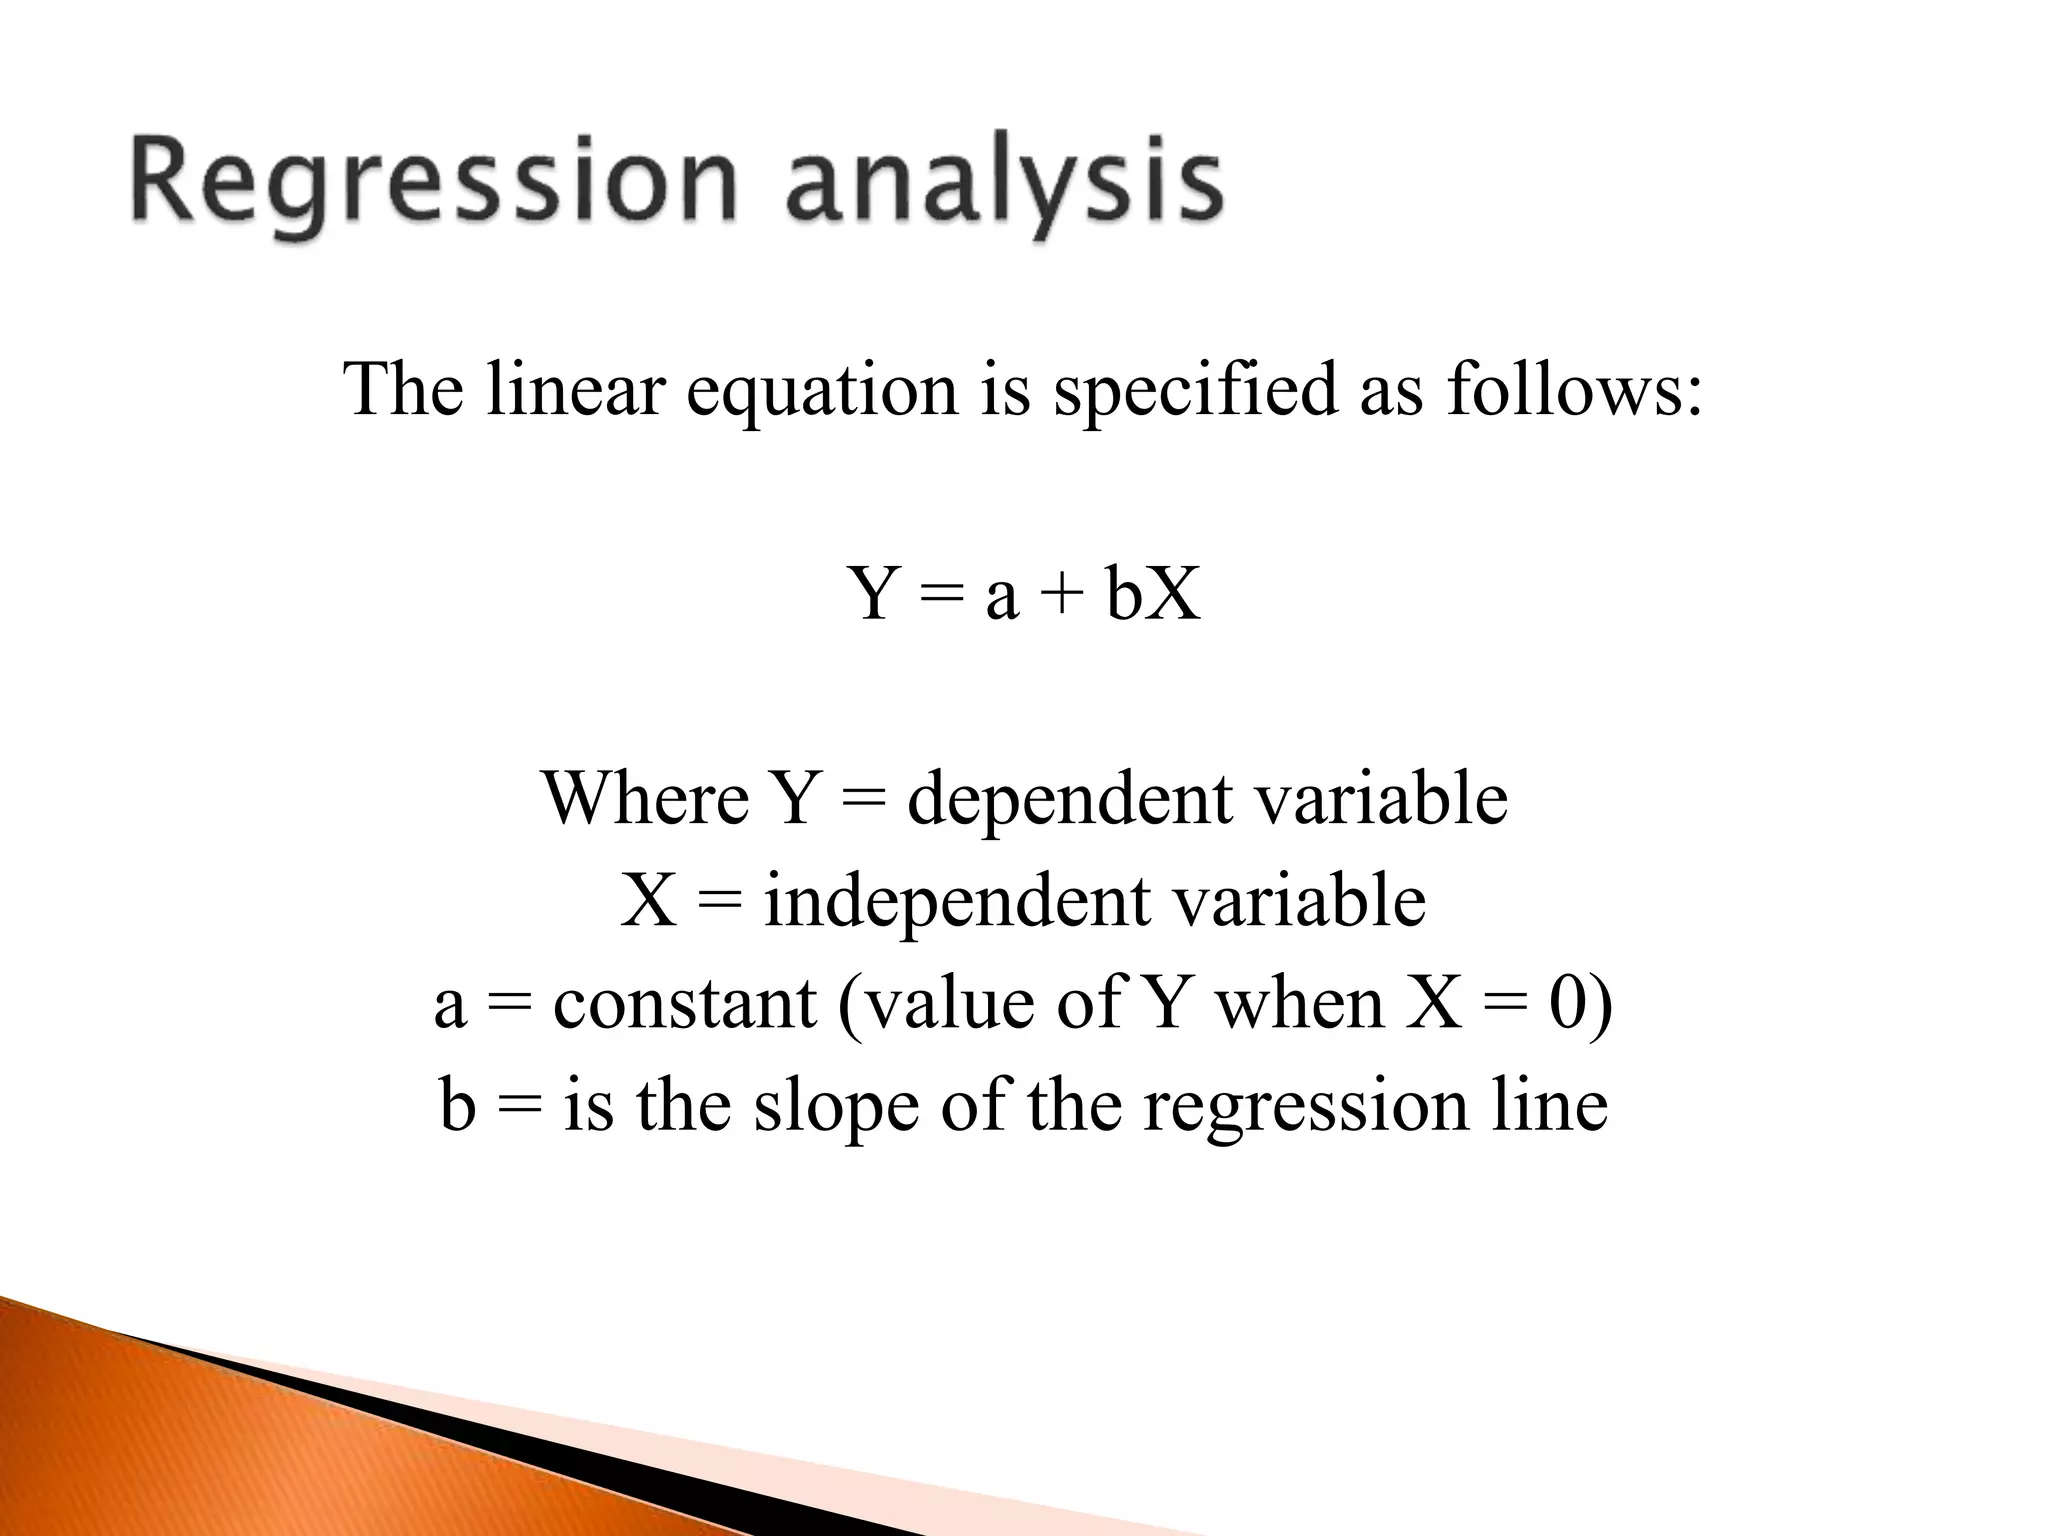
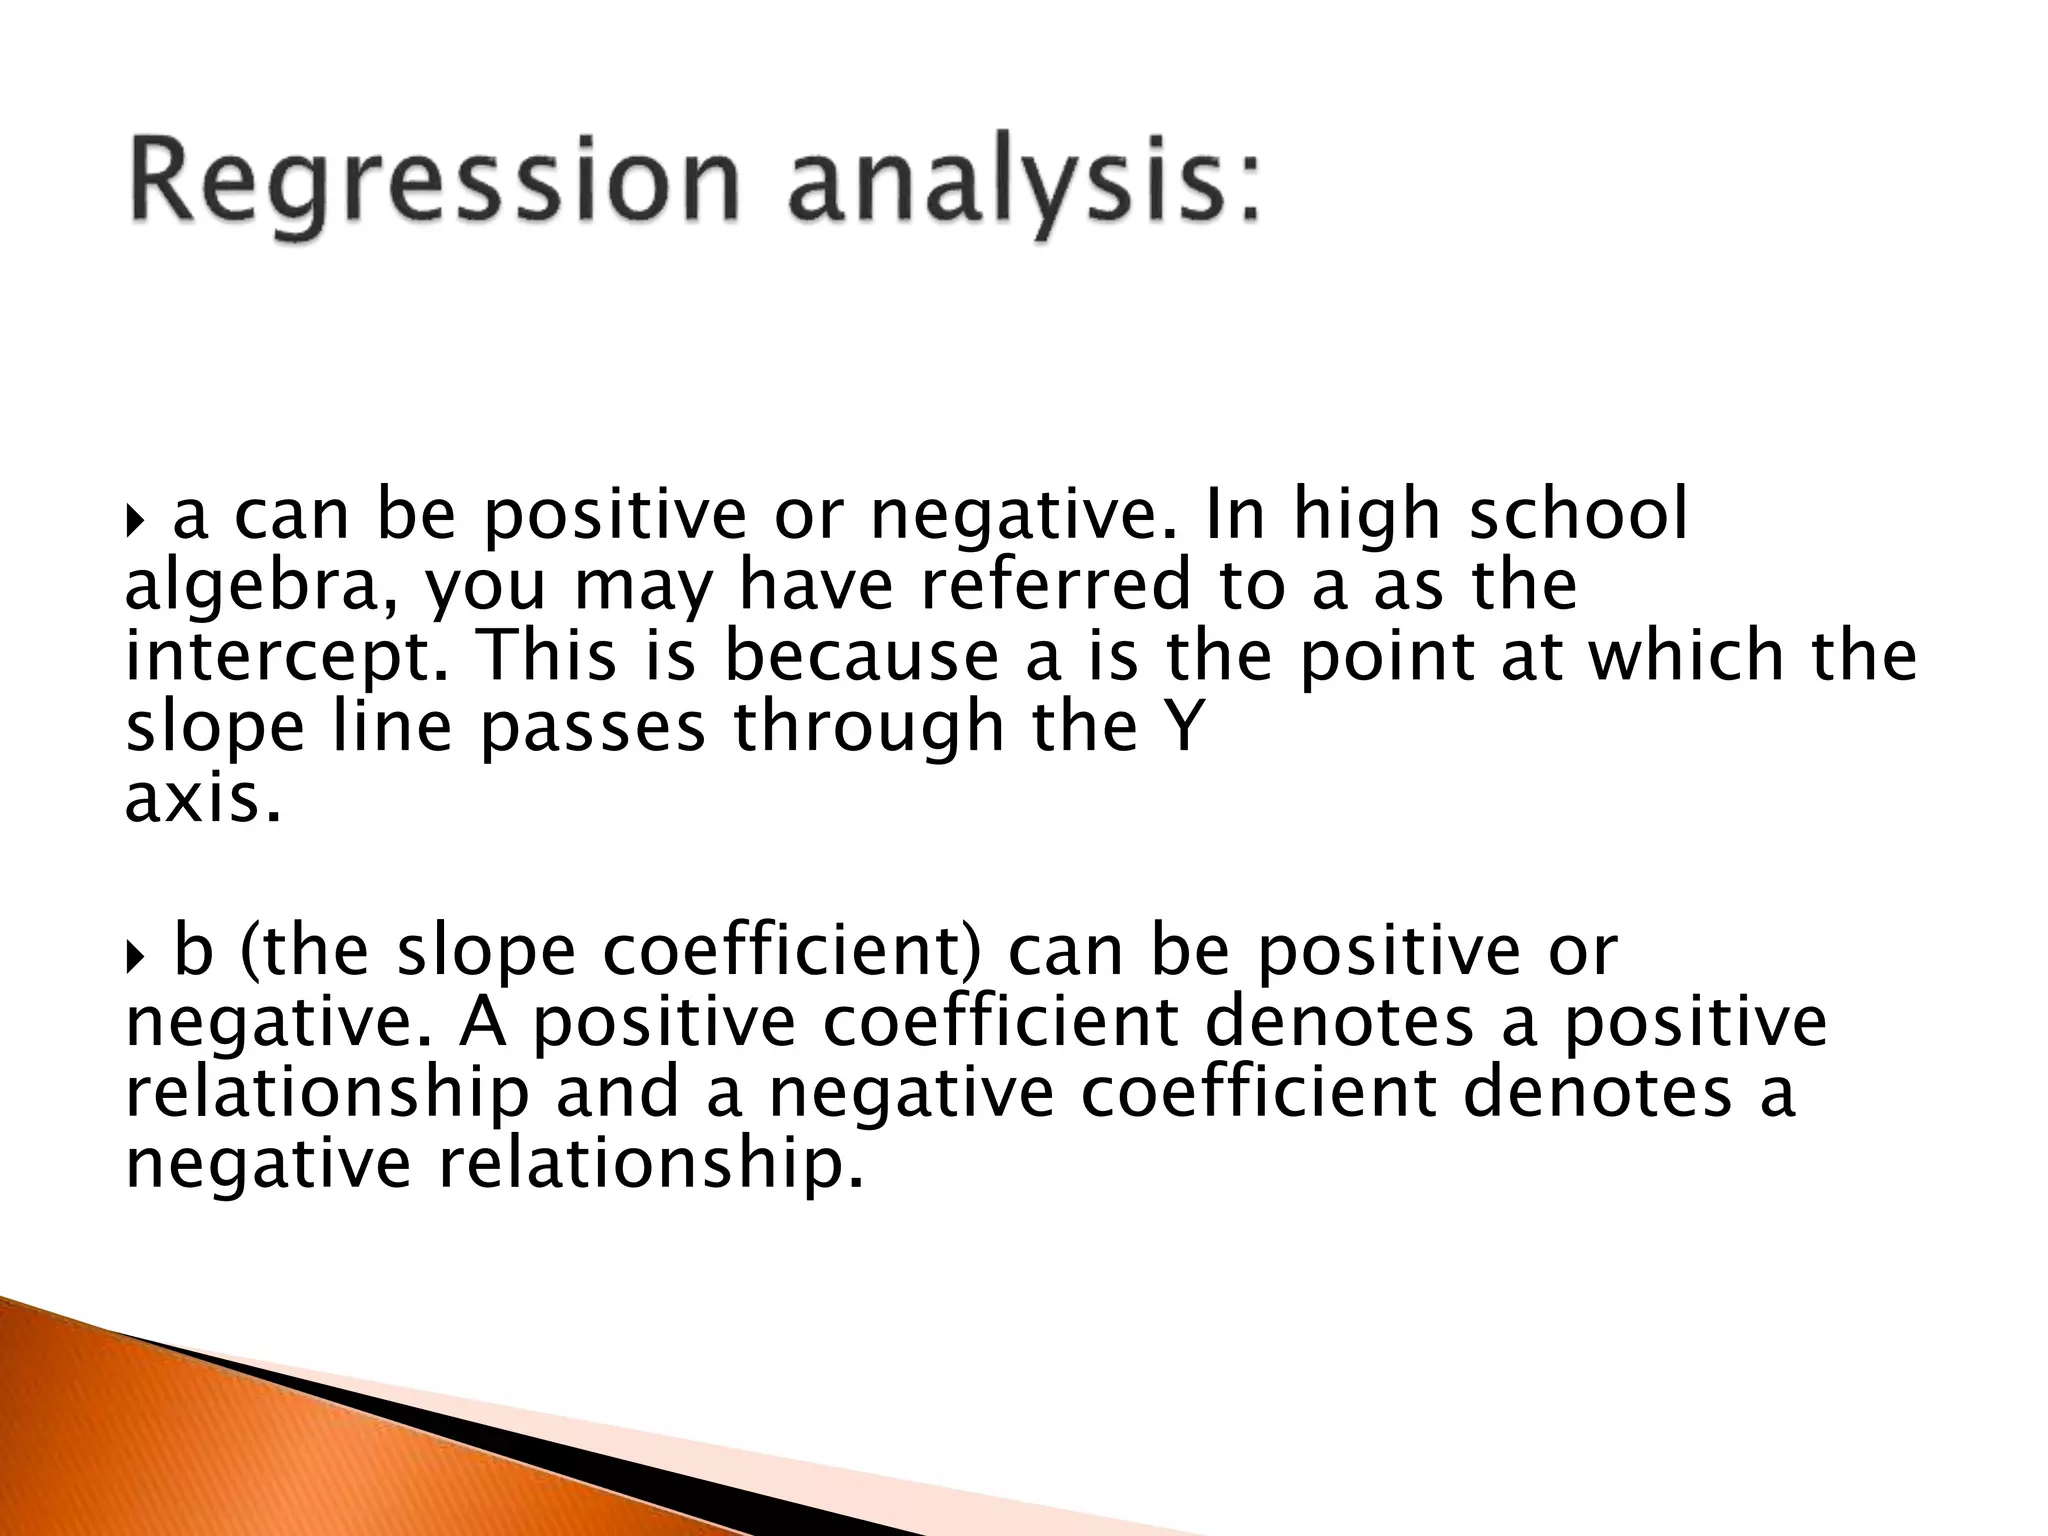
- An introduction to regression analysis and its uses in measuring relationships between variables and making predictions.
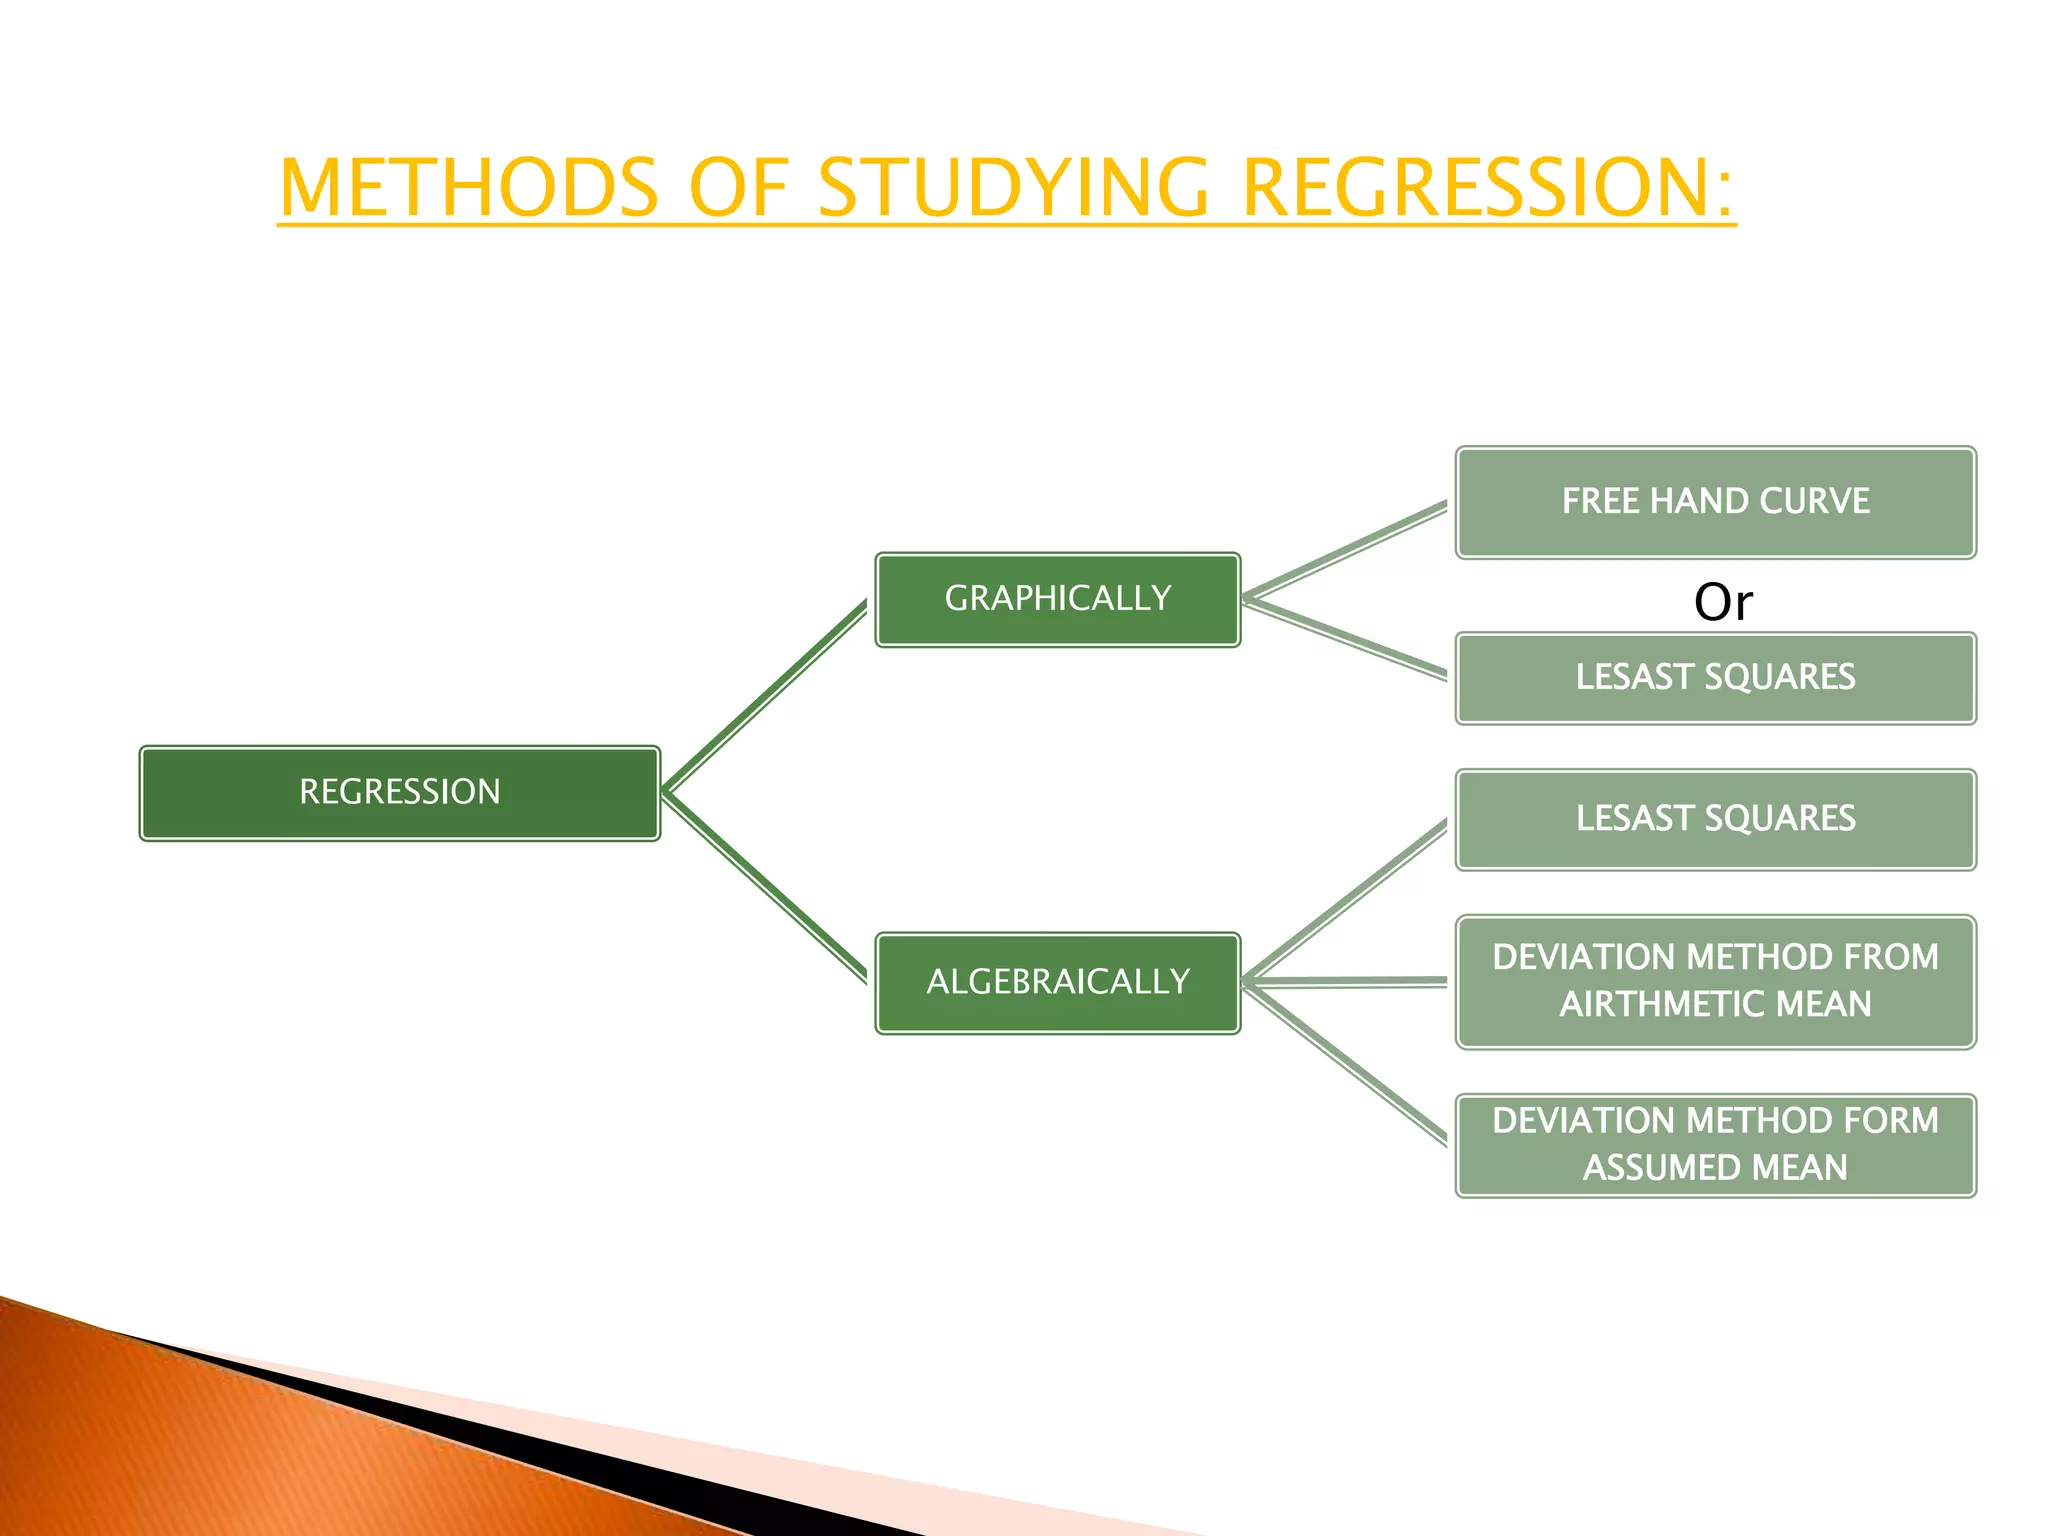
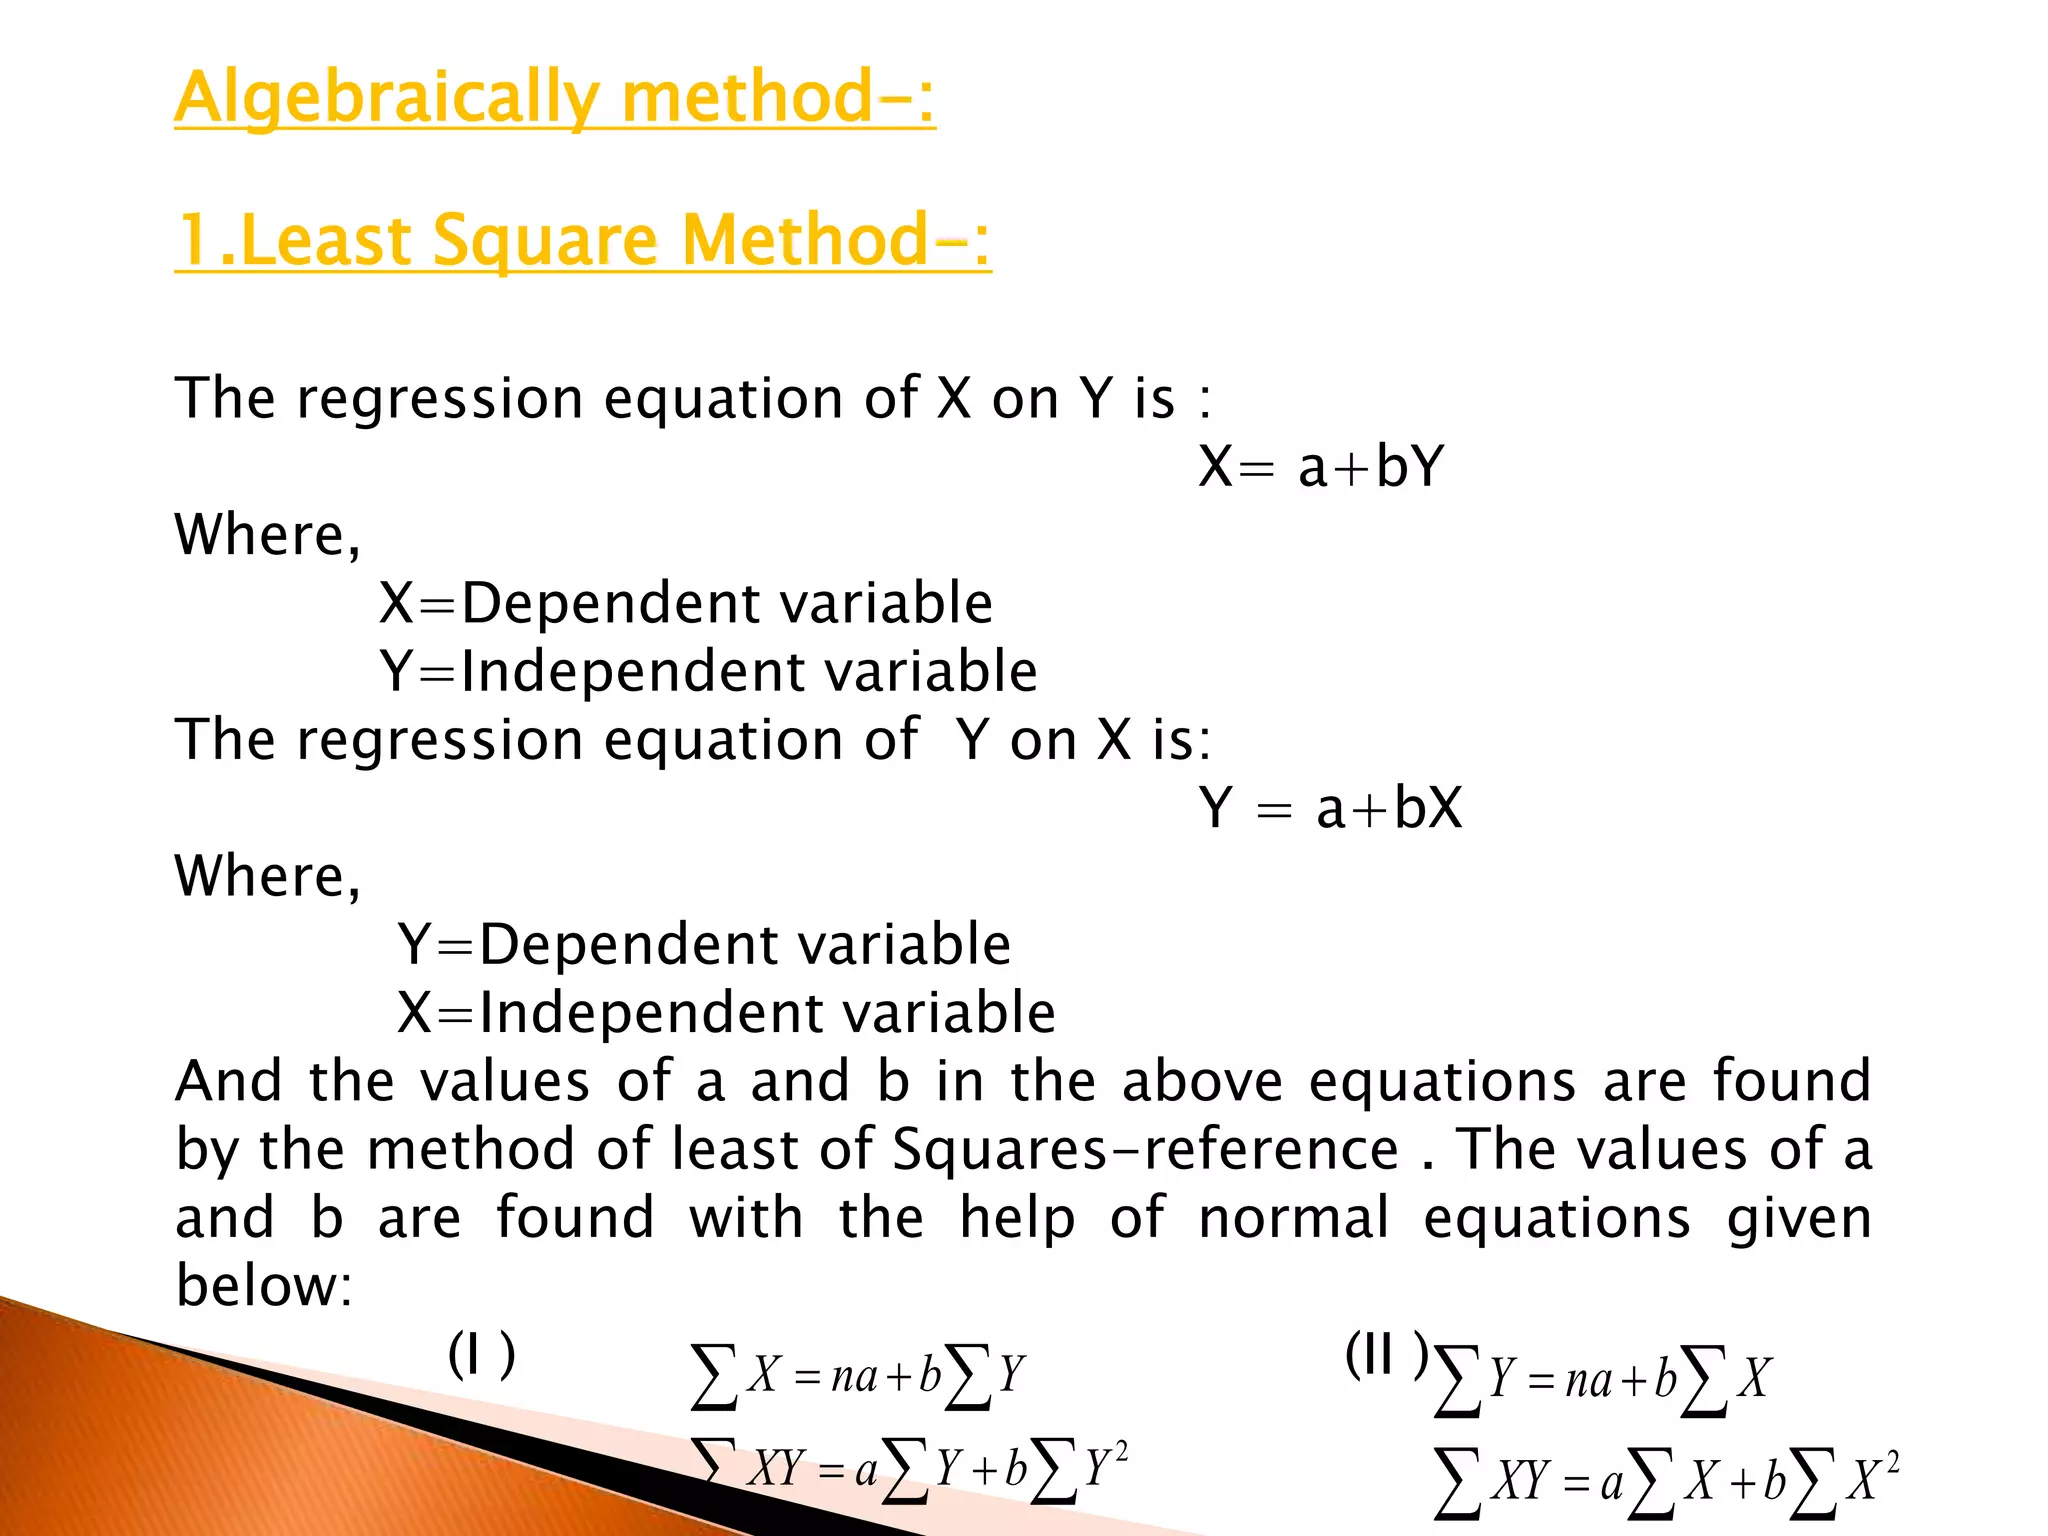
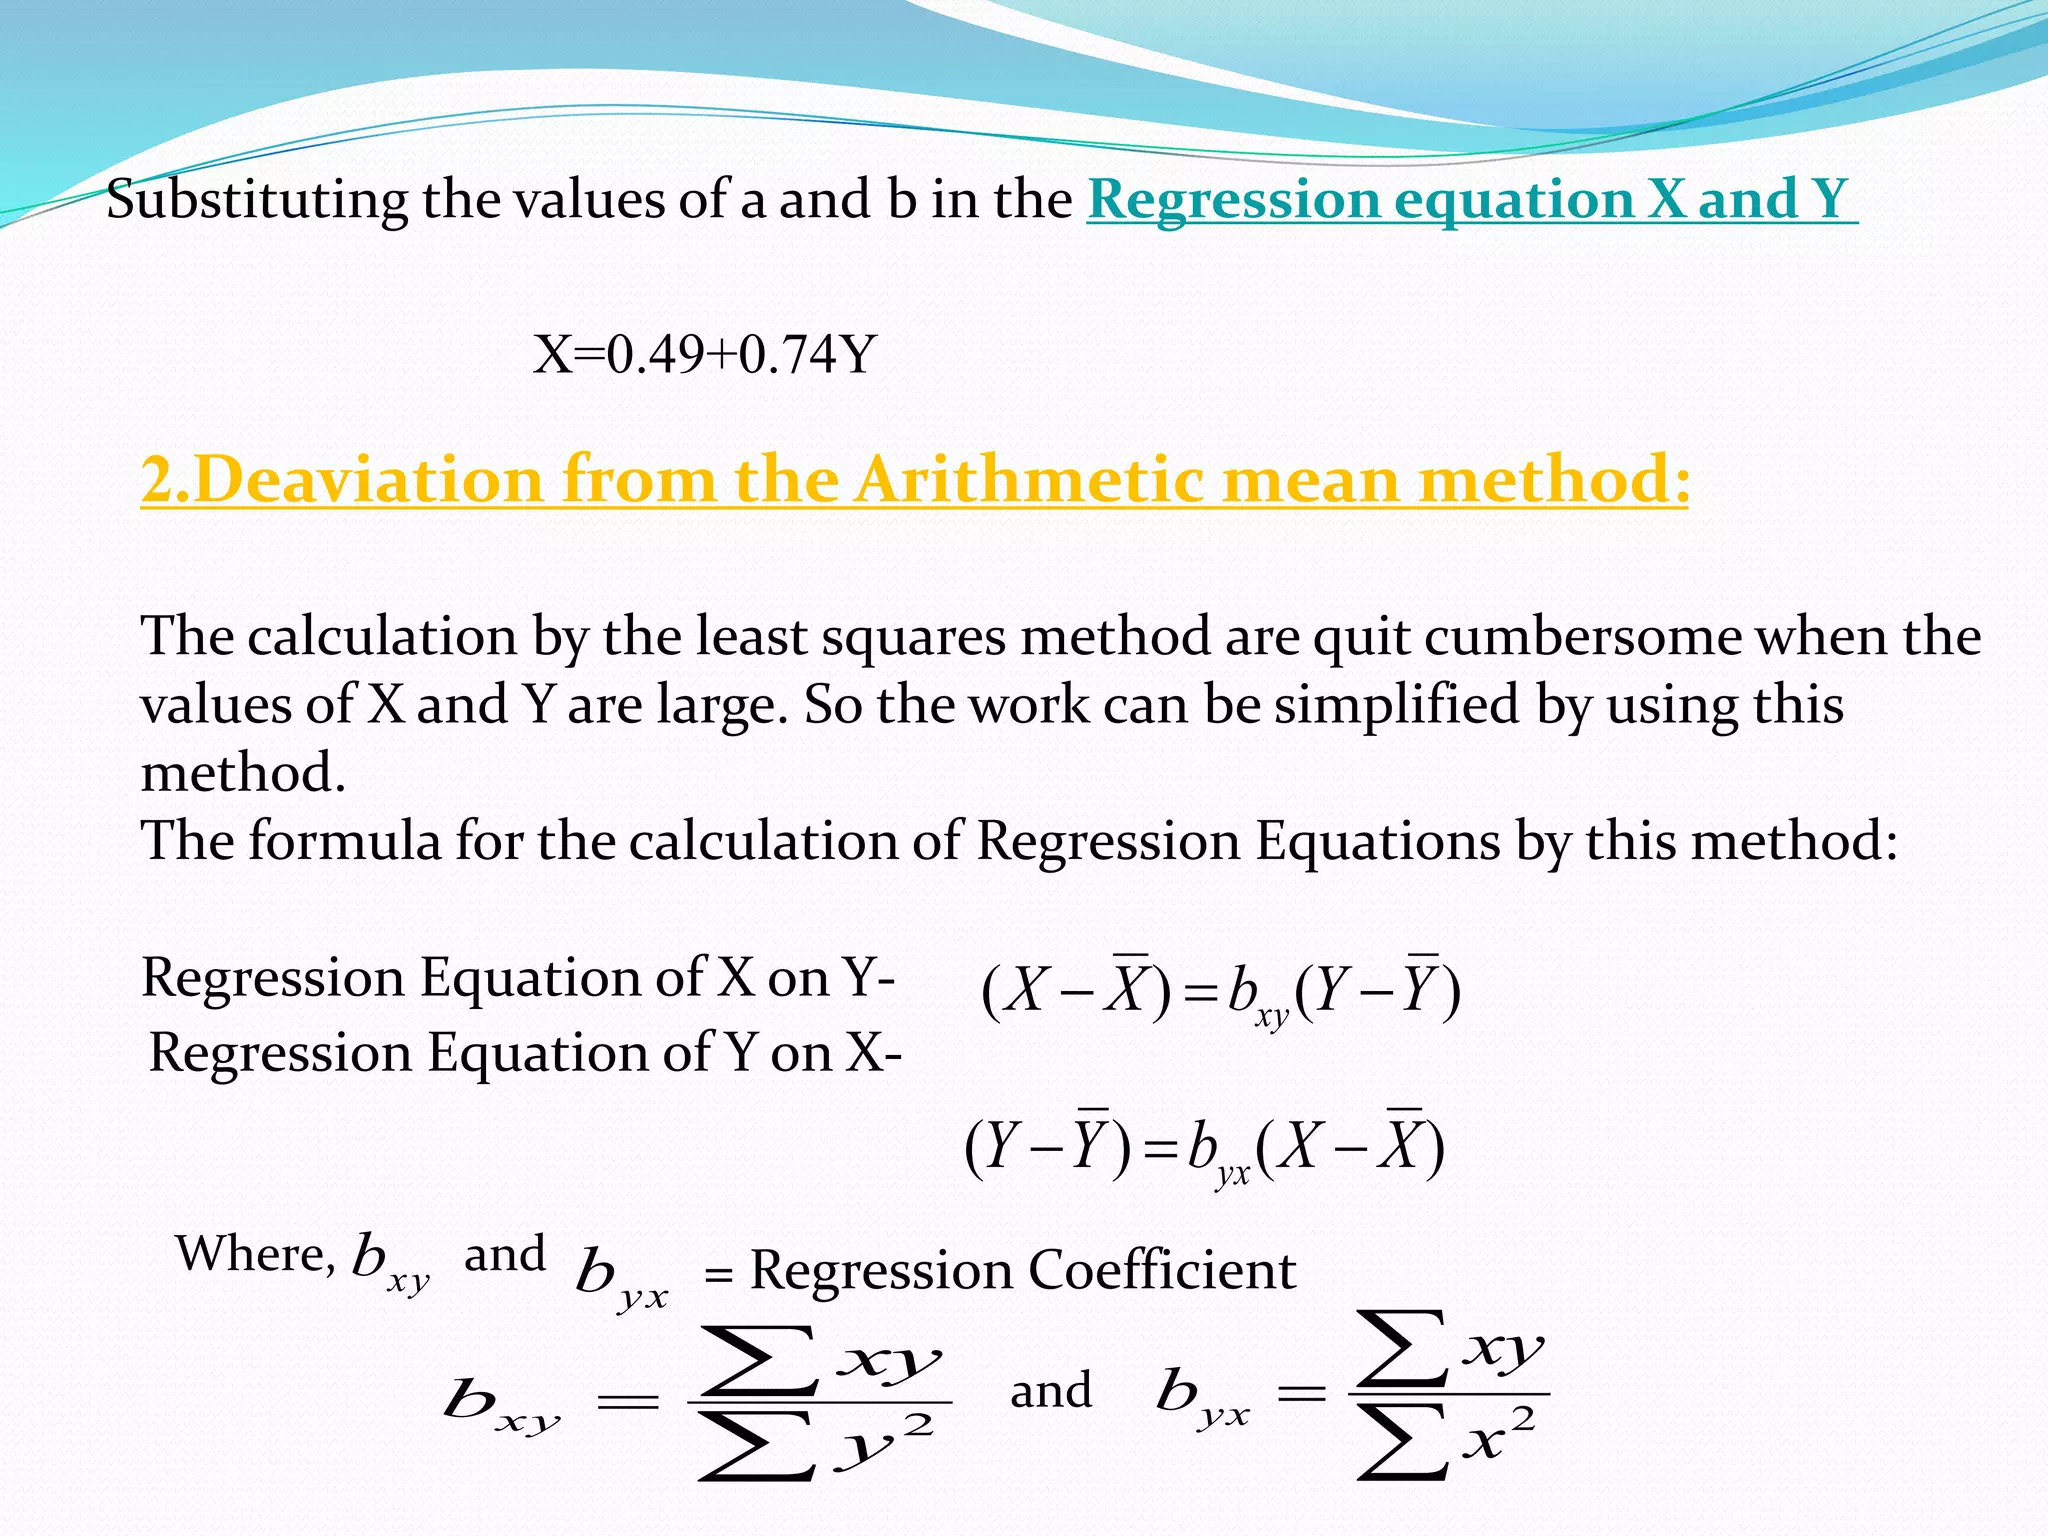
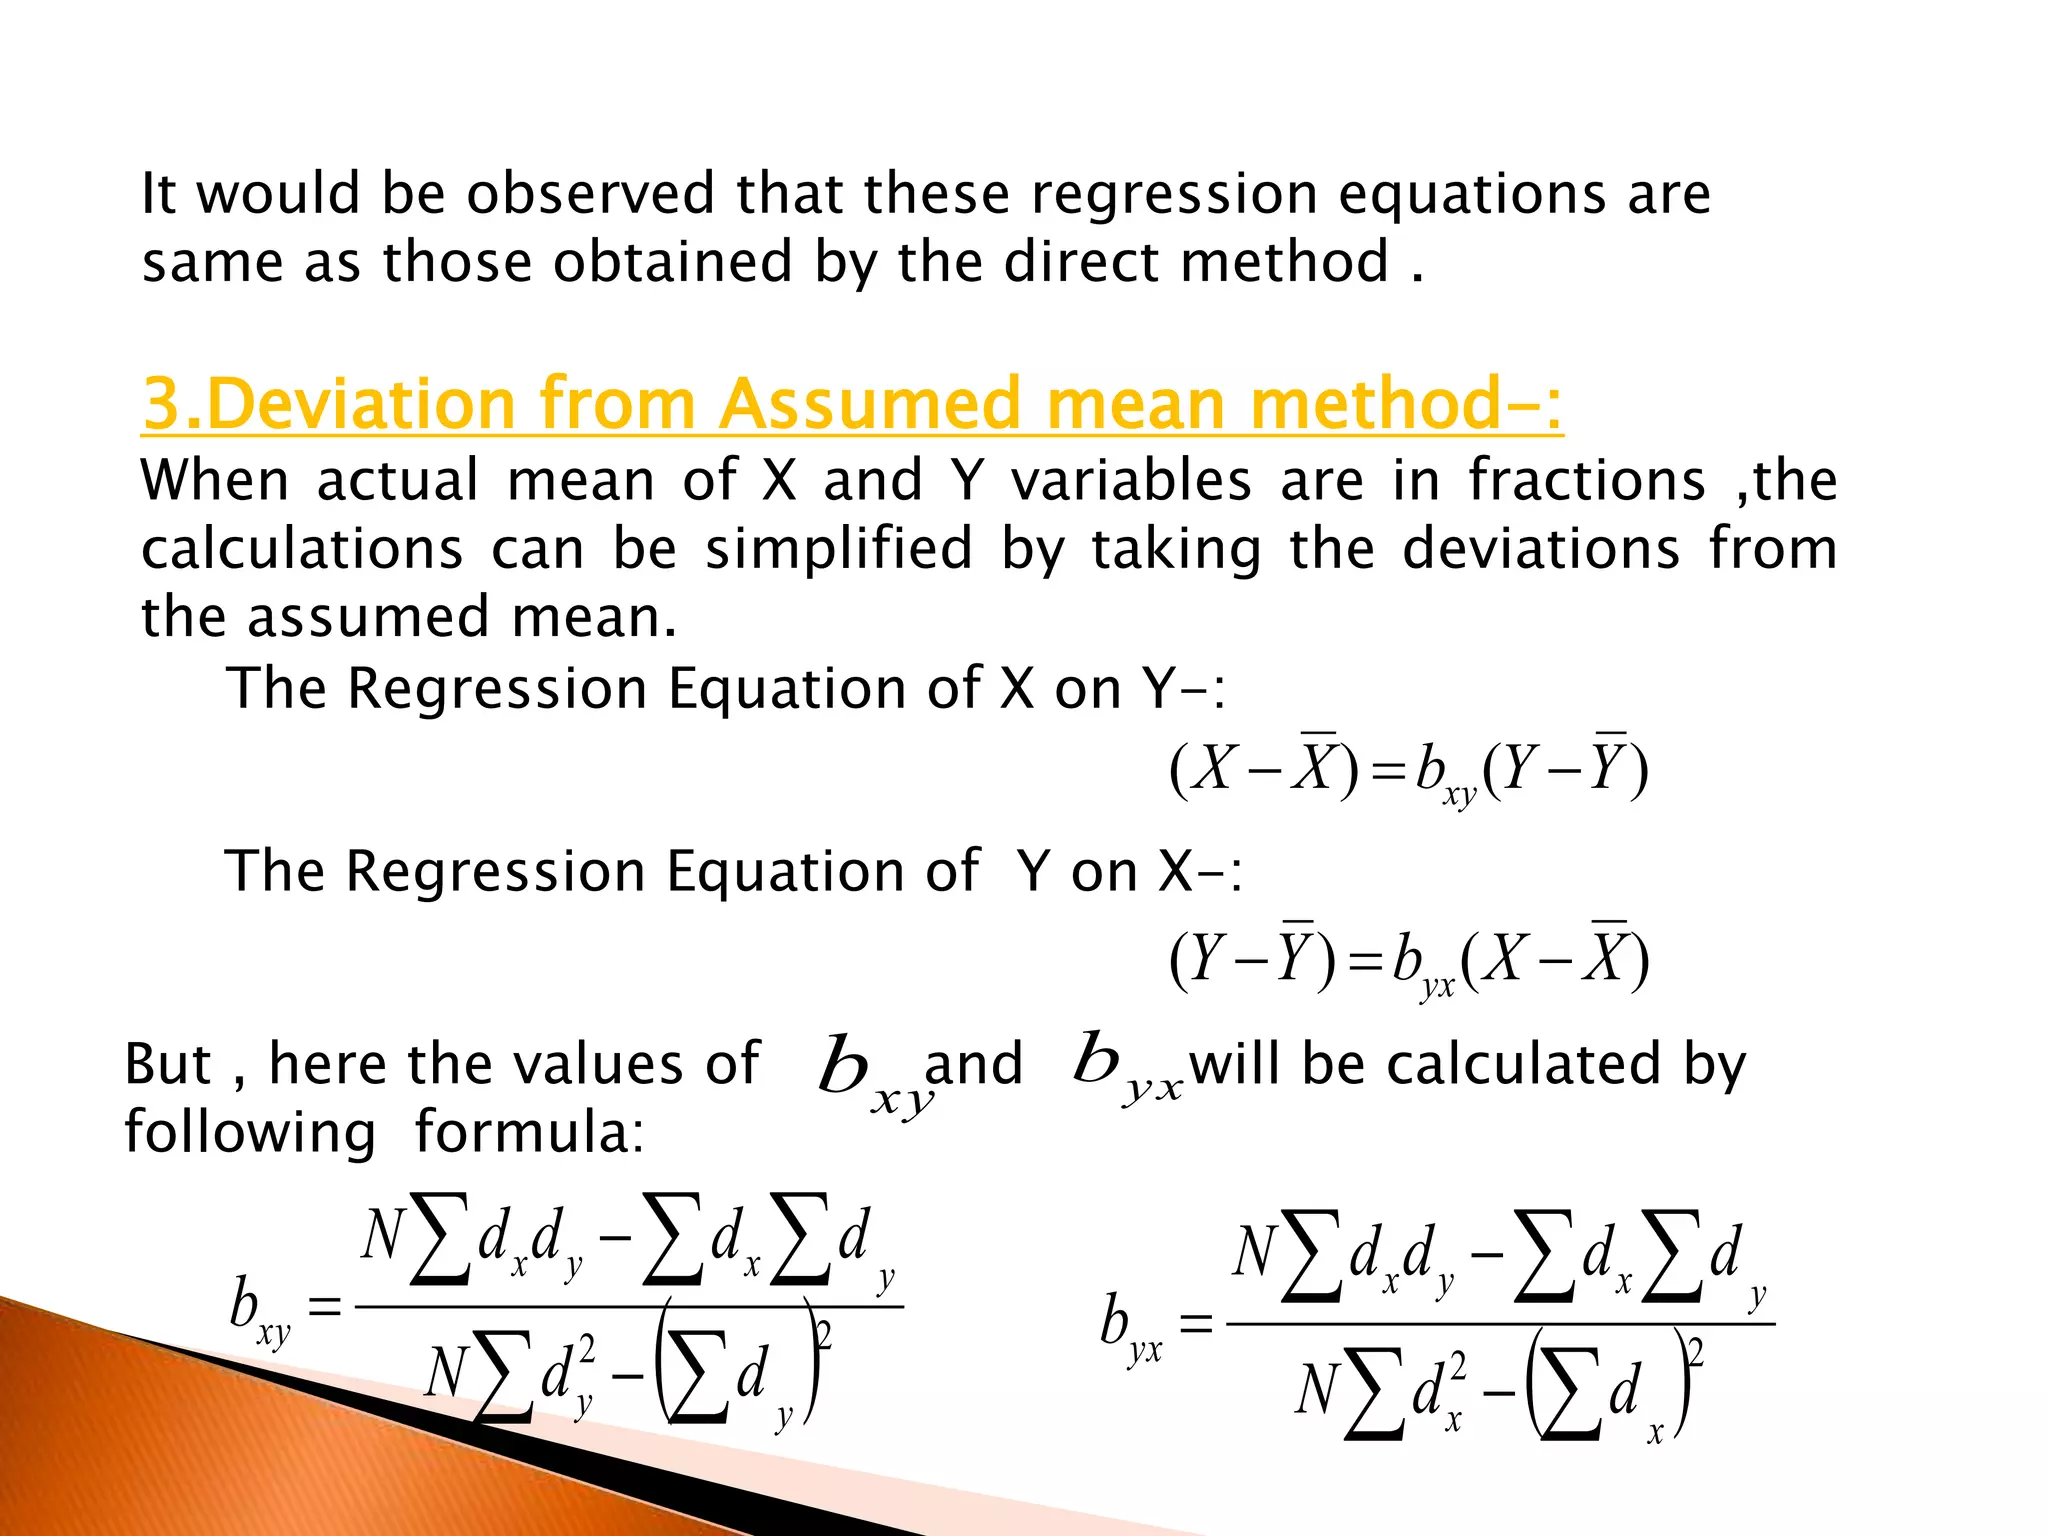
- Methods for studying regression including graphically, algebraically using least squares, and deviations from means.
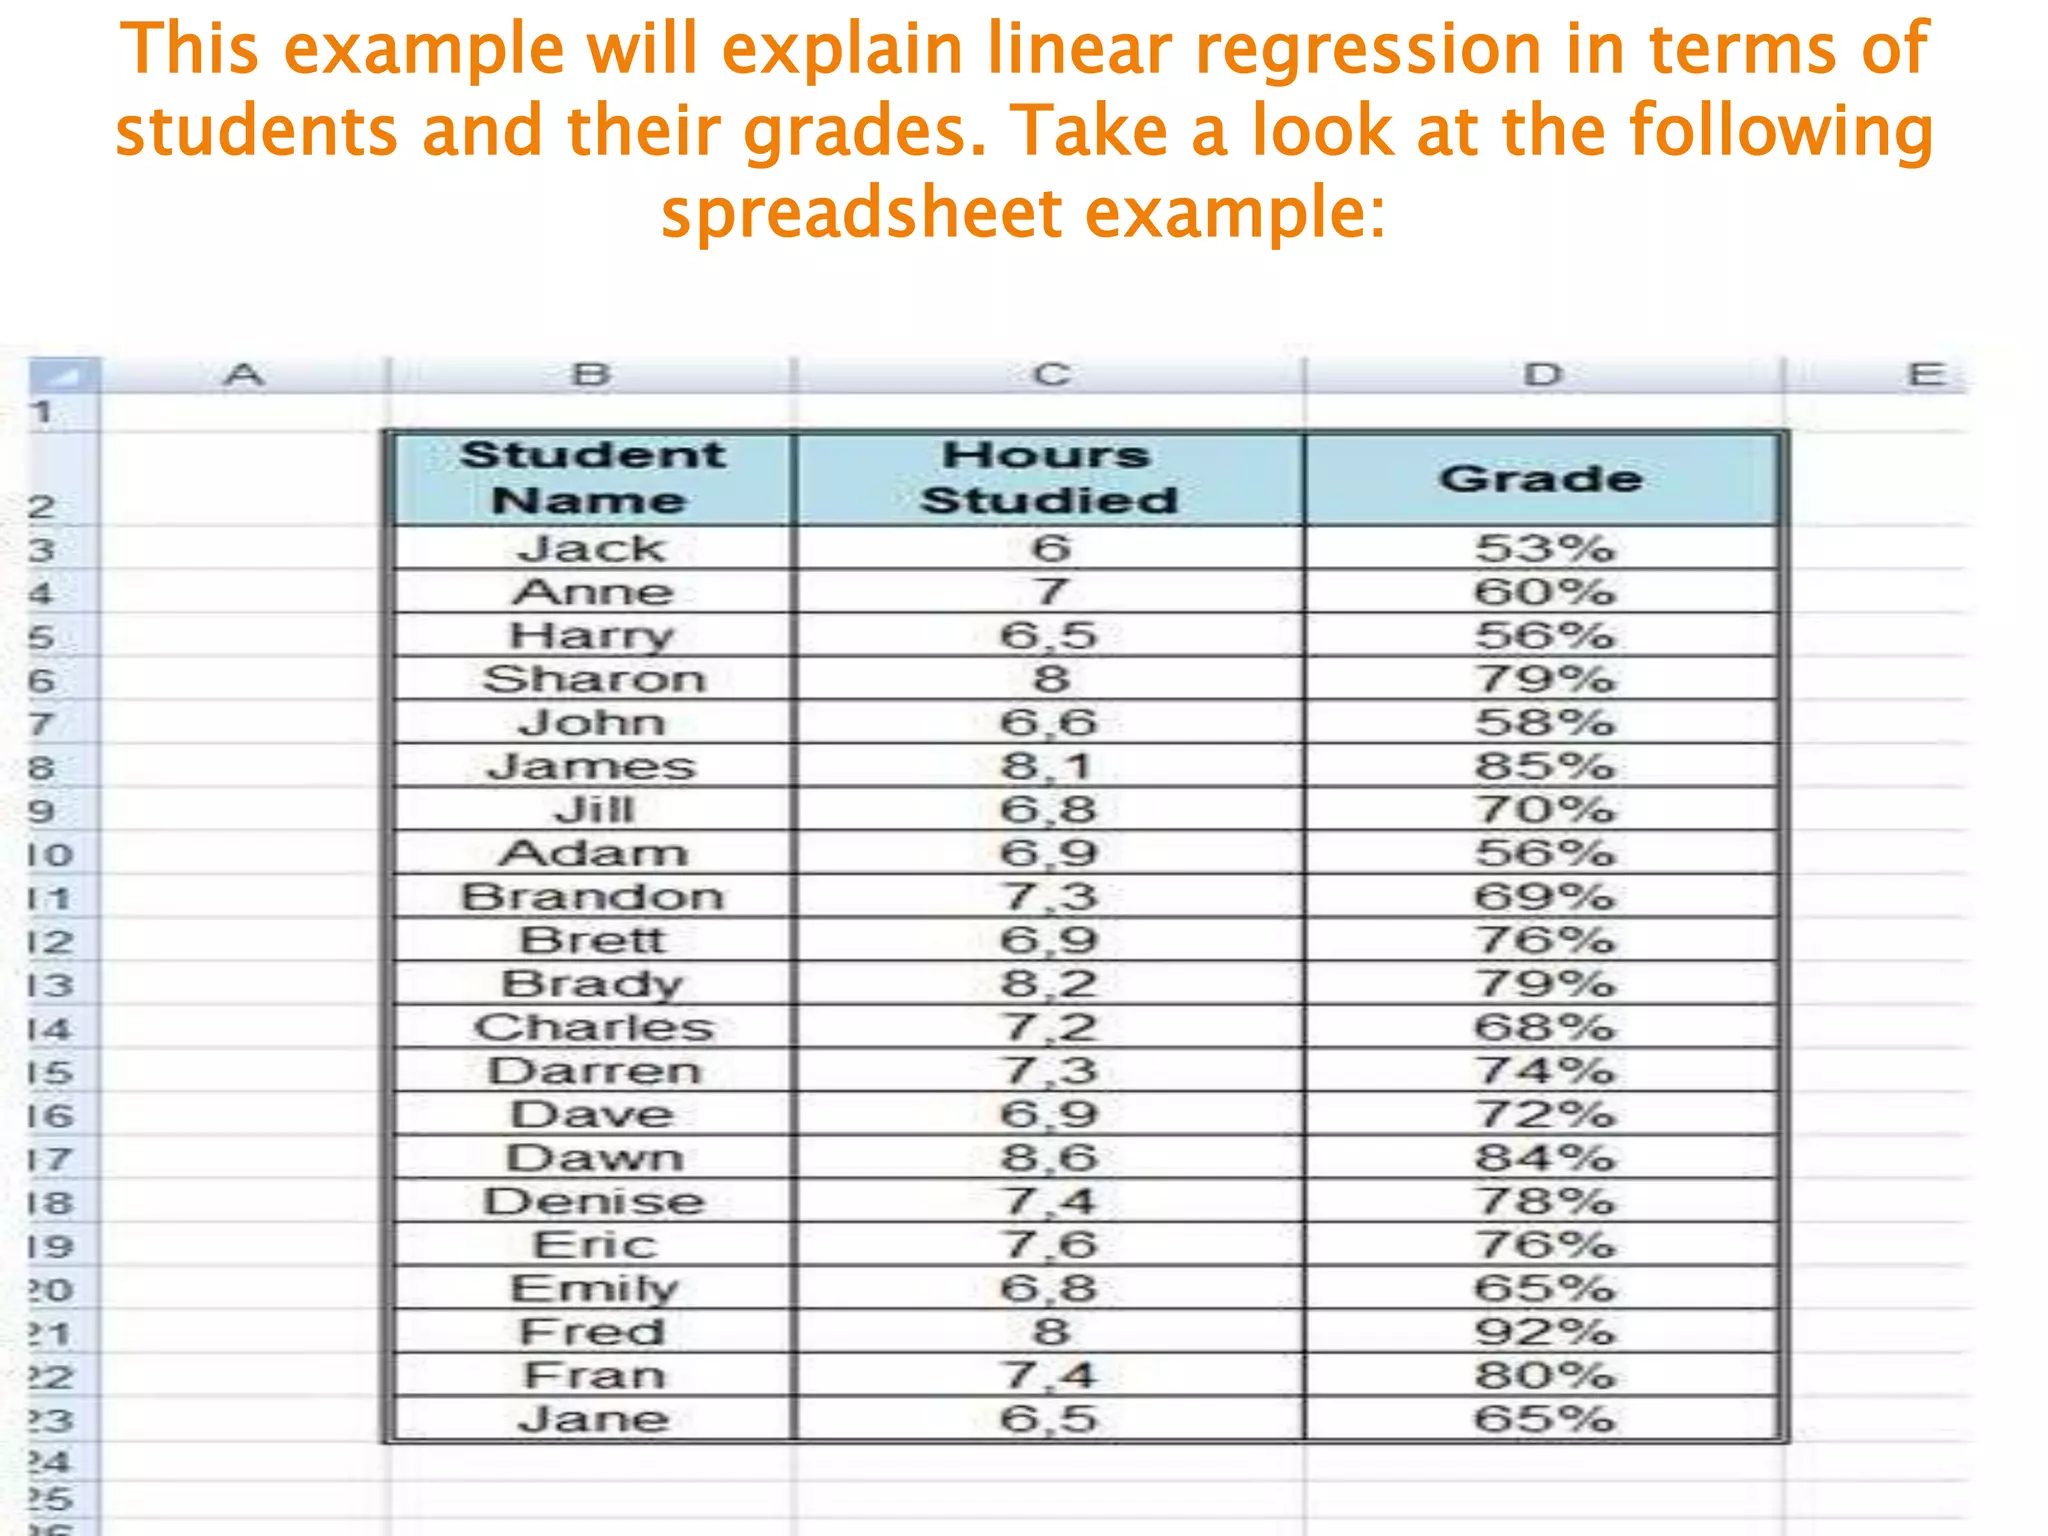
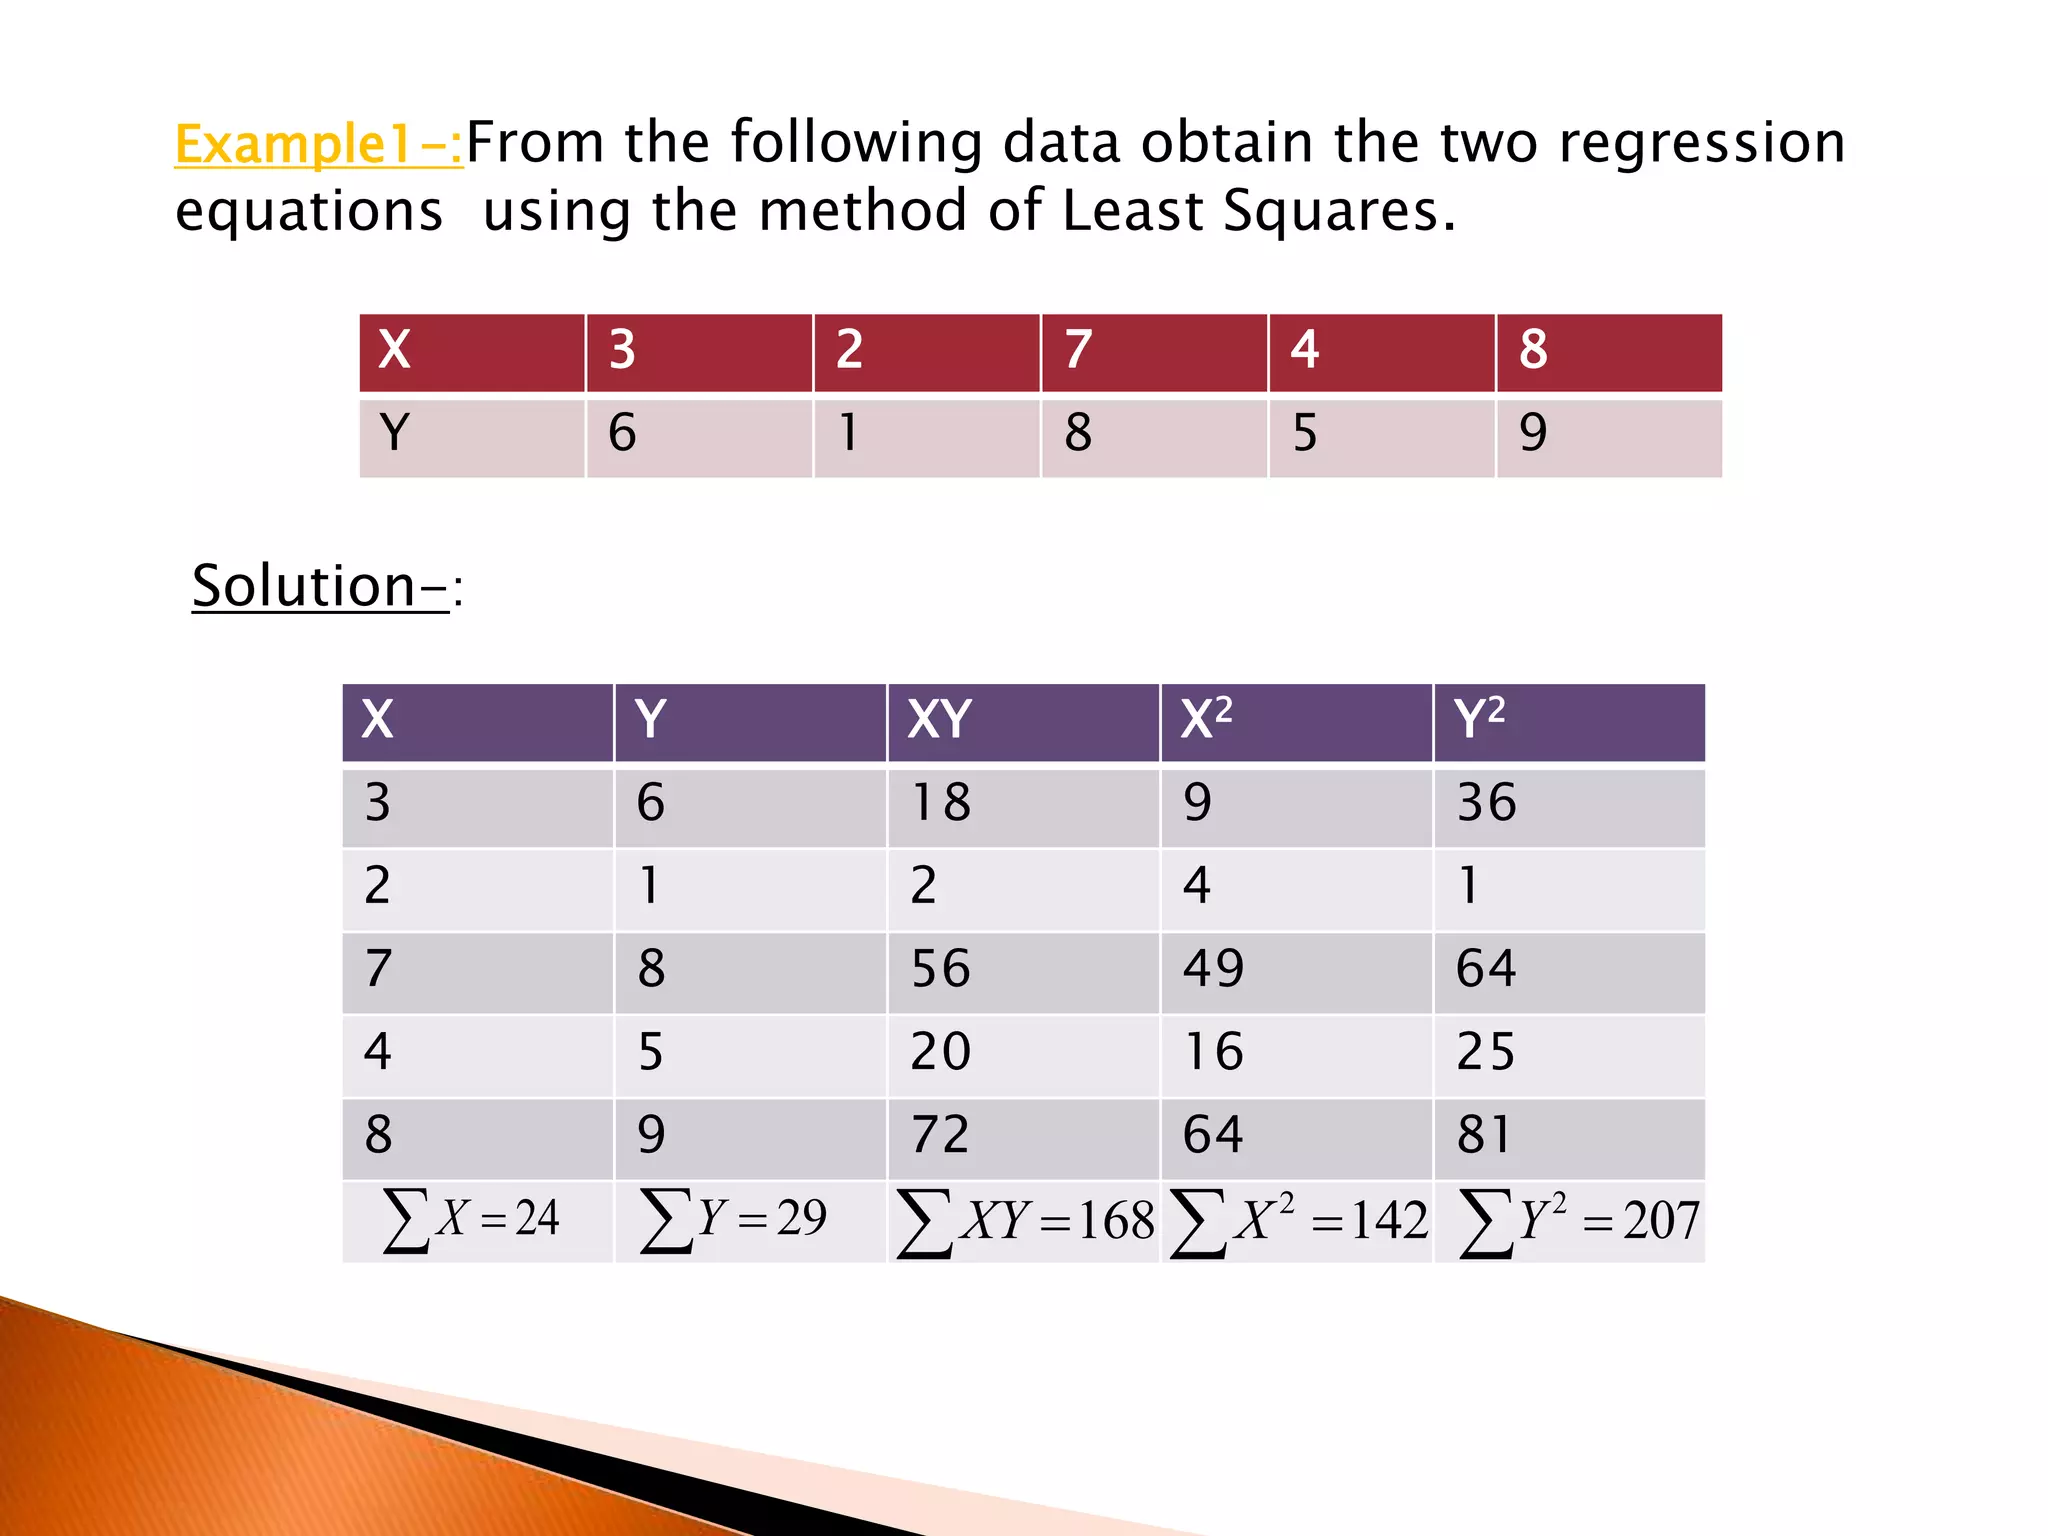
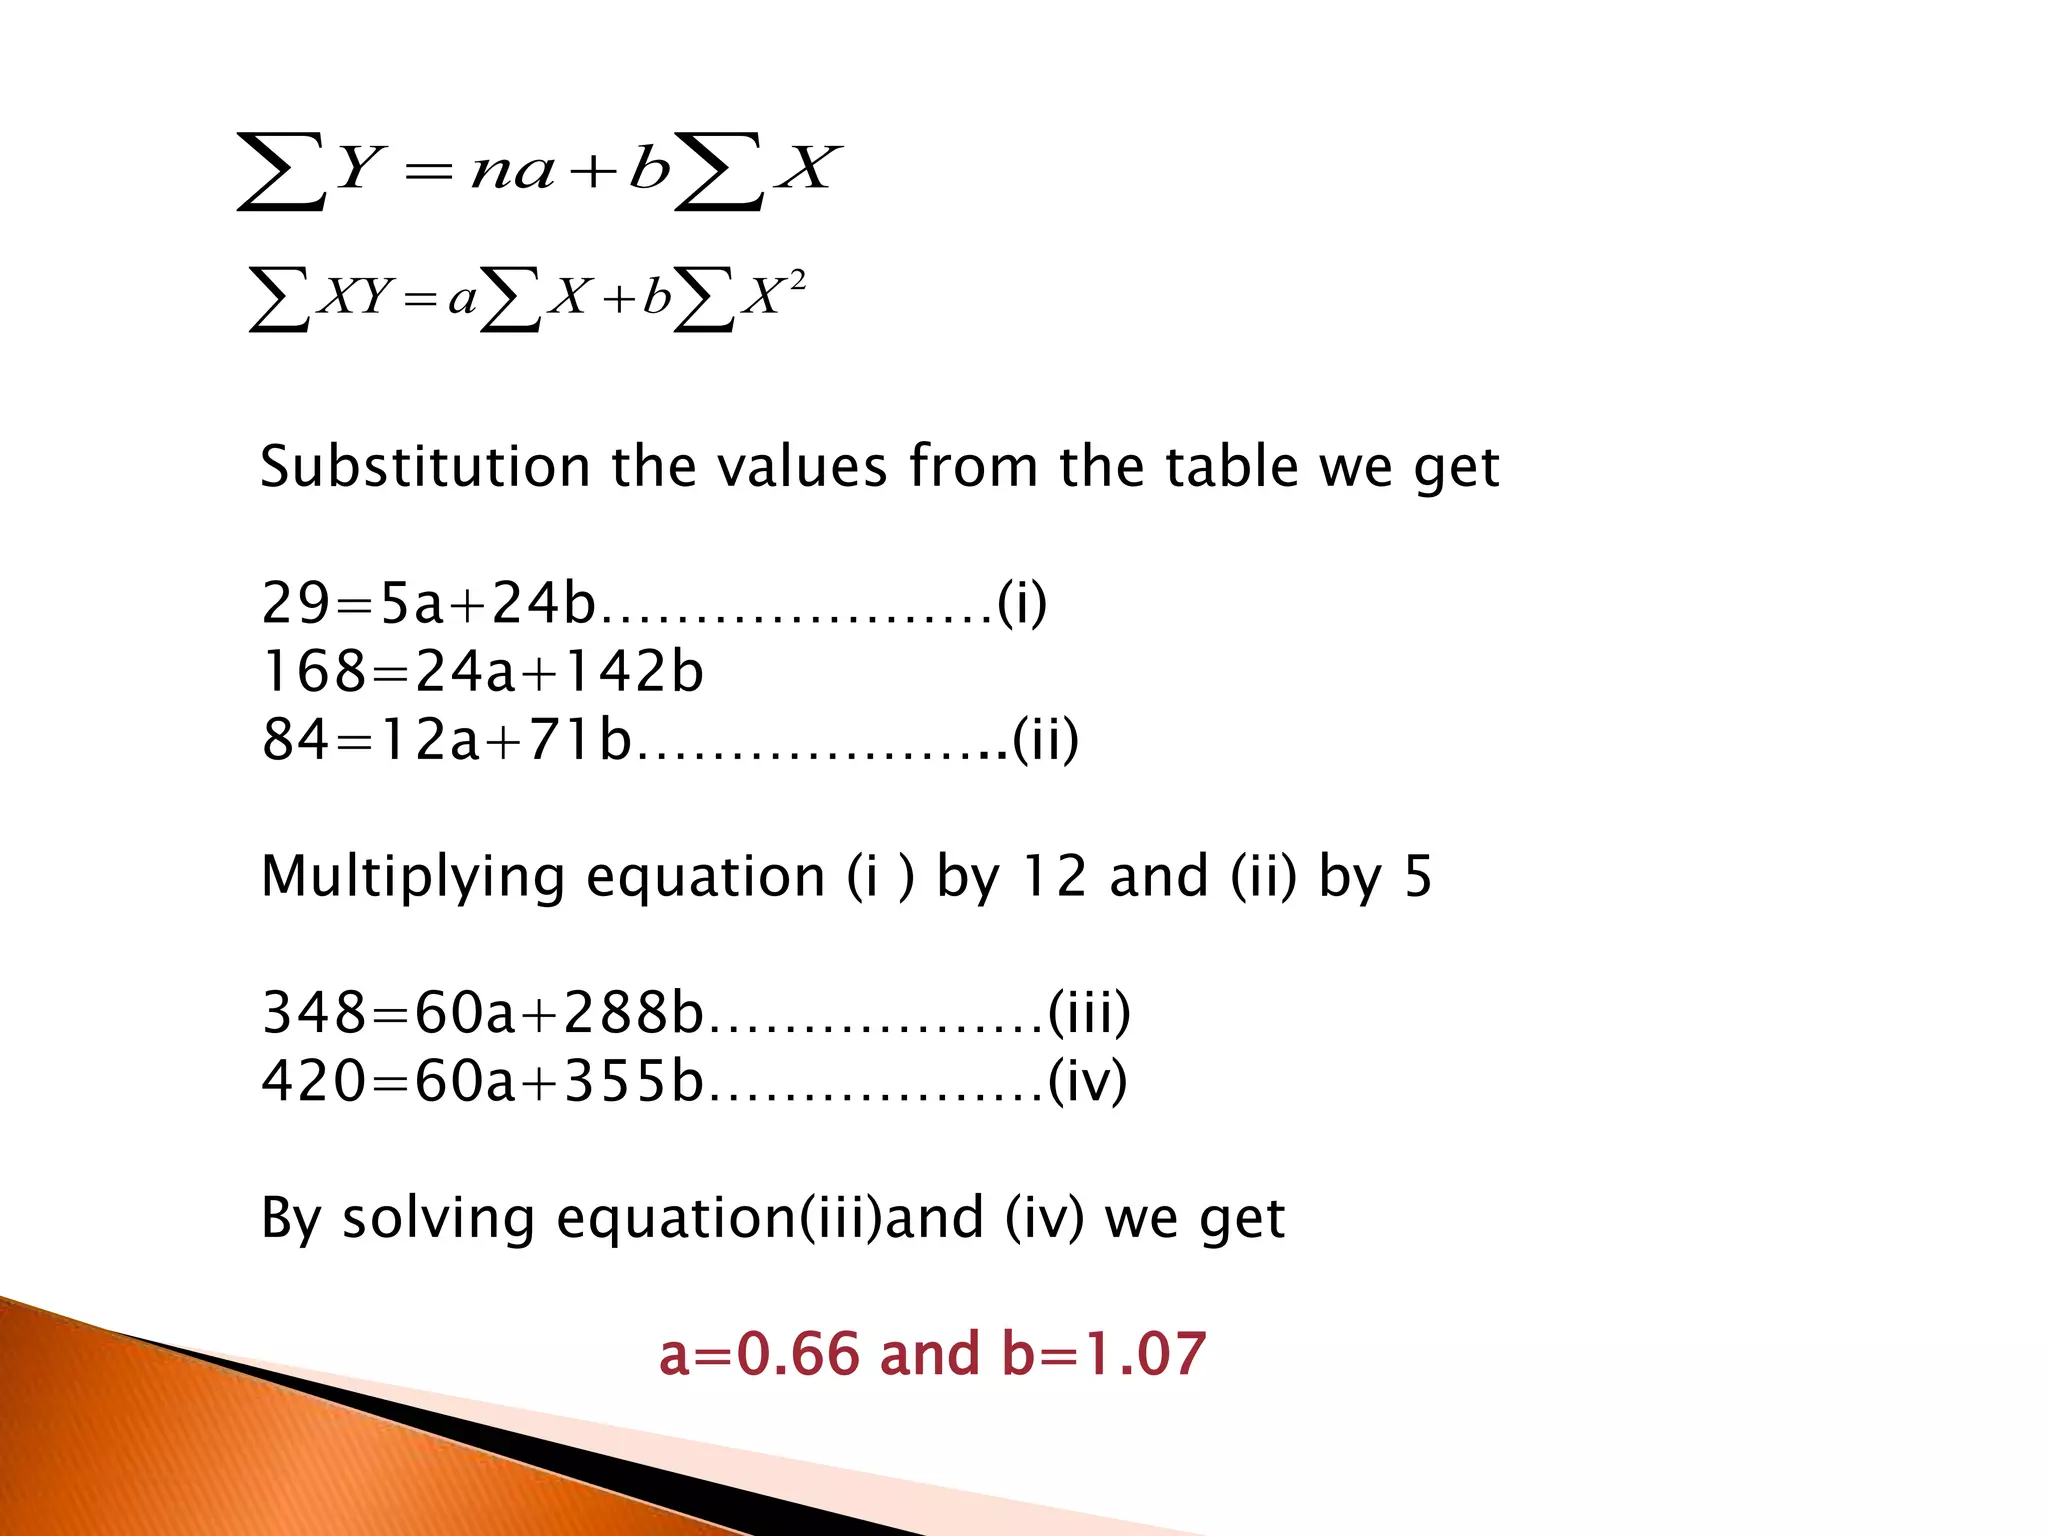
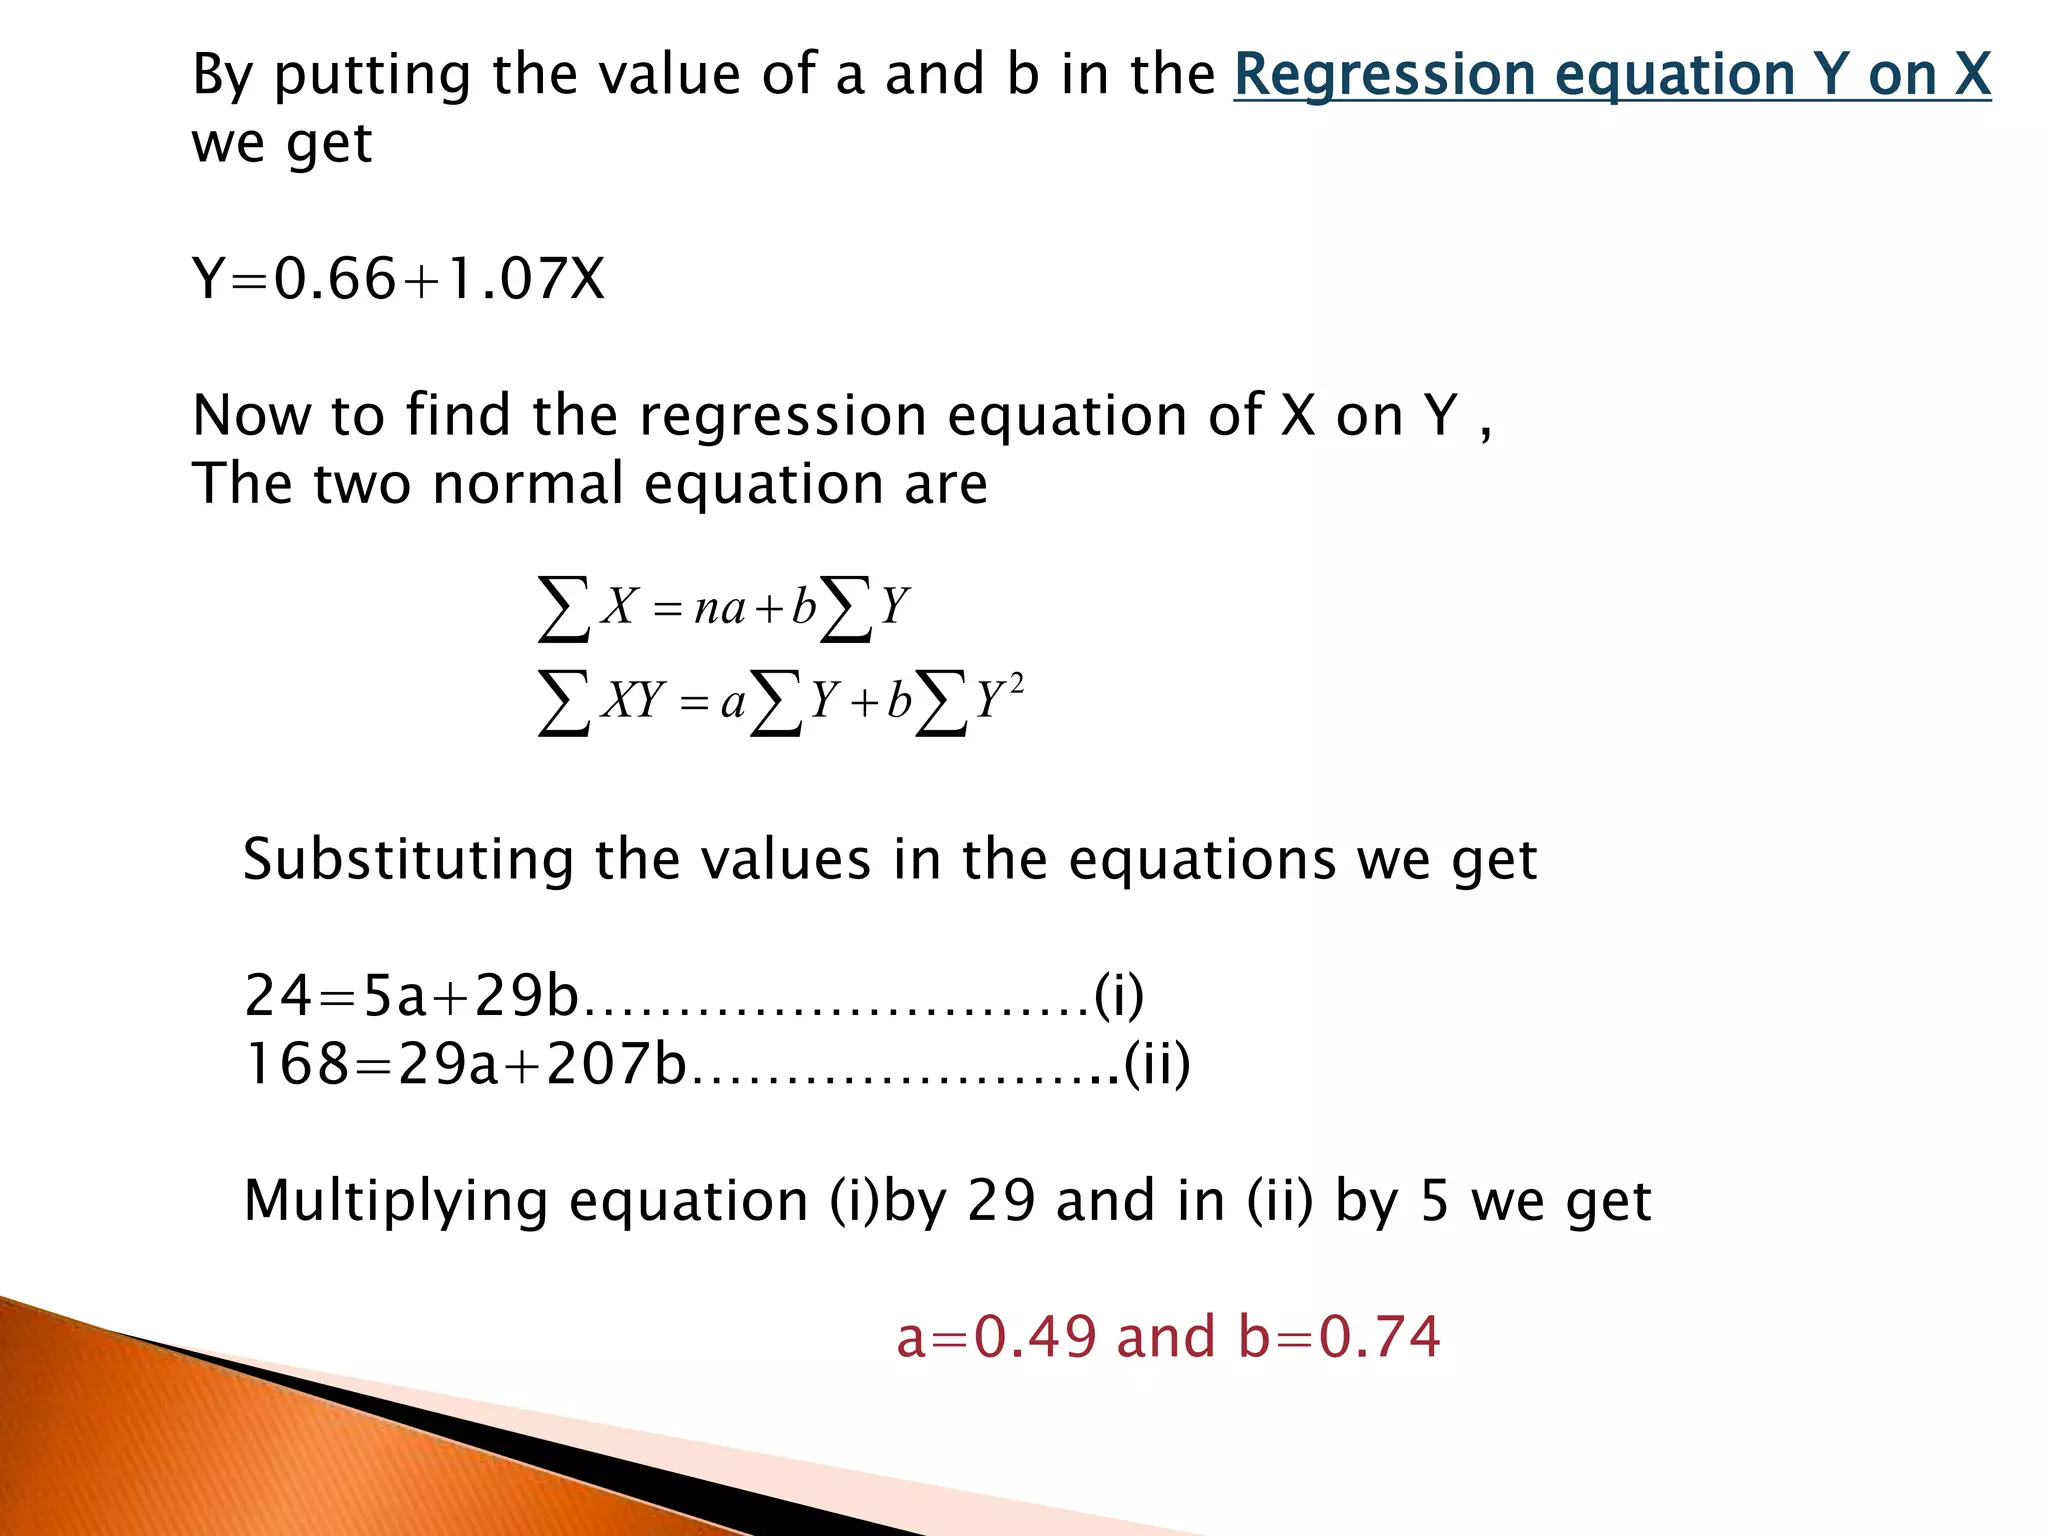
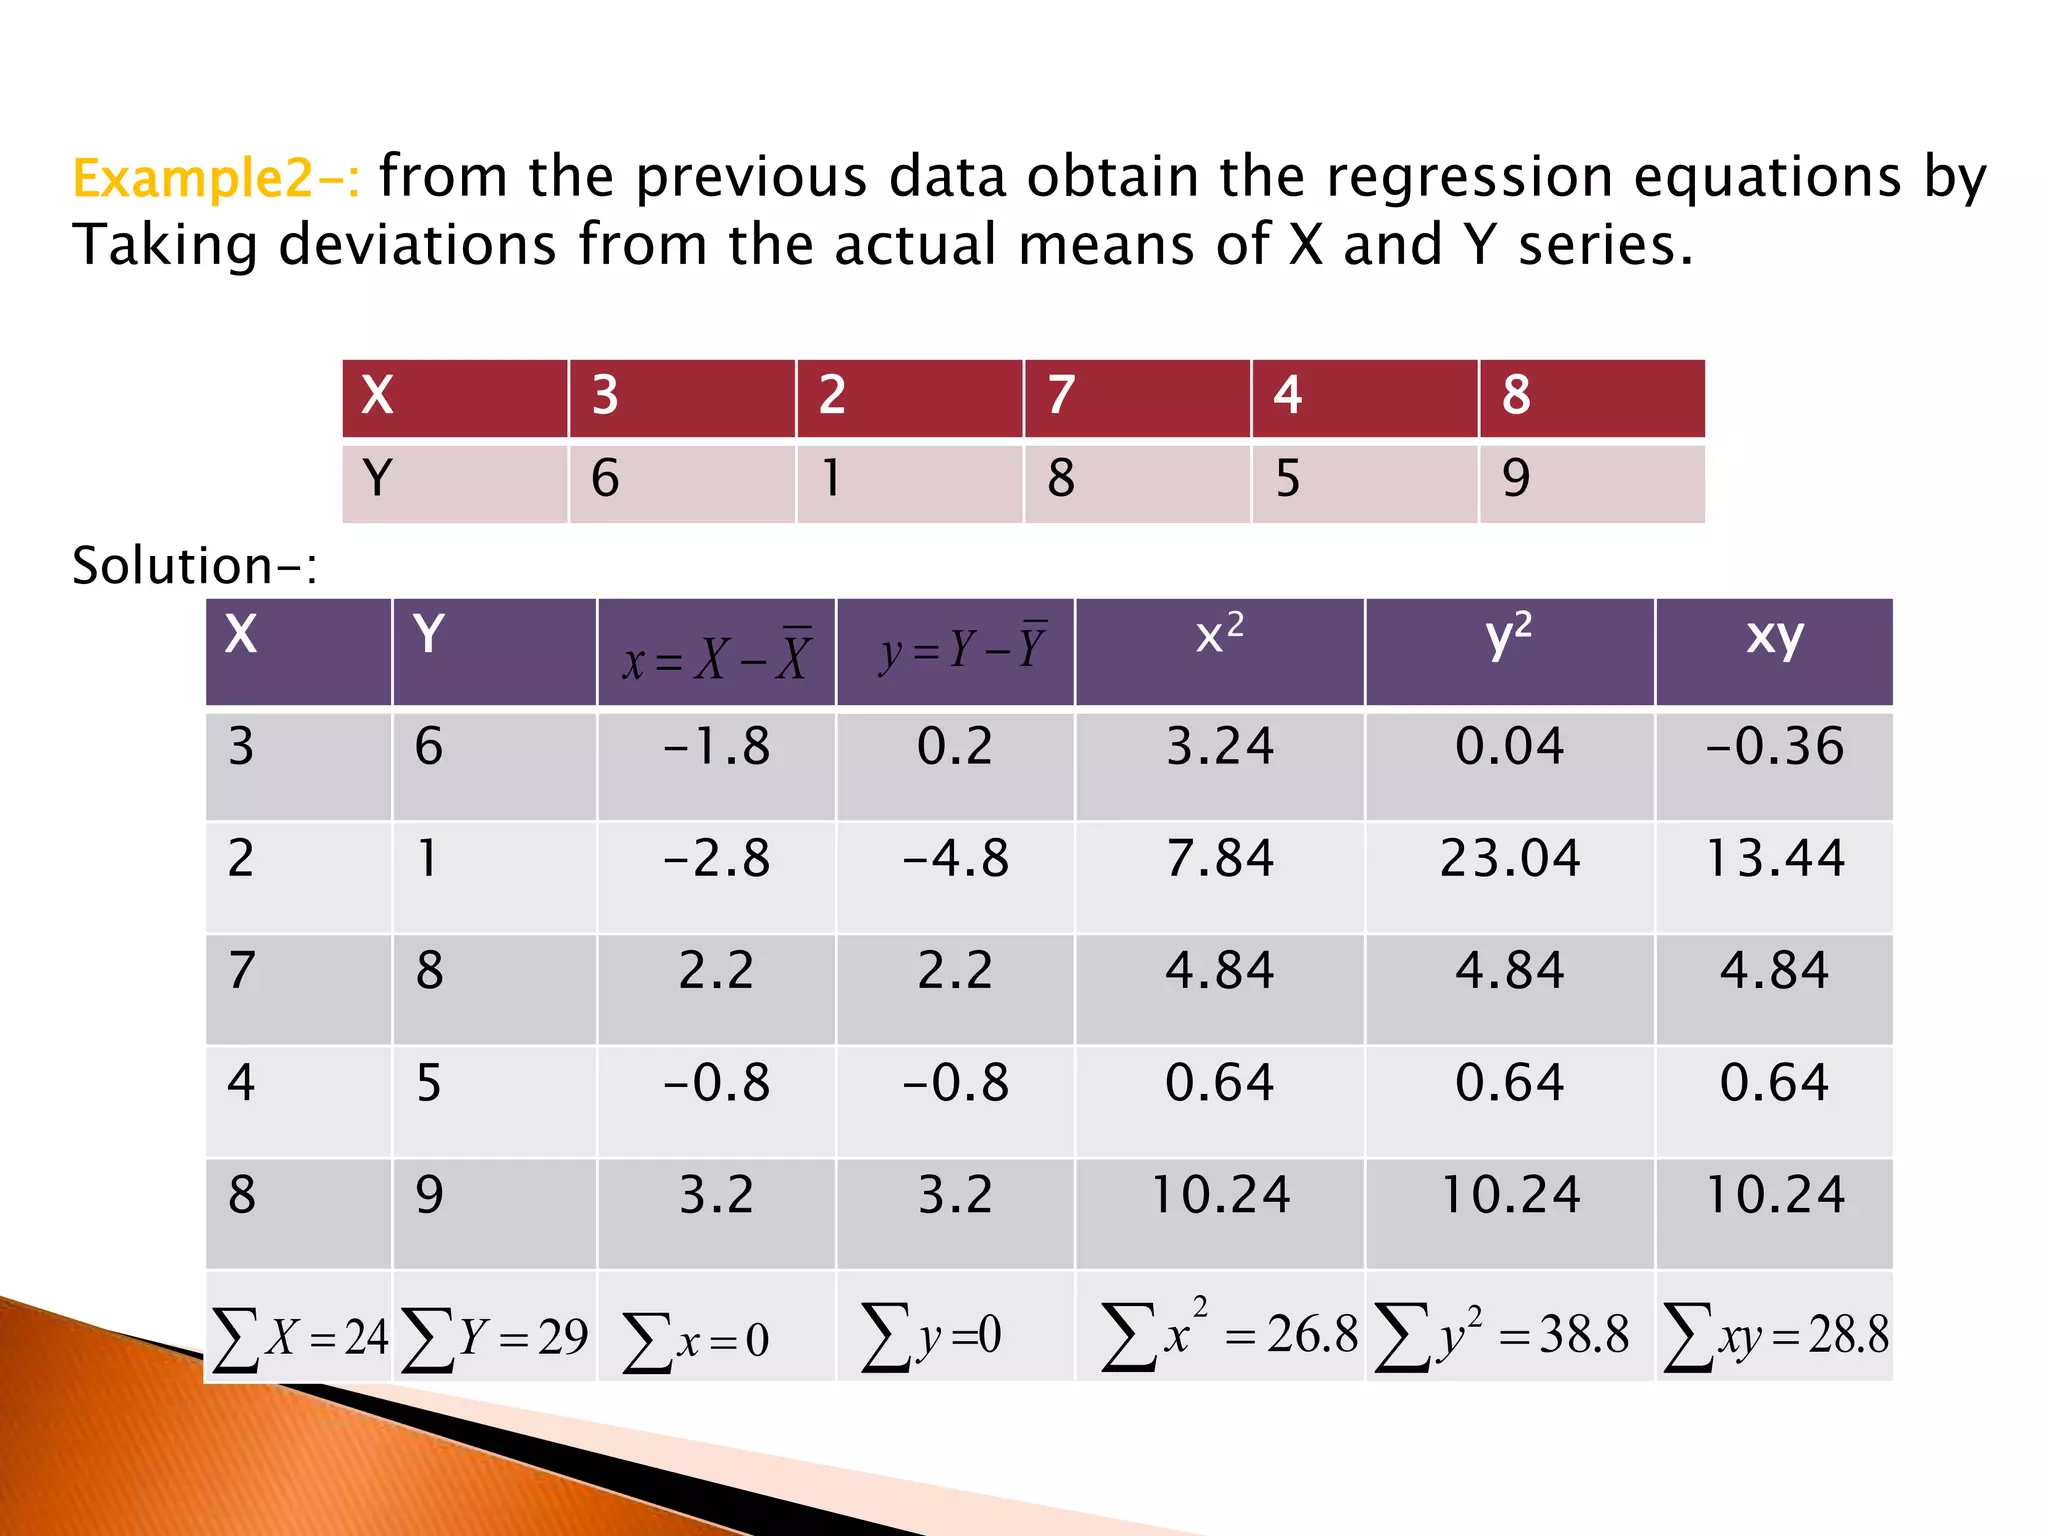
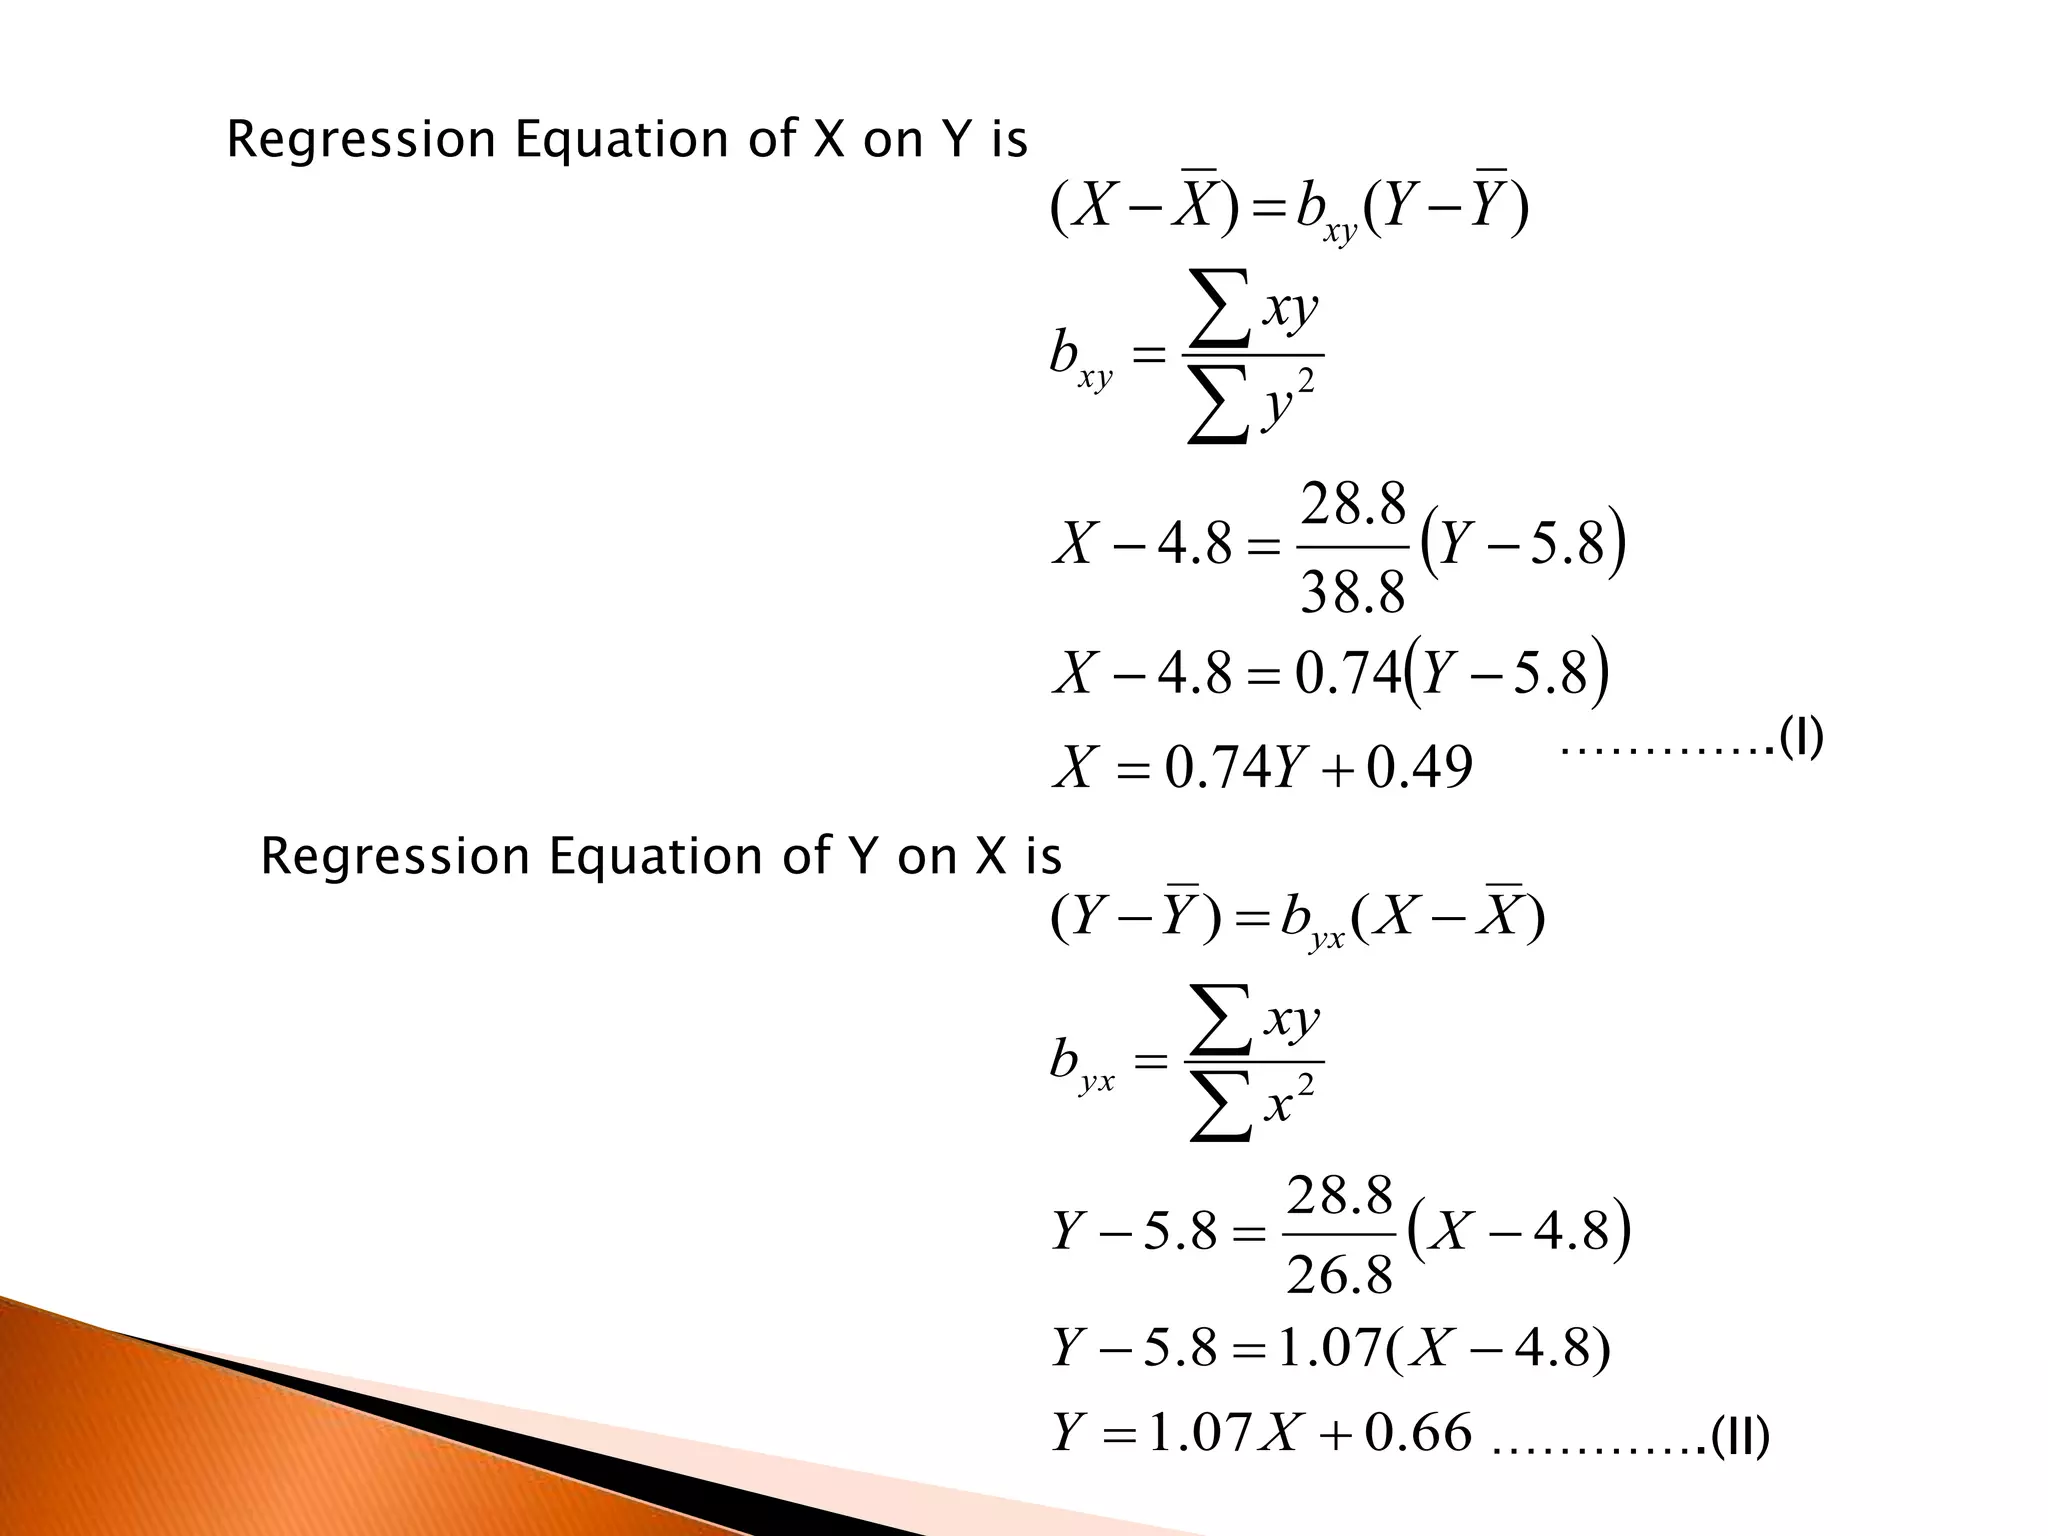
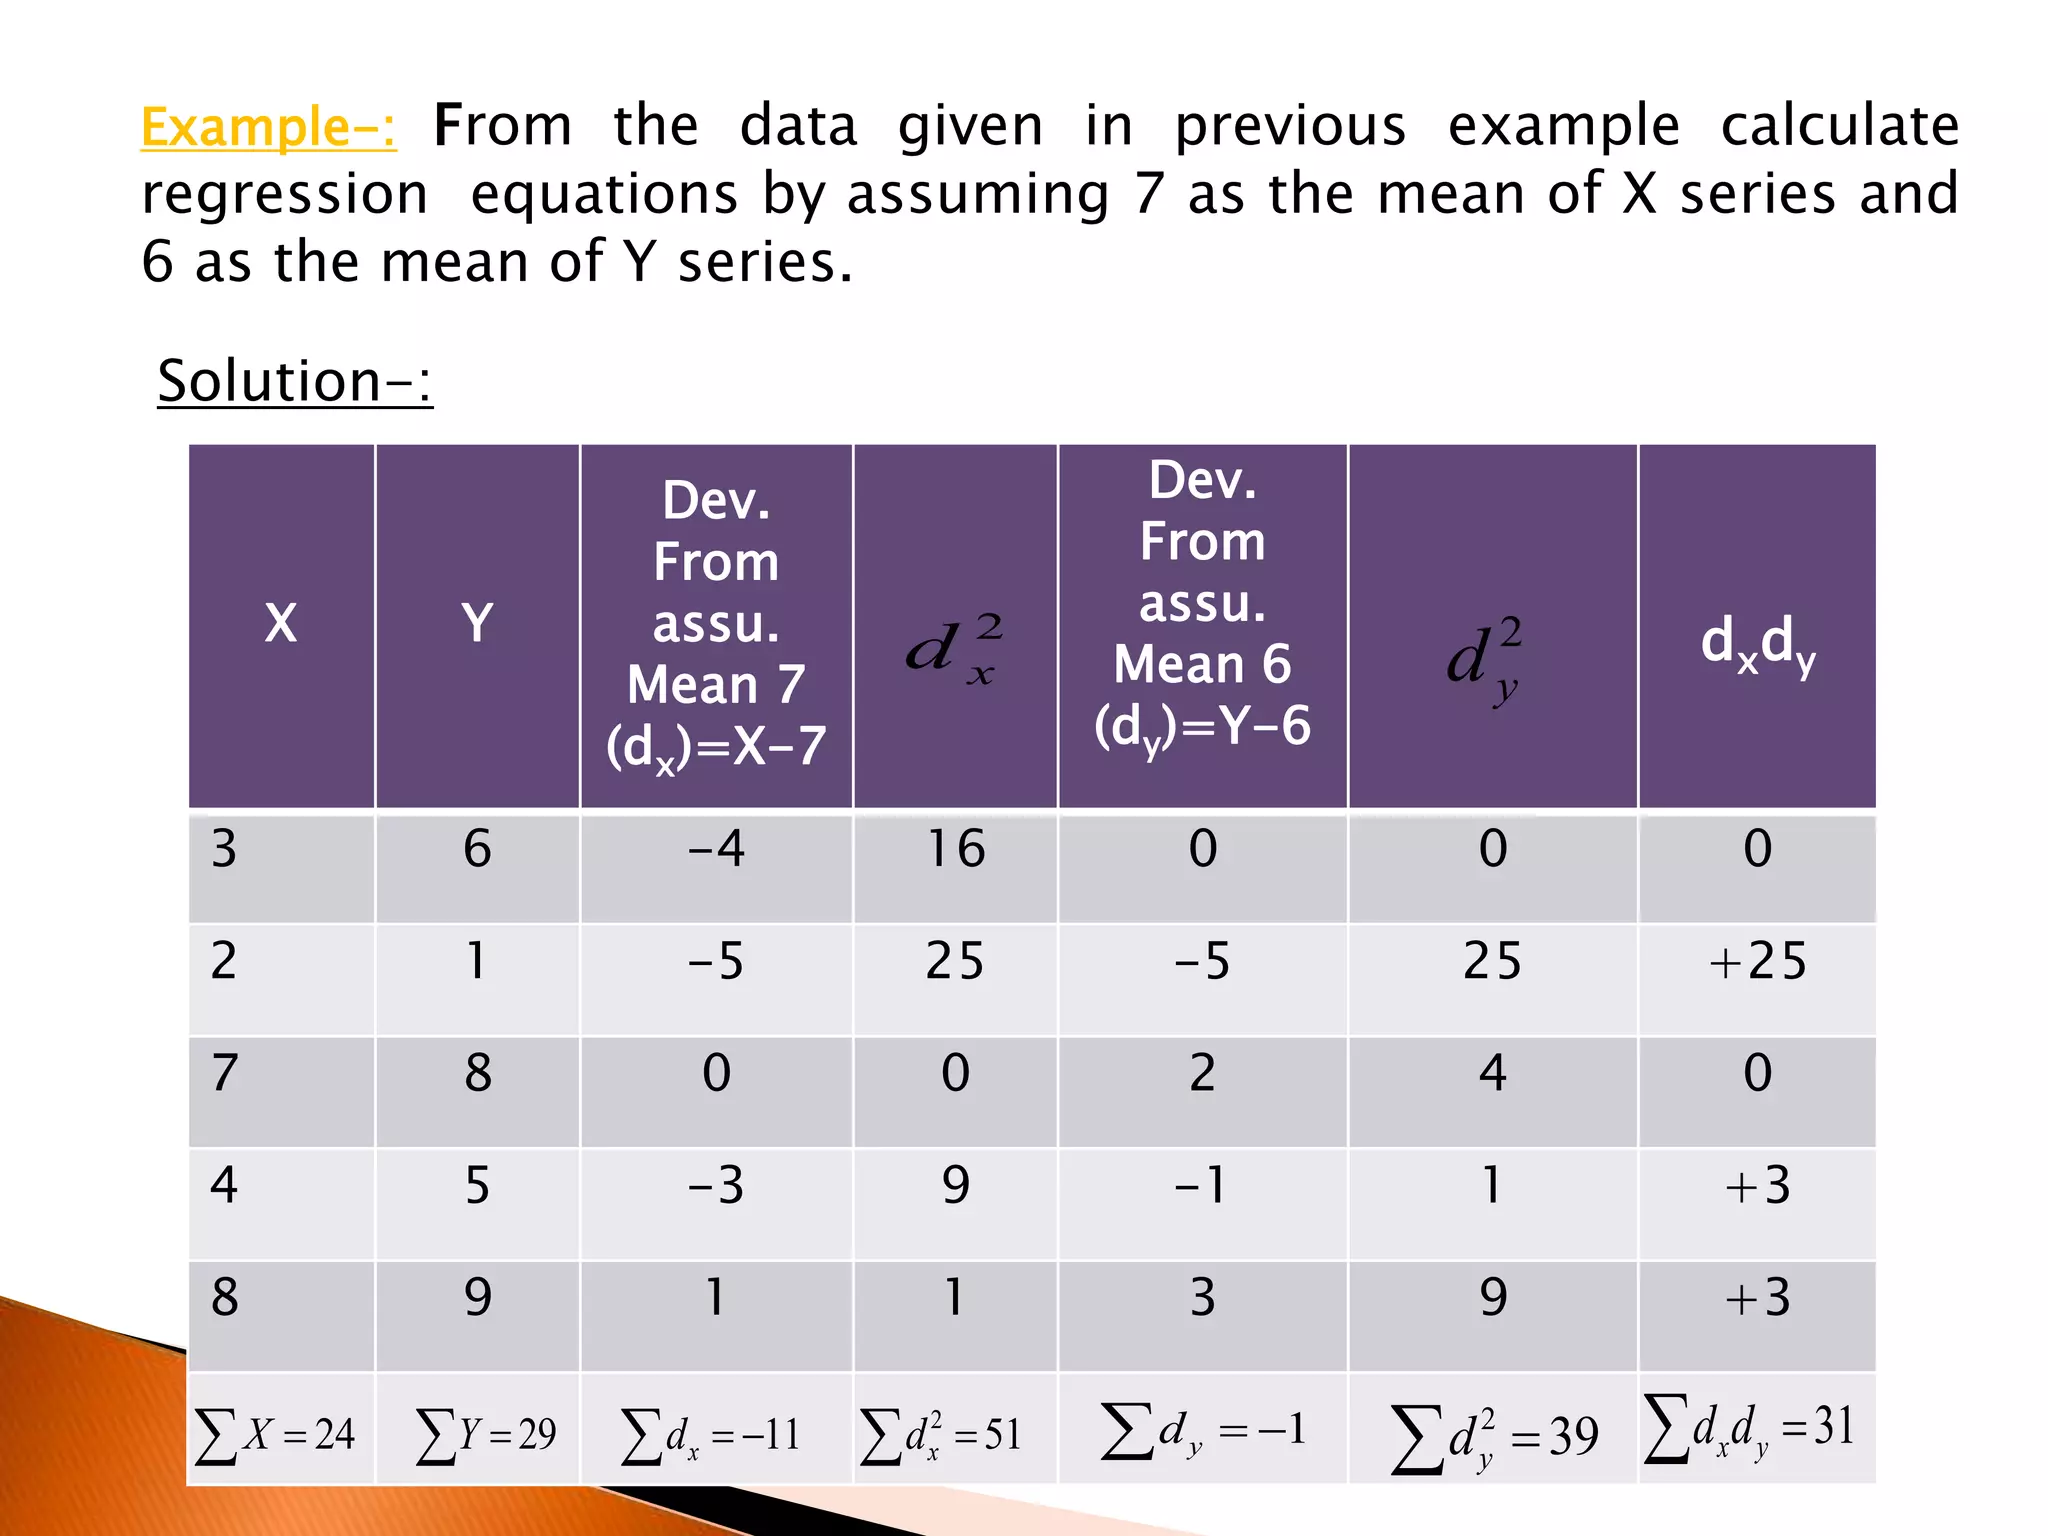
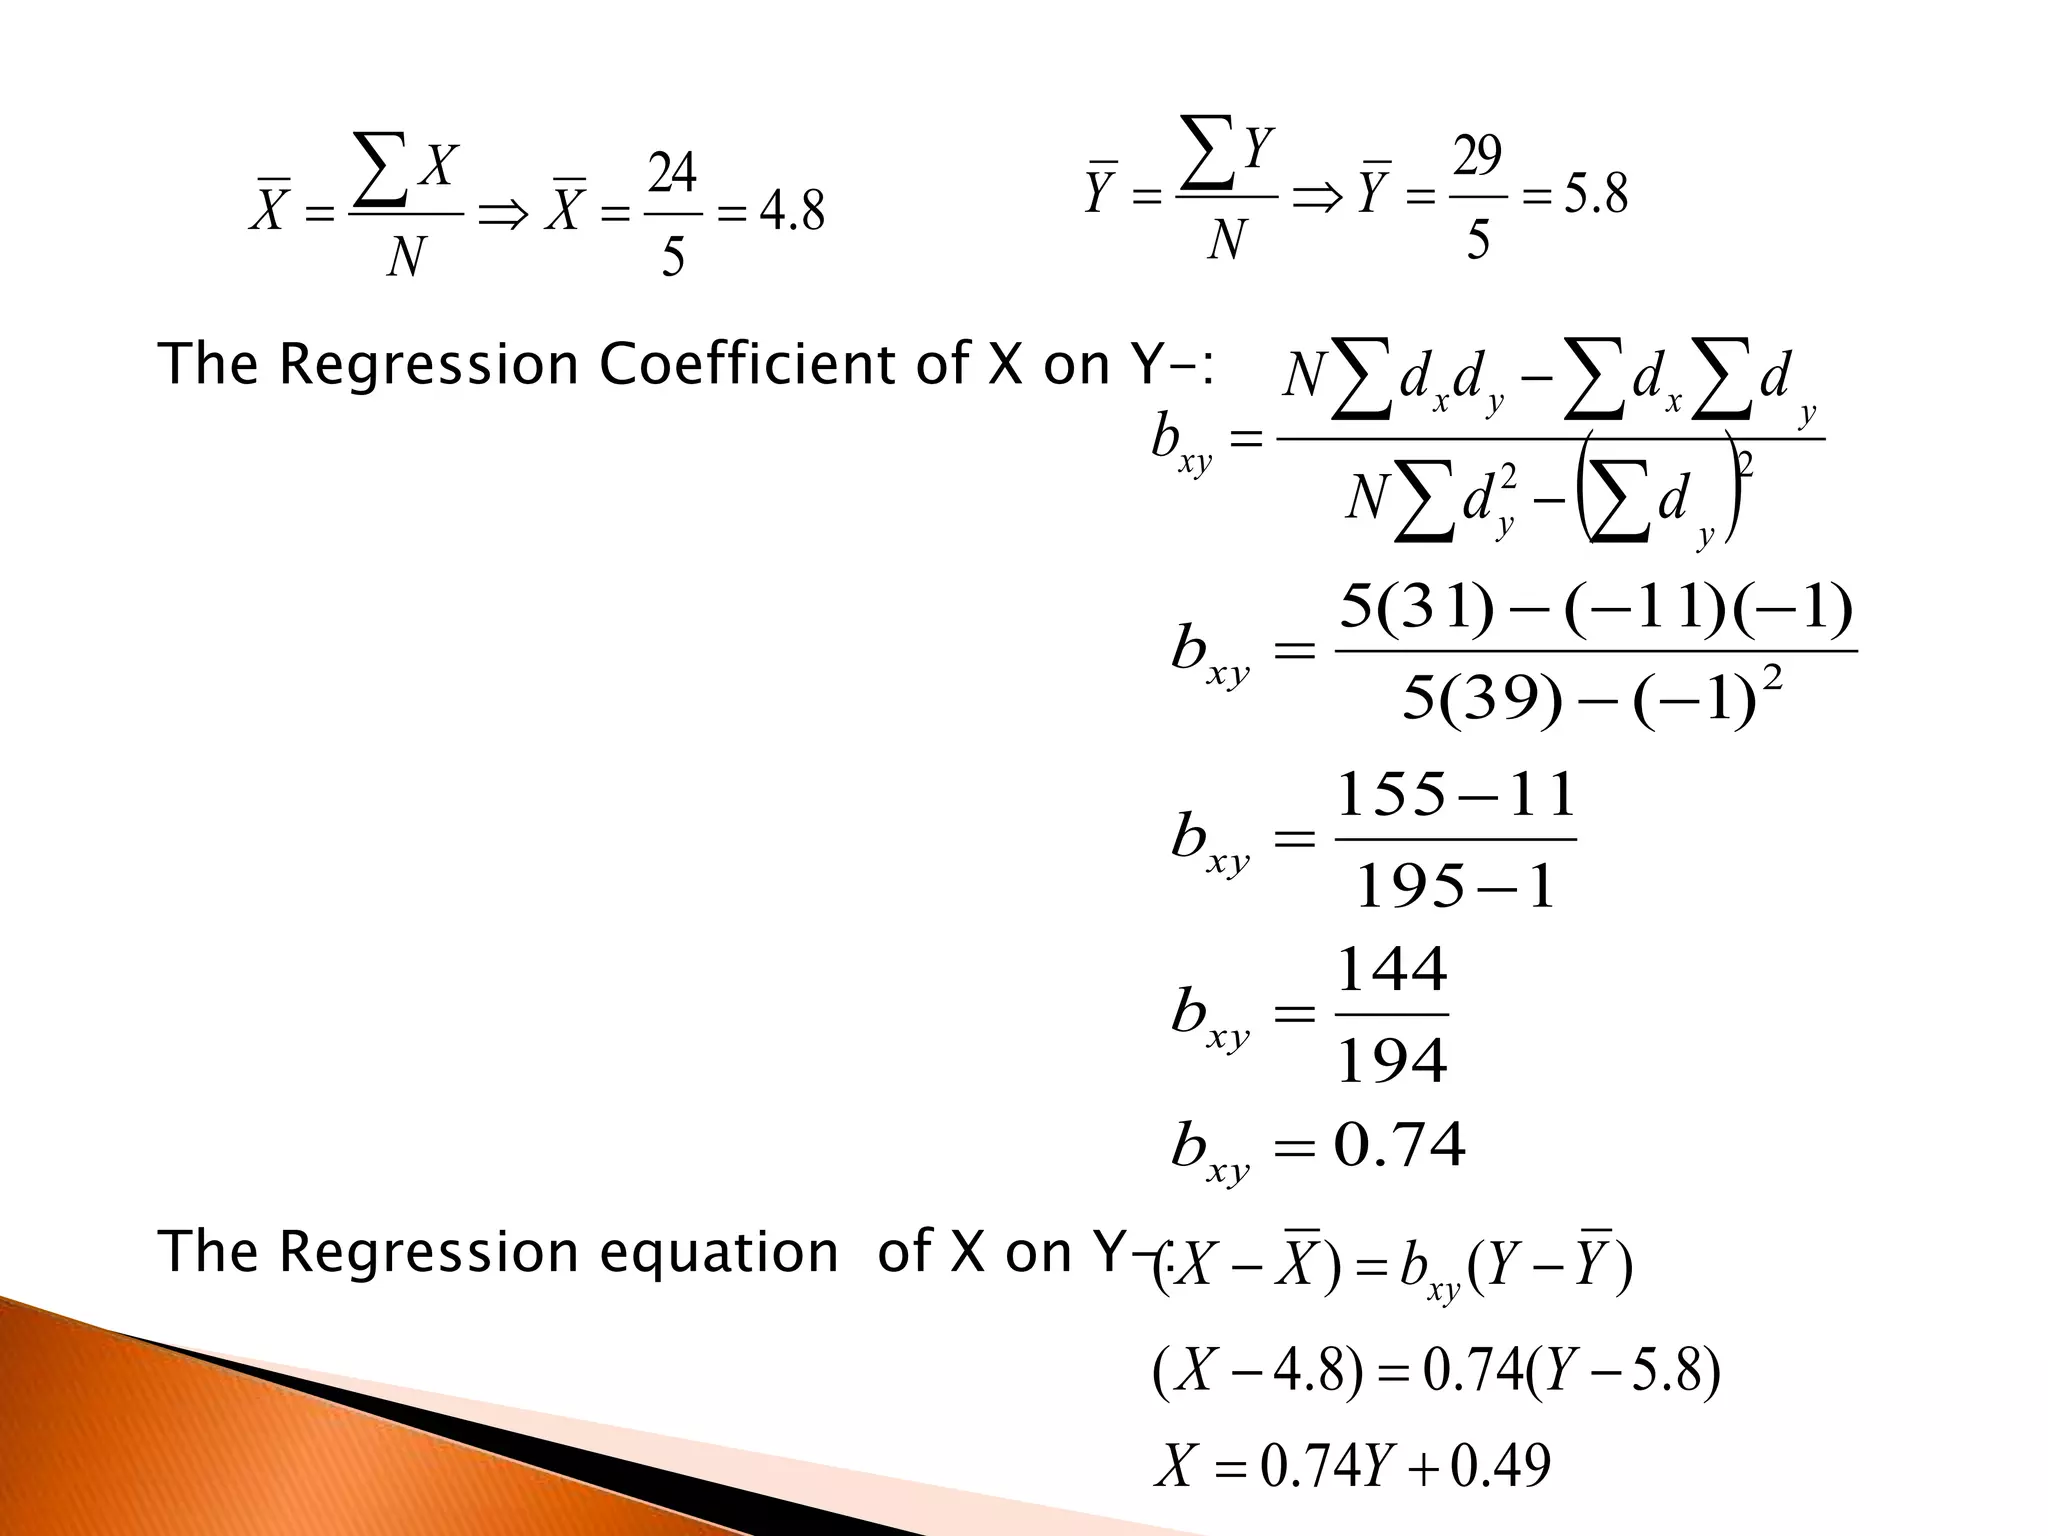
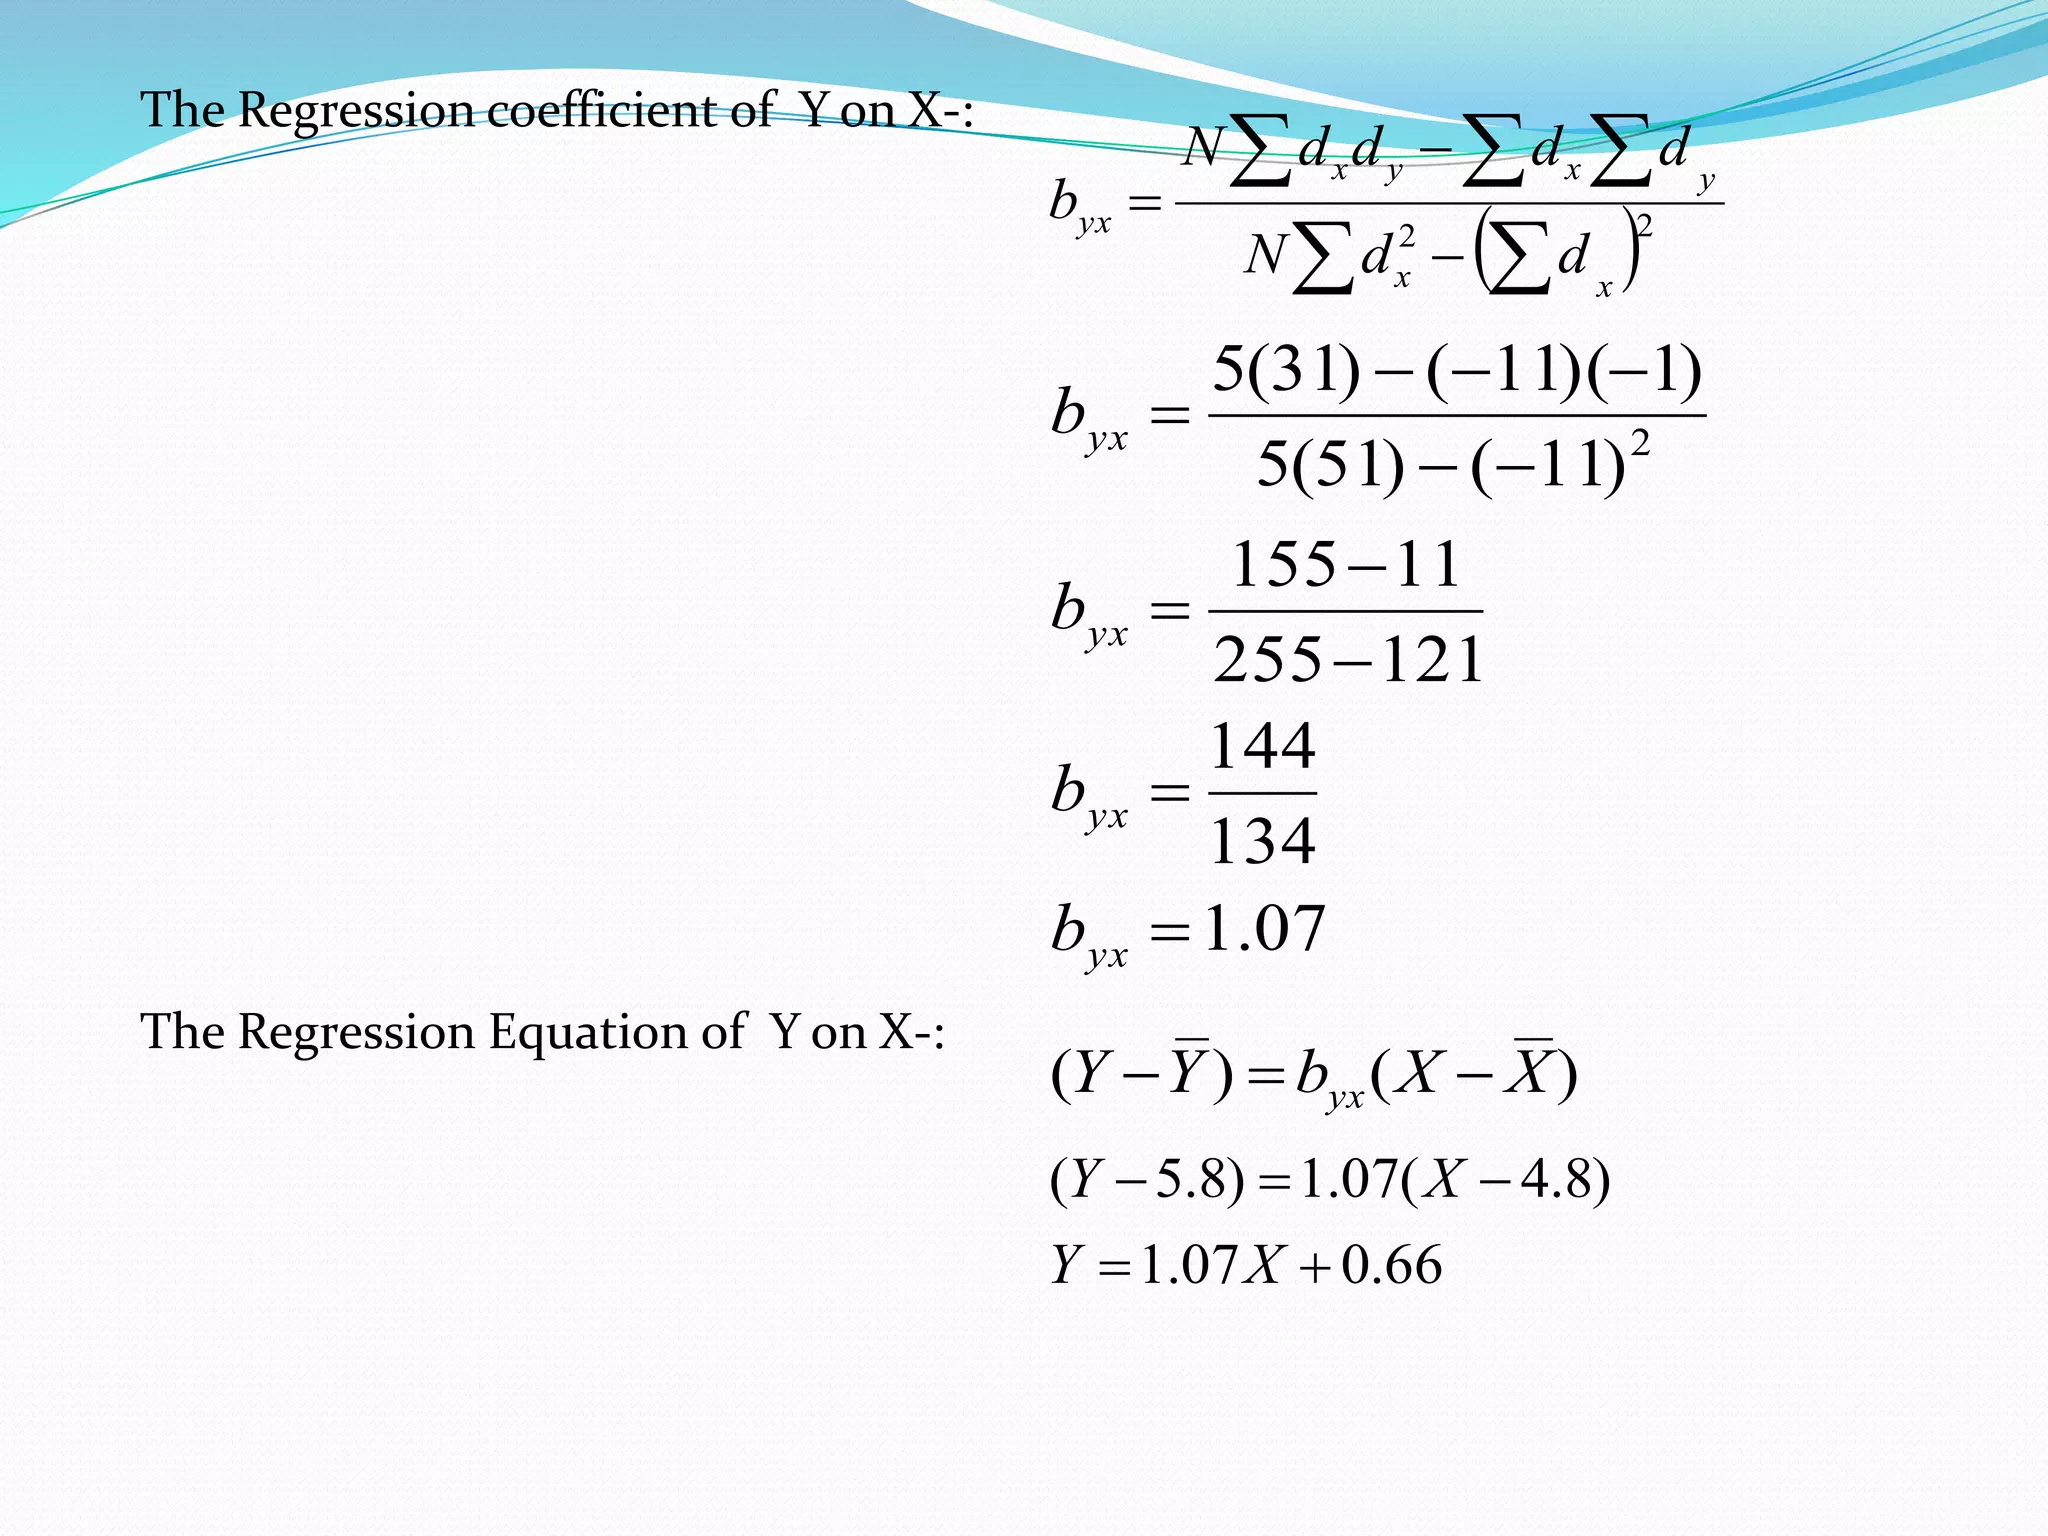
- An example calculating regression equations using data on students' grades and scores through least squares and deviations from means.
- Conclusion that the regression equations match those obtained through other common methods.


![Blanca[1]](https://cdn.slidesharecdn.com/ss_thumbnails/blanca1-101027221816-phpapp01-thumbnail.jpg?width=640&height=640&fit=bounds)