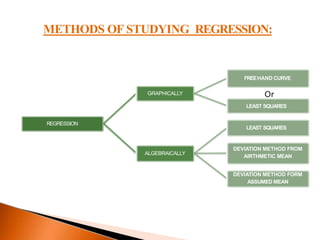
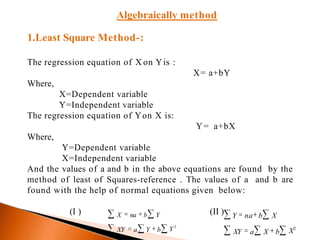
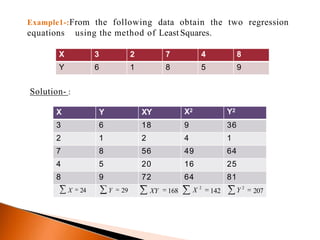
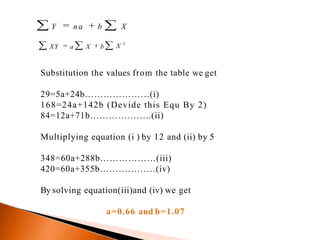
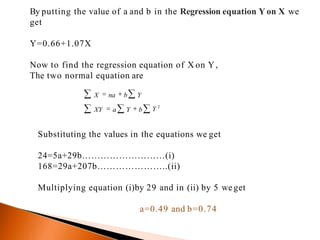
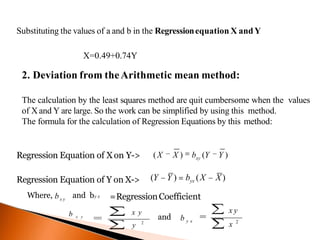
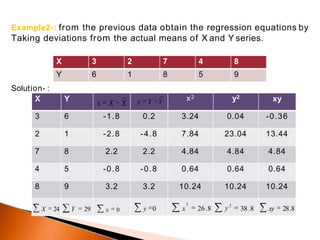
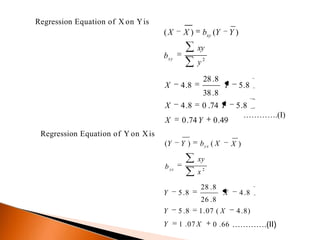
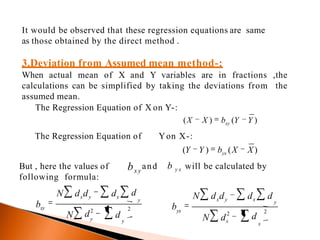
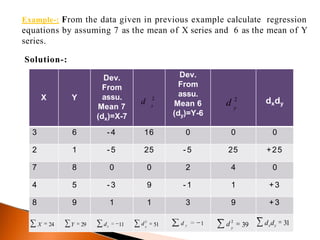
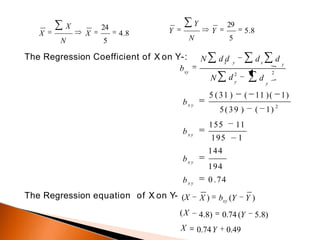
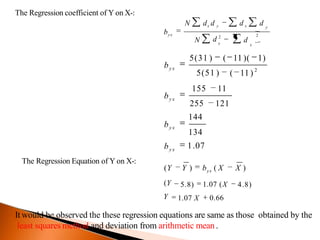
SlideShare a Scribd company logo
REGRESSION ANALYSIS
Presented By
Muhammad Faisal
Roll No:Fa-18/BSSE/079
Sec: B
MEANING OF REGRESSION
The dictionary meaning of the word Regression is ‘Stepping
back’ or ‘Going back’. Regression is the measures of the average
relationship between two or more variables in terms of the
original units of the data. And it is also attempts to establish the
nature of the relationship between variables that is to study the
functional relationship between the variables and thereby provide
a mechanism for prediction, or forecasting.
Importance of Regression Analysis
Regression analysis helps in three important ways :-
• It provides estimate of values of dependent
variables from values of independent variables.
• It can be extended to 2or more variables, which is
known as multiple regression.
• It shows the nature of relationship between two or
more variable.
USE IN ORGANIZATION:
In the field of business regression is widely used.
Businessman are interested in predicting future
production, consumption, investment, prices, pro
fits, sales etc. So the success of a businessman
depends on the correctness of the various
estimates that he is required to make. It is also use
in sociological study and economic planning to
find the projections of population, birth rates.
death rates etc.
METHODS OF STUDYING REGRESSION:
REGRESSION
GRAPHICALLY
ALGEBRAICALLY
LEAST SQUARES
DEVIATION METHOD FROM
AIRTHMETIC MEAN
DEVIATION METHOD FORM
ASSUMED MEAN
FREEHAND CURVE
Or
LEAST SQUARES
Algebraically method
1.Least Square Method-:
The regression equation of X on Yis :
X= a+bY
Where,
X=Dependent variable
Y=Independent variable
The regression equation of Yon X is:
Y= a+bX
Where,
Y=Dependent variable
X=Independent variable
And the values of a and b in the above equations are found by the
method of least of Squares-reference . The values of a and b are
found with the help of normal equations given below:
(I ) (II )
X2
Y na b X
XY a X bY 2
XY a Y b
X na b Y
Example1-:From the following data obtain the two regression
equations using the method of Least Squares.
X 3 2 7 4 8
Y 6 1 8 5 9
Solution- :
X Y XY X2 Y2
3 6 18 9 36
2 1 2 4 1
7 8 56 49 64
4 5 20 16 25
8 9 72 64 81
X 24 Y 29 XY 168 X 2
142 Y 2
207
XY n a b
X 2
XY a X b
Substitution the values from the table we get
29=5a+24b…………………(i)
168=24a+142b (Devide this Equ By 2)
84=12a+71b………………..(ii)
Multiplying equation (i ) by 12 and (ii) by 5
348=60a+288b………………(iii)
420=60a+355b………………(iv)
By solving equation(iii)and (iv) we get
a=0.66 and b=1.07
By putting the value of a and b in the Regression equation Y on X we
get
Y=0.66+1.07X
Now to find the regression equation of X on Y,
The two normal equation are
X na b Y
Y 2
XY a Y b
Substituting the values in the equations we get
24=5a+29b………………………(i)
168=29a+207b…………………..(ii)
Multiplying equation (i)by 29 and in (ii) by 5 weget
a=0.49 and b=0.74
Substituting the values of a and b in the Regressionequation X andY
X=0.49+0.74Y
2. Deviation from theArithmetic mean method:
The calculation by the least squares method are quit cumbersome when the values
of Xand Y are large. So the work can be simplified by using this method.
The formula for the calculation of Regression Equations by this method:
(X X ) bxy (Y Y )Regression Equation of Xon Y->
Regression Equation of Y on X->
y 2
x y
x 2
x y
b y x
and
Where, bx y
and by x
b x y
(Y Y ) byx (X X)
=RegressionCoefficient
Example2-: from the previous data obtain the regression equations by
Taking deviations from the actual means of X and Y series.
X 3 2 7 4 8
Y 6 1 8 5 9
X Y
x X X y Y Y x2 y2 xy
3 6 -1.8 0.2 3.24 0.04 -0.36
2 1 -2.8 -4.8 7.84 23.04 13.44
7 8 2.2 2.2 4.84 4.84 4.84
4 5 -0.8 -0.8 0.64 0.64 0.64
8 9 3.2 3.2 10.24 10.24 10.24
X 24 Y 29 x 0 y 0 x
2
26.8 y2
38.8 xy 28.8
Solution- :
Regression Equation of X on Yis
38.8
28.8
y2
Y 5.8X 4.8
xy
bxy
26 .8
28 .8
x 2
X
X
4.8 0 .74 Y
0.74 Y 0.49
5.8
………….(I)
Regression Equation of Y on Xis
(Y Y ) byx ( X X )
byx
xy
1 .07 X
Y 5 .8 1.07 ( X 4.8)
Y
X 4.8
0 .66 ………….(II)
Y 5.8
(X X ) bxy (Y Y )
It would be observed that these regression equations are same
as those obtained by the direct method .
3.Deviation from Assumed mean method-:
When actual mean of X and Y variables are in fractions ,the
calculations can be simplified by taking the deviations from the
assumed mean.
2
yy
dd2
N
bxy
22
y
yx
d
x
N dx
N dxdy dx d
b
But , here the values of
following formula:
N dxdy dx
bx y
and b y x will be calculated by
d
y
The Regression Equation of X on Y-:
(X X ) bxy (Y Y )
The Regression Equation of Yon X-:
(Y Y ) byx (X X)
Example-: From the data given in previous example calculate regression
equations by assuming 7 as the mean of X series and 6 as the mean of Y
series.
Solution-:
X Y
Dev.
From
assu.
Mean 7
(dx)=X-7
d 2
x
Dev.
From
assu.
Mean 6
(dy)=Y-6
d 2
y
dxdy
3 6 - 4 16 0 0 0
2 1 - 5 25 - 5 25 +25
7 8 0 0 2 4 0
4 5 - 3 9 - 1 1 +3
8 9 1 1 3 9 +3
X 24 Y 29 dx 11 d2
x 51 d y 1 d 2
y
39 dxdy 31
The Regression Coefficient of X on Y-:
2
yy
yxx y
xy
dd 2
N
d dN d d
b
194
0 .74
11 )( 1)5 (31 ) (
5(39 )
155 11
195 1
144
( 1) 2
bx y
bx y
bx y
5.8
5
29
Y
N
Y
Y
bx y
The Regression equation of X on Y- (X
(X
X
X ) bxy (Y Y )
4.8) 0.74 (Y 5.8)
0.74Y 0.49
24
N 5
X
X X 4.8
The Regression coefficient of Y on X-:
2
xx
dd 2
N
d x d y
N dx d y
byx
134
1.07
11 )( 1)5(31 ) (
5(51 )
155 11
255 121
144
( 11) 2
by x
by x
by x
by x
The Regression Equation of Y on X-:
4.8)5.8)
1.07 X
(Y Y ) byx ( X X )
1.07 (X
0.66
(Y
Y
It would be observed the these regression equations are same as those obtained by the
least squares method and deviation from arithmetic mean .
Regression analysis presentation

More Related Content

What's hot

Correlation and regression analysis
Correlation and regression analysisCorrelation and regression analysis
Correlation and regression analysis
_pem
 
Univariate analysis:Medical statistics Part IV
Univariate analysis:Medical statistics Part IVUnivariate analysis:Medical statistics Part IV
Univariate analysis:Medical statistics Part IV
Ramachandra Barik
 
COVARIANCE IN PROBABILITY
COVARIANCE IN PROBABILITYCOVARIANCE IN PROBABILITY
COVARIANCE IN PROBABILITY
MOHD BILAL NAIM SHAIKH
 
Regression
Regression Regression
Regression
Ali Raza
 
Species concept
Species conceptSpecies concept
Species concept
Madhusudan Patra
 
Degree of freedom
Degree of freedomDegree of freedom
Degree of freedom
StepUp Analytics
 
Chi square test final
Chi square test finalChi square test final
Chi square test final
Har Jindal
 
Skewness and kurtosis ppt
Skewness and kurtosis pptSkewness and kurtosis ppt
Skewness and kurtosis ppt
Drishti Rajput
 
Simple Linier Regression
Simple Linier RegressionSimple Linier Regression
Simple Linier Regressiondessybudiyanti
 
Regression analysis and its type
Regression analysis and its typeRegression analysis and its type
Regression analysis and its type
Ekta Bafna
 
1.1-1.2 Descriptive and Inferential Statistics
1.1-1.2 Descriptive and Inferential Statistics1.1-1.2 Descriptive and Inferential Statistics
1.1-1.2 Descriptive and Inferential Statistics
mlong24
 
Definition of dispersion
Definition of dispersionDefinition of dispersion
Definition of dispersion
Shah Alam Asim
 
Correlation
CorrelationCorrelation
CorrelationTech_MX
 
Iczn(The International Commission on Zoological Nomenclature )
Iczn(The International Commission on Zoological Nomenclature )Iczn(The International Commission on Zoological Nomenclature )
Iczn(The International Commission on Zoological Nomenclature )
Al Nahian Avro
 
Rank correlation
Rank correlationRank correlation
Rank correlation
Nadeem Uddin
 
Skewness and kurtosis
Skewness and kurtosisSkewness and kurtosis
Skewness and kurtosis
KalimaniH
 

What's hot (20)

Correlation and regression analysis
Correlation and regression analysisCorrelation and regression analysis
Correlation and regression analysis
 
Univariate analysis:Medical statistics Part IV
Univariate analysis:Medical statistics Part IVUnivariate analysis:Medical statistics Part IV
Univariate analysis:Medical statistics Part IV
 
Probability concept and Probability distribution
Probability concept and Probability distributionProbability concept and Probability distribution
Probability concept and Probability distribution
 
COVARIANCE IN PROBABILITY
COVARIANCE IN PROBABILITYCOVARIANCE IN PROBABILITY
COVARIANCE IN PROBABILITY
 
Regression
Regression Regression
Regression
 
Species concept
Species conceptSpecies concept
Species concept
 
Degree of freedom
Degree of freedomDegree of freedom
Degree of freedom
 
Chi square test final
Chi square test finalChi square test final
Chi square test final
 
Skewness and kurtosis ppt
Skewness and kurtosis pptSkewness and kurtosis ppt
Skewness and kurtosis ppt
 
Regression
RegressionRegression
Regression
 
Simple Linier Regression
Simple Linier RegressionSimple Linier Regression
Simple Linier Regression
 
Regression analysis and its type
Regression analysis and its typeRegression analysis and its type
Regression analysis and its type
 
1.1-1.2 Descriptive and Inferential Statistics
1.1-1.2 Descriptive and Inferential Statistics1.1-1.2 Descriptive and Inferential Statistics
1.1-1.2 Descriptive and Inferential Statistics
 
Definition of dispersion
Definition of dispersionDefinition of dispersion
Definition of dispersion
 
Correlation
CorrelationCorrelation
Correlation
 
Iczn(The International Commission on Zoological Nomenclature )
Iczn(The International Commission on Zoological Nomenclature )Iczn(The International Commission on Zoological Nomenclature )
Iczn(The International Commission on Zoological Nomenclature )
 
Rank correlation
Rank correlationRank correlation
Rank correlation
 
Regression
RegressionRegression
Regression
 
Skewness and kurtosis
Skewness and kurtosisSkewness and kurtosis
Skewness and kurtosis
 
Analysis of variance anova
Analysis of variance anovaAnalysis of variance anova
Analysis of variance anova
 

Similar to Regression analysis presentation

Regression Ayalysis (2).ppt
Regression Ayalysis (2).pptRegression Ayalysis (2).ppt
Regression Ayalysis (2).ppt
DeepThinker15
 
Regression Analysis
Regression AnalysisRegression Analysis
Regression Analysis
Muhammad Fazeel
 
Regression analysis by Muthama JM
Regression analysis by Muthama JMRegression analysis by Muthama JM
Regression analysis by Muthama JM
Japheth Muthama
 
Regression Analysis by Muthama JM
Regression Analysis by Muthama JM Regression Analysis by Muthama JM
Regression Analysis by Muthama JM
Japheth Muthama
 
Presentation on Regression Analysis
Presentation on Regression AnalysisPresentation on Regression Analysis
Presentation on Regression Analysis
Rekha Rani
 
Econometrics homework help
Econometrics homework helpEconometrics homework help
Econometrics homework help
Mark Austin
 
Regression
RegressionRegression
Regression
LavanyaK75
 
Chapter13
Chapter13Chapter13
Chapter13
Richard Ferreria
 
Regression
RegressionRegression
Regression
sumanmathews
 
Correlation by Neeraj Bhandari ( Surkhet.Nepal )
Correlation by Neeraj Bhandari ( Surkhet.Nepal )Correlation by Neeraj Bhandari ( Surkhet.Nepal )
Correlation by Neeraj Bhandari ( Surkhet.Nepal )Neeraj Bhandari
 
Regression
RegressionRegression
Biostats coorelation vs rREGRESSION.DIFFERENCE BETWEEN CORRELATION AND REGRES...
Biostats coorelation vs rREGRESSION.DIFFERENCE BETWEEN CORRELATION AND REGRES...Biostats coorelation vs rREGRESSION.DIFFERENCE BETWEEN CORRELATION AND REGRES...
Biostats coorelation vs rREGRESSION.DIFFERENCE BETWEEN CORRELATION AND REGRES...
Payaamvohra1
 
Regression analysis
Regression analysisRegression analysis
Regression analysis
Manthan Chavda
 
Econometrics assignment help
Econometrics assignment helpEconometrics assignment help
Econometrics assignment help
Mark Austin
 
Simple linear regression
Simple linear regressionSimple linear regression
Simple linear regression
Maria Theresa
 
Linear regression
Linear regressionLinear regression
Linear regression
Karishma Chaudhary
 
Simple linear regression
Simple linear regressionSimple linear regression
Simple linear regressionMaria Theresa
 
Correlation & regression
Correlation & regression Correlation & regression
Correlation & regression
Unitedworld School Of Business
 
Linear Regression Ordinary Least Squares Distributed Calculation Example
Linear Regression Ordinary Least Squares Distributed Calculation ExampleLinear Regression Ordinary Least Squares Distributed Calculation Example
Linear Regression Ordinary Least Squares Distributed Calculation Example
Marjan Sterjev
 

Similar to Regression analysis presentation (20)

Regression Ayalysis (2).ppt
Regression Ayalysis (2).pptRegression Ayalysis (2).ppt
Regression Ayalysis (2).ppt
 
Regression Analysis
Regression AnalysisRegression Analysis
Regression Analysis
 
Regression analysis by Muthama JM
Regression analysis by Muthama JMRegression analysis by Muthama JM
Regression analysis by Muthama JM
 
Regression Analysis by Muthama JM
Regression Analysis by Muthama JM Regression Analysis by Muthama JM
Regression Analysis by Muthama JM
 
Presentation on Regression Analysis
Presentation on Regression AnalysisPresentation on Regression Analysis
Presentation on Regression Analysis
 
Econometrics homework help
Econometrics homework helpEconometrics homework help
Econometrics homework help
 
Regression
RegressionRegression
Regression
 
Chapter13
Chapter13Chapter13
Chapter13
 
Regression
RegressionRegression
Regression
 
Correlation by Neeraj Bhandari ( Surkhet.Nepal )
Correlation by Neeraj Bhandari ( Surkhet.Nepal )Correlation by Neeraj Bhandari ( Surkhet.Nepal )
Correlation by Neeraj Bhandari ( Surkhet.Nepal )
 
Regression
RegressionRegression
Regression
 
Biostats coorelation vs rREGRESSION.DIFFERENCE BETWEEN CORRELATION AND REGRES...
Biostats coorelation vs rREGRESSION.DIFFERENCE BETWEEN CORRELATION AND REGRES...Biostats coorelation vs rREGRESSION.DIFFERENCE BETWEEN CORRELATION AND REGRES...
Biostats coorelation vs rREGRESSION.DIFFERENCE BETWEEN CORRELATION AND REGRES...
 
Regression analysis
Regression analysisRegression analysis
Regression analysis
 
Econometrics assignment help
Econometrics assignment helpEconometrics assignment help
Econometrics assignment help
 
Simple linear regression
Simple linear regressionSimple linear regression
Simple linear regression
 
Linear regression
Linear regressionLinear regression
Linear regression
 
Simple linear regression
Simple linear regressionSimple linear regression
Simple linear regression
 
Correlation & regression uwsb
Correlation & regression   uwsbCorrelation & regression   uwsb
Correlation & regression uwsb
 
Correlation & regression
Correlation & regression Correlation & regression
Correlation & regression
 
Linear Regression Ordinary Least Squares Distributed Calculation Example
Linear Regression Ordinary Least Squares Distributed Calculation ExampleLinear Regression Ordinary Least Squares Distributed Calculation Example
Linear Regression Ordinary Least Squares Distributed Calculation Example
 

Recently uploaded

Azure Interview Questions and Answers PDF By ScholarHat
Azure Interview Questions and Answers PDF By ScholarHatAzure Interview Questions and Answers PDF By ScholarHat
Azure Interview Questions and Answers PDF By ScholarHat
Scholarhat
 
Honest Reviews of Tim Han LMA Course Program.pptx
Honest Reviews of Tim Han LMA Course Program.pptxHonest Reviews of Tim Han LMA Course Program.pptx
Honest Reviews of Tim Han LMA Course Program.pptx
timhan337
 
Chapter -12, Antibiotics (One Page Notes).pdf
Chapter -12, Antibiotics (One Page Notes).pdfChapter -12, Antibiotics (One Page Notes).pdf
Chapter -12, Antibiotics (One Page Notes).pdf
Kartik Tiwari
 
The basics of sentences session 5pptx.pptx
The basics of sentences session 5pptx.pptxThe basics of sentences session 5pptx.pptx
The basics of sentences session 5pptx.pptx
heathfieldcps1
 
Best Digital Marketing Institute In NOIDA
Best Digital Marketing Institute In NOIDABest Digital Marketing Institute In NOIDA
Best Digital Marketing Institute In NOIDA
deeptiverma2406
 
Multithreading_in_C++ - std::thread, race condition
Multithreading_in_C++ - std::thread, race conditionMultithreading_in_C++ - std::thread, race condition
Multithreading_in_C++ - std::thread, race condition
Mohammed Sikander
 
special B.ed 2nd year old paper_20240531.pdf
special B.ed 2nd year old paper_20240531.pdfspecial B.ed 2nd year old paper_20240531.pdf
special B.ed 2nd year old paper_20240531.pdf
Special education needs
 
1.4 modern child centered education - mahatma gandhi-2.pptx
1.4 modern child centered education - mahatma gandhi-2.pptx1.4 modern child centered education - mahatma gandhi-2.pptx
1.4 modern child centered education - mahatma gandhi-2.pptx
JosvitaDsouza2
 
Group Presentation 2 Economics.Ariana Buscigliopptx
Group Presentation 2 Economics.Ariana BuscigliopptxGroup Presentation 2 Economics.Ariana Buscigliopptx
Group Presentation 2 Economics.Ariana Buscigliopptx
ArianaBusciglio
 
A Strategic Approach: GenAI in Education
A Strategic Approach: GenAI in EducationA Strategic Approach: GenAI in Education
A Strategic Approach: GenAI in Education
Peter Windle
 
Home assignment II on Spectroscopy 2024 Answers.pdf
Home assignment II on Spectroscopy 2024 Answers.pdfHome assignment II on Spectroscopy 2024 Answers.pdf
Home assignment II on Spectroscopy 2024 Answers.pdf
Tamralipta Mahavidyalaya
 
CACJapan - GROUP Presentation 1- Wk 4.pdf
CACJapan - GROUP Presentation 1- Wk 4.pdfCACJapan - GROUP Presentation 1- Wk 4.pdf
CACJapan - GROUP Presentation 1- Wk 4.pdf
camakaiclarkmusic
 
Acetabularia Information For Class 9 .docx
Acetabularia Information For Class 9  .docxAcetabularia Information For Class 9  .docx
Acetabularia Information For Class 9 .docx
vaibhavrinwa19
 
Introduction to AI for Nonprofits with Tapp Network
Introduction to AI for Nonprofits with Tapp NetworkIntroduction to AI for Nonprofits with Tapp Network
Introduction to AI for Nonprofits with Tapp Network
TechSoup
 
Supporting (UKRI) OA monographs at Salford.pptx
Supporting (UKRI) OA monographs at Salford.pptxSupporting (UKRI) OA monographs at Salford.pptx
Supporting (UKRI) OA monographs at Salford.pptx
Jisc
 
Digital Tools and AI for Teaching Learning and Research
Digital Tools and AI for Teaching Learning and ResearchDigital Tools and AI for Teaching Learning and Research
Digital Tools and AI for Teaching Learning and Research
Vikramjit Singh
 
Francesca Gottschalk - How can education support child empowerment.pptx
Francesca Gottschalk - How can education support child empowerment.pptxFrancesca Gottschalk - How can education support child empowerment.pptx
Francesca Gottschalk - How can education support child empowerment.pptx
EduSkills OECD
 
Language Across the Curriculm LAC B.Ed.
Language Across the  Curriculm LAC B.Ed.Language Across the  Curriculm LAC B.Ed.
Language Across the Curriculm LAC B.Ed.
Atul Kumar Singh
 
The approach at University of Liverpool.pptx
The approach at University of Liverpool.pptxThe approach at University of Liverpool.pptx
The approach at University of Liverpool.pptx
Jisc
 
"Protectable subject matters, Protection in biotechnology, Protection of othe...
"Protectable subject matters, Protection in biotechnology, Protection of othe..."Protectable subject matters, Protection in biotechnology, Protection of othe...
"Protectable subject matters, Protection in biotechnology, Protection of othe...
SACHIN R KONDAGURI
 

Recently uploaded (20)

Azure Interview Questions and Answers PDF By ScholarHat
Azure Interview Questions and Answers PDF By ScholarHatAzure Interview Questions and Answers PDF By ScholarHat
Azure Interview Questions and Answers PDF By ScholarHat
 
Honest Reviews of Tim Han LMA Course Program.pptx
Honest Reviews of Tim Han LMA Course Program.pptxHonest Reviews of Tim Han LMA Course Program.pptx
Honest Reviews of Tim Han LMA Course Program.pptx
 
Chapter -12, Antibiotics (One Page Notes).pdf
Chapter -12, Antibiotics (One Page Notes).pdfChapter -12, Antibiotics (One Page Notes).pdf
Chapter -12, Antibiotics (One Page Notes).pdf
 
The basics of sentences session 5pptx.pptx
The basics of sentences session 5pptx.pptxThe basics of sentences session 5pptx.pptx
The basics of sentences session 5pptx.pptx
 
Best Digital Marketing Institute In NOIDA
Best Digital Marketing Institute In NOIDABest Digital Marketing Institute In NOIDA
Best Digital Marketing Institute In NOIDA
 
Multithreading_in_C++ - std::thread, race condition
Multithreading_in_C++ - std::thread, race conditionMultithreading_in_C++ - std::thread, race condition
Multithreading_in_C++ - std::thread, race condition
 
special B.ed 2nd year old paper_20240531.pdf
special B.ed 2nd year old paper_20240531.pdfspecial B.ed 2nd year old paper_20240531.pdf
special B.ed 2nd year old paper_20240531.pdf
 
1.4 modern child centered education - mahatma gandhi-2.pptx
1.4 modern child centered education - mahatma gandhi-2.pptx1.4 modern child centered education - mahatma gandhi-2.pptx
1.4 modern child centered education - mahatma gandhi-2.pptx
 
Group Presentation 2 Economics.Ariana Buscigliopptx
Group Presentation 2 Economics.Ariana BuscigliopptxGroup Presentation 2 Economics.Ariana Buscigliopptx
Group Presentation 2 Economics.Ariana Buscigliopptx
 
A Strategic Approach: GenAI in Education
A Strategic Approach: GenAI in EducationA Strategic Approach: GenAI in Education
A Strategic Approach: GenAI in Education
 
Home assignment II on Spectroscopy 2024 Answers.pdf
Home assignment II on Spectroscopy 2024 Answers.pdfHome assignment II on Spectroscopy 2024 Answers.pdf
Home assignment II on Spectroscopy 2024 Answers.pdf
 
CACJapan - GROUP Presentation 1- Wk 4.pdf
CACJapan - GROUP Presentation 1- Wk 4.pdfCACJapan - GROUP Presentation 1- Wk 4.pdf
CACJapan - GROUP Presentation 1- Wk 4.pdf
 
Acetabularia Information For Class 9 .docx
Acetabularia Information For Class 9  .docxAcetabularia Information For Class 9  .docx
Acetabularia Information For Class 9 .docx
 
Introduction to AI for Nonprofits with Tapp Network
Introduction to AI for Nonprofits with Tapp NetworkIntroduction to AI for Nonprofits with Tapp Network
Introduction to AI for Nonprofits with Tapp Network
 
Supporting (UKRI) OA monographs at Salford.pptx
Supporting (UKRI) OA monographs at Salford.pptxSupporting (UKRI) OA monographs at Salford.pptx
Supporting (UKRI) OA monographs at Salford.pptx
 
Digital Tools and AI for Teaching Learning and Research
Digital Tools and AI for Teaching Learning and ResearchDigital Tools and AI for Teaching Learning and Research
Digital Tools and AI for Teaching Learning and Research
 
Francesca Gottschalk - How can education support child empowerment.pptx
Francesca Gottschalk - How can education support child empowerment.pptxFrancesca Gottschalk - How can education support child empowerment.pptx
Francesca Gottschalk - How can education support child empowerment.pptx
 
Language Across the Curriculm LAC B.Ed.
Language Across the  Curriculm LAC B.Ed.Language Across the  Curriculm LAC B.Ed.
Language Across the Curriculm LAC B.Ed.
 
The approach at University of Liverpool.pptx
The approach at University of Liverpool.pptxThe approach at University of Liverpool.pptx
The approach at University of Liverpool.pptx
 
"Protectable subject matters, Protection in biotechnology, Protection of othe...
"Protectable subject matters, Protection in biotechnology, Protection of othe..."Protectable subject matters, Protection in biotechnology, Protection of othe...
"Protectable subject matters, Protection in biotechnology, Protection of othe...
 

Regression analysis presentation

  • 1.
  • 2. REGRESSION ANALYSIS Presented By Muhammad Faisal Roll No:Fa-18/BSSE/079 Sec: B
  • 3. MEANING OF REGRESSION The dictionary meaning of the word Regression is ‘Stepping back’ or ‘Going back’. Regression is the measures of the average relationship between two or more variables in terms of the original units of the data. And it is also attempts to establish the nature of the relationship between variables that is to study the functional relationship between the variables and thereby provide a mechanism for prediction, or forecasting.
  • 4. Importance of Regression Analysis Regression analysis helps in three important ways :- • It provides estimate of values of dependent variables from values of independent variables. • It can be extended to 2or more variables, which is known as multiple regression. • It shows the nature of relationship between two or more variable.
  • 5. USE IN ORGANIZATION: In the field of business regression is widely used. Businessman are interested in predicting future production, consumption, investment, prices, pro fits, sales etc. So the success of a businessman depends on the correctness of the various estimates that he is required to make. It is also use in sociological study and economic planning to find the projections of population, birth rates. death rates etc.
  • 6. METHODS OF STUDYING REGRESSION: REGRESSION GRAPHICALLY ALGEBRAICALLY LEAST SQUARES DEVIATION METHOD FROM AIRTHMETIC MEAN DEVIATION METHOD FORM ASSUMED MEAN FREEHAND CURVE Or LEAST SQUARES
  • 7. Algebraically method 1.Least Square Method-: The regression equation of X on Yis : X= a+bY Where, X=Dependent variable Y=Independent variable The regression equation of Yon X is: Y= a+bX Where, Y=Dependent variable X=Independent variable And the values of a and b in the above equations are found by the method of least of Squares-reference . The values of a and b are found with the help of normal equations given below: (I ) (II ) X2 Y na b X XY a X bY 2 XY a Y b X na b Y
  • 8. Example1-:From the following data obtain the two regression equations using the method of Least Squares. X 3 2 7 4 8 Y 6 1 8 5 9 Solution- : X Y XY X2 Y2 3 6 18 9 36 2 1 2 4 1 7 8 56 49 64 4 5 20 16 25 8 9 72 64 81 X 24 Y 29 XY 168 X 2 142 Y 2 207
  • 9. XY n a b X 2 XY a X b Substitution the values from the table we get 29=5a+24b…………………(i) 168=24a+142b (Devide this Equ By 2) 84=12a+71b………………..(ii) Multiplying equation (i ) by 12 and (ii) by 5 348=60a+288b………………(iii) 420=60a+355b………………(iv) By solving equation(iii)and (iv) we get a=0.66 and b=1.07
  • 10. By putting the value of a and b in the Regression equation Y on X we get Y=0.66+1.07X Now to find the regression equation of X on Y, The two normal equation are X na b Y Y 2 XY a Y b Substituting the values in the equations we get 24=5a+29b………………………(i) 168=29a+207b…………………..(ii) Multiplying equation (i)by 29 and in (ii) by 5 weget a=0.49 and b=0.74
  • 11. Substituting the values of a and b in the Regressionequation X andY X=0.49+0.74Y 2. Deviation from theArithmetic mean method: The calculation by the least squares method are quit cumbersome when the values of Xand Y are large. So the work can be simplified by using this method. The formula for the calculation of Regression Equations by this method: (X X ) bxy (Y Y )Regression Equation of Xon Y-> Regression Equation of Y on X-> y 2 x y x 2 x y b y x and Where, bx y and by x b x y (Y Y ) byx (X X) =RegressionCoefficient
  • 12. Example2-: from the previous data obtain the regression equations by Taking deviations from the actual means of X and Y series. X 3 2 7 4 8 Y 6 1 8 5 9 X Y x X X y Y Y x2 y2 xy 3 6 -1.8 0.2 3.24 0.04 -0.36 2 1 -2.8 -4.8 7.84 23.04 13.44 7 8 2.2 2.2 4.84 4.84 4.84 4 5 -0.8 -0.8 0.64 0.64 0.64 8 9 3.2 3.2 10.24 10.24 10.24 X 24 Y 29 x 0 y 0 x 2 26.8 y2 38.8 xy 28.8 Solution- :
  • 13. Regression Equation of X on Yis 38.8 28.8 y2 Y 5.8X 4.8 xy bxy 26 .8 28 .8 x 2 X X 4.8 0 .74 Y 0.74 Y 0.49 5.8 ………….(I) Regression Equation of Y on Xis (Y Y ) byx ( X X ) byx xy 1 .07 X Y 5 .8 1.07 ( X 4.8) Y X 4.8 0 .66 ………….(II) Y 5.8 (X X ) bxy (Y Y )
  • 14. It would be observed that these regression equations are same as those obtained by the direct method . 3.Deviation from Assumed mean method-: When actual mean of X and Y variables are in fractions ,the calculations can be simplified by taking the deviations from the assumed mean. 2 yy dd2 N bxy 22 y yx d x N dx N dxdy dx d b But , here the values of following formula: N dxdy dx bx y and b y x will be calculated by d y The Regression Equation of X on Y-: (X X ) bxy (Y Y ) The Regression Equation of Yon X-: (Y Y ) byx (X X)
  • 15. Example-: From the data given in previous example calculate regression equations by assuming 7 as the mean of X series and 6 as the mean of Y series. Solution-: X Y Dev. From assu. Mean 7 (dx)=X-7 d 2 x Dev. From assu. Mean 6 (dy)=Y-6 d 2 y dxdy 3 6 - 4 16 0 0 0 2 1 - 5 25 - 5 25 +25 7 8 0 0 2 4 0 4 5 - 3 9 - 1 1 +3 8 9 1 1 3 9 +3 X 24 Y 29 dx 11 d2 x 51 d y 1 d 2 y 39 dxdy 31
  • 16. The Regression Coefficient of X on Y-: 2 yy yxx y xy dd 2 N d dN d d b 194 0 .74 11 )( 1)5 (31 ) ( 5(39 ) 155 11 195 1 144 ( 1) 2 bx y bx y bx y 5.8 5 29 Y N Y Y bx y The Regression equation of X on Y- (X (X X X ) bxy (Y Y ) 4.8) 0.74 (Y 5.8) 0.74Y 0.49 24 N 5 X X X 4.8
  • 17. The Regression coefficient of Y on X-: 2 xx dd 2 N d x d y N dx d y byx 134 1.07 11 )( 1)5(31 ) ( 5(51 ) 155 11 255 121 144 ( 11) 2 by x by x by x by x The Regression Equation of Y on X-: 4.8)5.8) 1.07 X (Y Y ) byx ( X X ) 1.07 (X 0.66 (Y Y It would be observed the these regression equations are same as those obtained by the least squares method and deviation from arithmetic mean .