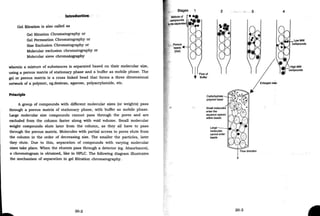
I.
•
•
..
ar
Text book of
•
by
••
• •
•
.
.
- •
·SIS
Dr.S.Ravi Sankar, M.Pharm.,t_ M.B.A., Ph.D., FIC.. .
'
- .
..
y •" .. � .
Address for correspondence:
Rx Publications
'"•
� ..
••
I w
•
,,
•
•
. '
•
.
.. "
• •
-
•••
•
•
'
•
•
267 A/3, West Car Street, Tirunelveli - 627 006, India
Phone: 0462-2334856 e-mail: rxpublications@gmail.com
•
I'
© All rights reserved
• •
•
' - ..... ...
. ' '
. . �
. -
' ' '
No part of this book may be reproduced or transmitted in any form or by any means,
electronic or mechanical, including photocopying, recording or by any information
storage and retrieval system, without written permission from the author or publisher.
Edition
Price
Published by
: 1997, 1999, 2001, 2010
: Rs.200/-
: Rx Publications, Tirunelveli, India
For list of Book sellers, refer to Last Page
•
.•
•
•
l
- . • •
•
•
•
..
•
...,...,·'
. .
·.'
i !
:.
'•
;
:· {;�
..- .
r
... .·
t .' I
. t.'
'. ):' .. J- '' .•
'....,'
� • "'tBI ':;: order No. (O. 1. 2. 3, etc)·
9 = angle of deflection I diffraction
We can understand the working of gratlng with the following examp�.:.,
I
Let d =
2000
& 0 = 6.89'.
i.e. d = 5 x Io-4
i
= 5 x 10
-4 x sin 6.89>
m
5 x 104 x 0.12 600
cm.
m
= nmm
Fot this 0, pifferei:it wavelength of light can be obtatned. depending
up.on order No.
Order No 1 2· 3 4 •••
..
·).. nm obtained 600
=600nm
600
=300nm
600
=200nm
600
= 150nm
1 2 3 4
•••
'
Thus a light radiation at any angle (0) or any order can be collected
and· used .m the instrument by either moving the grating and frxing the
slit or moving the slit and keeping the grating constant.
C. Sampl,e cells
Sample cells or cuvettes are used to hold a sample solution. Their
geometcy as well as material varies with the instrument and nature of
sample handled. The material of sample cell should not absorb at the
wavelength being obseived. Cells are available which change with the
following parameters.
Sample v.ol,ume
Shape of cell -
Path length -
(internal distance)
Small· volume cells {0.5ml or less) and large volume
cells (5-1Oml).
Cylindrical '1Jke test tube) or rectangular (Fig I. IO).
lcm (normally), upto 10cm (long pathlength)
1mm or 2mm (short path length) cells are available
1-20
<
• •• •
. ...... .....• •• •
; "'-,;• •
OQ=�' ....
CC)��'0=lk

Colour corrected ,fus.ed
9lass for visible region.
Polystyrene cells: are
available for use wtth
aqueous solvents but
cannot be used with
organJc solvents. For W
�
� .
•cm
... �
,. Jcm....
region. these cells must F'1g 1•10•'l)pcaofaanp-a-Ue·�Cf)! v.
: dJ. - be made up of quartz since. glass. absorbs· W
radiation.
0 "'
-
.
Detectors used in lN/Visible spectrophotometers can be called as
photometric detectors. When a radiation is passed through a sample cell,,.
part of it is being absorbed by the sample solution and the rest is being
transmitted. This transmitted radiation falls on the detector and the intensity
of absorbed radiation can be dete1·1nined or displayed. In these detecl0r.s.
the light energy is converted to electrical signal which can be read or
recorded. The most commonly used detectors are
.
1. Barrier Layer cell or Photo Voltaic cell
2. Photo tubes or photo emissive ·cells and
3. Photo Multiplier tubes
1. Barrier Layer cell or Photo Voltaic cell
These cells are the cheapest and are used in inexpensive tnstruments
like filter type colortmeters. fluorimeters and nepheloturbldtmeters. -To�
following Fig 1.11, shows the construction and working of the detectoft'.·
Tfie detector has a thin metallic layer coated with silver or gold and ac�
as an electrode. It
-
also has a metal base c.1a,,
plate which acts as
another electrode.
These two layers are SeJawm
separated by a
semiconductor layer
of selenium. Selenium
has extremely low
electrical conductivity
and hence the
1-21
1blo la.ju olSllft:r
e
"- 1.11. l'lllllto.,.ltnlc e:?D
•
'
I
'
f
f
•"
.
(
•
. = • �.. ,. ___.._ --1i 1a•.·•• material
�, S: To 8nd Ole(put:•iitqe, pua·••1· ..u.1 ,••
Wei . a quantity of powder. transfer ta a. conic81 fl�sk, add indtq_ator
and�ther ,salutlons as per requirements and titrate against a titrant.
,.:Plnf) out the tttte value.
Tth value x St. of tltrant x Eq. wt factor
1
Percentage· purity of gtven substance = Wl of substance taken
x oo
4. To ibid out tbe a,aouat of drug pJesent In each tablet
Tbe: fQUow.ing steps are followed:
W�t �ccur�iely 20 tablets.
Ftnd the average weight of one tablet
(Total weight. of tablets divided by 20).
Fihely powder all the 20 tablets.
Weigh a quantlty of powder as specified in monograph.
Perform the titration and find out the titre value:.
The amount of drug in each tablet 'is calculated as foUows:
. .. . . f d in ch ta.bl t-Tit value x St. of tltrant x Eq. wtfactor x Av. wt of tablet
Amount O rug · ea e - wt. of tablet powder taken
5. To tlnd the % purity of tablets
Follow the steps as given in Formula 4 (as above).
% purity of tablets = Tit value x st. of tltrant x Eq.wt. factor x Av. wt. of tablet x 100
Wt. of tablet powder taken x label claim in grams
'.
J
i
I I
"
I '
I'
•
26. BLAME PHOTOMETRY
Principle
Components of a Flame Photometer
Burner (with fuel and oxidant)
Filter / Monochromator
Detector
Readout Device
Schematic diagram of
Flame Photometer
Flame Spectrophotometer
Double beam Flame Spectrophotometer
Applications
Qualitative analysis
Quantitative analysis
Methods: Direct Comparison Method
Calibration Curve Method
Standard Addition Method
Internal Standard Method
Interferences and Methods to overcome
Preparation of Standard Stock solutions
26-·1
•
•
. .
PHOTOGRAPH OF HPTLC • •
'·'
•
•
. '
'
., .
' ' . .,
•
..
..
Computer controlled Densitometer/Scanner
-.
. ---
•
t •' • •
I
l
i -
. '• 1
•'
-1·
... -.•. '
. Samp�e applicator (Linomat 5 )
•
.,.,
,J',(Jj . .
F' .... �->
-�··
� '... . .. '*'••y: .
··� .•. '
•
-·
. "" ..
t .
....,,.
•
Photographs : Courtesy:ANACHROM (CAMAG)
' . .
29-7
. . (-
- .
•
•
' .
�- ·APPLICATIONS
1> i..
. ... . '.. • ••• •
. ,,
l
.
i
•
f
The applications of HPT
.
LC is very vast, since whatever be· the comp��nd.s
-which can be analysed by TLC, be analysed using HPTLC technique. Moreov:er,
as the technique is much sensitive and small sample volume is -�ufficient for
detection and estimation, various applications are possible in several fields.
•
The following are some of the categories of applications.
•·
Pharmaceutical Applications:
+ Quantitative analysis of drug substances in fox1nulations and biological
fluids
+ Assay of active components and multicomponent analysis .
+ Content uniformity in dosage fonnulations
+ Presence of impurities in drugs
+ Stability testing and forced degradation studies
+ Preservatives - eg. Butylated Hydroxy Anisole, Butylated Hydroxy
Toluene, parabens in fo11nulations
+ Phytoconstituents in plant extracts: Examples are presented in
Indian Herbal Pharmacopoeia and US Herbal Pharmacopoeia,
where estimation of phytoconstituents in various herbal
products are made. Eg. St.John's Wort, Piperine in Piper Nigrum,
I.
Caffiene in Tea/Coffee, Nicotine in Tobacco, etc.,
� Adulteration of plant extracts
•
+ Quality control / authentication / finger printing /screening of plant
extracts (eg) Garlic extract (Alliin, allicin), valerian, ashwagandha,.
';i : - "' •
ginkgo, ginseng, etc.
� Phytochemical analysis of volatile oils : eg. Eugenol in Clove oil '
-'.
Clinical applications
and metabolism to detect drugs and
� Used in pharmacoldnetics
metabolites, screening for drugs of abuse� .
29-8
,.,., ... ·
i
·- . - �·
N .• o ' .., 1, ,- � • ,• • .. ' i
. �·· it ., ..,, '·'·: 1 -J.·,,' ;-·�it;:� ·Ji ....i .� •• JNTRODUCTIO ·
.. . ' >il
Counter current extraction is a method of multiple liquid-liquid extraction
technique ,vhere separation of components having variable solubility in two
immiscible liquid phases is achieved.
•
In a conventional liquid-liquid extraction, 2 components (eg. ''a" and "b")
are distributed between 2 immiscible liquids, according to their partition co­
efficients. Still pure "a" and pure "b" are not present in these 2 liquids, even
after reaching equilibrium.
In the counter current extraction, 2 immiscible solvents flow in an
opposite direction, in multiple stages, equilibrium is established and after
several stages, pure "a" and "b" can be obtained. •
PRINCIPLE
In counter current extraction, when 2 components "a" and "b", having
varying affinity or partition co-efficient, is distributed between 2 immiscible
solvents (eg. X and Y) which are allowed to flow in opposite direction,
separation of pure "a" and "b" takes place, in multiple stages, as described
in the figure 1, in the next page.
In the first stage, when equilibrium is achieved, in container l, solvent X
(lighter or upper phase) and solvent Y (heavier or lower phase) will have both
components "'a" and "b". Of course, based on their distribution coefficient,
let us say, "a" is present more in X and "b'' is present more in Y. The upper
phase (solvent X) is transferred to next container 2, with similar composition
of solvents. Fresh solvent X is added to container 1.
�ter achievement of equilibrium in container 2, now the upper phase will
conta1� less of "b", due to its low solubility in X and more of "a". This upper
phase 1s then transferred to container 3 with similar composition of solvents.
Now, the upper layer of container 1 is then transferred to container 2 and fresh
solvent is added to container 1. The above steps are repeated till the upper
layer contains pure "a" · th " th"m e n container, where "n" is the last container
31-2
.(.
I"
,·
;.
I
I•
I
I'
r
I
,.
••
The lower phase (solvent Y) of container 1.contains the pure component of "b".• •
... .
.# "
'·
Fig 1. Diagramatic representation of counter current extraction
StepO
'-
.S?
Step 1
�
Step 2
�
Step ·n·
•
1
b
b
�-- .
.wa .•·
1 = (b+a)0
b2
ba
b +a= (b+a)1
ba
ba2
b2
+ 2ab + a2
= (b+a)2
ba2
Pure·b'--+-- b4
ba3
equlllbratlon
After
equilibration
Before
equilibration
After
equilibration
Before
equilibration
After
equilibration
Before
equillbration
After
equilibration
The value of "n" depends upon various factors described later in this
chapter. Also, the number of steps required to separate "a" and "b", depends
upon the difference in their distribution coefficient. When the difference
between them is more, few steps are required. But when the difference in
31-3
l
'
";
" ,, d "b" is less then more steps are
the distribution coefficient between a an ,
' . .
required.
••.. '4
•• •
. l • .
Instrumentation
A simple type of apparatus on laboratory scale is a Craig appara:'1s
· · ii tin" g upper layer and transfer11ng
(Fig 2). This tube has provision or separa
b h. h aVl·er solvent only is placed. Fresh solvent 1s added to
to next tu e, w ere e
tube 1.
Start of Cycle
Fig 2. Craig Apparatus
31-4
t,r
l
ltf!·
l
t
•
/-
'
'
'•
••
•
.
j • '
, .- .
Models are available·.. to contain about 20-25 tubes, which can be
connected in sequence and used for demo purpose (as given below).
On industrial scale, the design of extractors is different and depends
upon no. of factors described below:
Factors affecting extraction
• Solvent selection
• Operating Conditions
• Mode of Operation
• Extractor Type and
• Design Criteria
Solvent selection, depends upon the type of solute mixtures. Other
factors affecting solvent selection are boiling point, density, interfacial tension,
viscosity, corrosiveness, flammability, toxicity, stability, compatibility with
product, availability and cost.
Applications
• Separation of components from synthetic mixtures.
• Separation of components from plant extracts.
• Purification of compounds (removal of impurities).
•
31-5
ravi shankar pharmaceutical analysis

ravi shankar pharmaceutical analysis

  • 2.
    I. • • .. ar Text book of • by •• •• • . . - • ·SIS Dr.S.Ravi Sankar, M.Pharm.,t_ M.B.A., Ph.D., FIC.. . ' - . .. y •" .. � . Address for correspondence: Rx Publications '"• � .. •• I w • ,, • • . ' • . .. " • • - ••• • • ' • • 267 A/3, West Car Street, Tirunelveli - 627 006, India Phone: 0462-2334856 e-mail: rxpublications@gmail.com • I'
  • 3.
    © All rightsreserved • • • ' - ..... ... . ' ' . . � . - ' ' ' No part of this book may be reproduced or transmitted in any form or by any means, electronic or mechanical, including photocopying, recording or by any information storage and retrieval system, without written permission from the author or publisher. Edition Price Published by : 1997, 1999, 2001, 2010 : Rs.200/- : Rx Publications, Tirunelveli, India For list of Book sellers, refer to Last Page • .• • • l - . • • • • • ..
  • 14.
    • ...,...,·' . . ·.' i ! :. '• ; :·{;� ..- . r ... .· t .' I . t.' '. ):' .. J- '' .• '....,' � • "'tBI ':;: order No. (O. 1. 2. 3, etc)· 9 = angle of deflection I diffraction We can understand the working of gratlng with the following examp�.:., I Let d = 2000 & 0 = 6.89'. i.e. d = 5 x Io-4 i = 5 x 10 -4 x sin 6.89> m 5 x 104 x 0.12 600 cm. m = nmm Fot this 0, pifferei:it wavelength of light can be obtatned. depending up.on order No. Order No 1 2· 3 4 ••• .. ·).. nm obtained 600 =600nm 600 =300nm 600 =200nm 600 = 150nm 1 2 3 4 ••• ' Thus a light radiation at any angle (0) or any order can be collected and· used .m the instrument by either moving the grating and frxing the slit or moving the slit and keeping the grating constant. C. Sampl,e cells Sample cells or cuvettes are used to hold a sample solution. Their geometcy as well as material varies with the instrument and nature of sample handled. The material of sample cell should not absorb at the wavelength being obseived. Cells are available which change with the following parameters. Sample v.ol,ume Shape of cell - Path length - (internal distance) Small· volume cells {0.5ml or less) and large volume cells (5-1Oml). Cylindrical '1Jke test tube) or rectangular (Fig I. IO). lcm (normally), upto 10cm (long pathlength) 1mm or 2mm (short path length) cells are available 1-20 < • •• • . ...... .....• •• • ; "'-,;• • OQ=�' .... CC)��'0=lk Colour corrected ,fus.ed 9lass for visible region. Polystyrene cells: are available for use wtth aqueous solvents but cannot be used with organJc solvents. For W � � . •cm ... � ,. Jcm.... region. these cells must F'1g 1•10•'l)pcaofaanp-a-Ue·�Cf)! v. : dJ. - be made up of quartz since. glass. absorbs· W radiation. 0 "' - . Detectors used in lN/Visible spectrophotometers can be called as photometric detectors. When a radiation is passed through a sample cell,,. part of it is being absorbed by the sample solution and the rest is being transmitted. This transmitted radiation falls on the detector and the intensity of absorbed radiation can be dete1·1nined or displayed. In these detecl0r.s. the light energy is converted to electrical signal which can be read or recorded. The most commonly used detectors are . 1. Barrier Layer cell or Photo Voltaic cell 2. Photo tubes or photo emissive ·cells and 3. Photo Multiplier tubes 1. Barrier Layer cell or Photo Voltaic cell These cells are the cheapest and are used in inexpensive tnstruments like filter type colortmeters. fluorimeters and nepheloturbldtmeters. -To� following Fig 1.11, shows the construction and working of the detectoft'.· Tfie detector has a thin metallic layer coated with silver or gold and ac� as an electrode. It - also has a metal base c.1a,, plate which acts as another electrode. These two layers are SeJawm separated by a semiconductor layer of selenium. Selenium has extremely low electrical conductivity and hence the 1-21 1blo la.ju olSllft:r e "- 1.11. l'lllllto.,.ltnlc e:?D •
  • 152.
    ' I ' f f •" . ( • . = •�.. ,. ___.._ --1i 1a•.·•• material �, S: To 8nd Ole(put:•iitqe, pua·••1· ..u.1 ,•• Wei . a quantity of powder. transfer ta a. conic81 fl�sk, add indtq_ator and�ther ,salutlons as per requirements and titrate against a titrant. ,.:Plnf) out the tttte value. Tth value x St. of tltrant x Eq. wt factor 1 Percentage· purity of gtven substance = Wl of substance taken x oo 4. To ibid out tbe a,aouat of drug pJesent In each tablet Tbe: fQUow.ing steps are followed: W�t �ccur�iely 20 tablets. Ftnd the average weight of one tablet (Total weight. of tablets divided by 20). Fihely powder all the 20 tablets. Weigh a quantlty of powder as specified in monograph. Perform the titration and find out the titre value:. The amount of drug in each tablet 'is calculated as foUows: . .. . . f d in ch ta.bl t-Tit value x St. of tltrant x Eq. wtfactor x Av. wt of tablet Amount O rug · ea e - wt. of tablet powder taken 5. To tlnd the % purity of tablets Follow the steps as given in Formula 4 (as above). % purity of tablets = Tit value x st. of tltrant x Eq.wt. factor x Av. wt. of tablet x 100 Wt. of tablet powder taken x label claim in grams '. J i I I " I ' I' • 26. BLAME PHOTOMETRY Principle Components of a Flame Photometer Burner (with fuel and oxidant) Filter / Monochromator Detector Readout Device Schematic diagram of Flame Photometer Flame Spectrophotometer Double beam Flame Spectrophotometer Applications Qualitative analysis Quantitative analysis Methods: Direct Comparison Method Calibration Curve Method Standard Addition Method Internal Standard Method Interferences and Methods to overcome Preparation of Standard Stock solutions 26-·1 • • . .
  • 170.
    PHOTOGRAPH OF HPTLC• • '·' • • . ' ' ., . ' ' . ., • .. .. Computer controlled Densitometer/Scanner -. . --- • t •' • • I l i - . '• 1 •' -1· ... -.•. ' . Samp�e applicator (Linomat 5 ) • .,., ,J',(Jj . . F' .... �-> -�·· � '... . .. '*'••y: . ··� .•. ' • -· . "" .. t . ....,,. • Photographs : Courtesy:ANACHROM (CAMAG) ' . . 29-7 . . (- - . • • ' . �- ·APPLICATIONS 1> i.. . ... . '.. • ••• • . ,, l . i • f The applications of HPT . LC is very vast, since whatever be· the comp��nd.s -which can be analysed by TLC, be analysed using HPTLC technique. Moreov:er, as the technique is much sensitive and small sample volume is -�ufficient for detection and estimation, various applications are possible in several fields. • The following are some of the categories of applications. •· Pharmaceutical Applications: + Quantitative analysis of drug substances in fox1nulations and biological fluids + Assay of active components and multicomponent analysis . + Content uniformity in dosage fonnulations + Presence of impurities in drugs + Stability testing and forced degradation studies + Preservatives - eg. Butylated Hydroxy Anisole, Butylated Hydroxy Toluene, parabens in fo11nulations + Phytoconstituents in plant extracts: Examples are presented in Indian Herbal Pharmacopoeia and US Herbal Pharmacopoeia, where estimation of phytoconstituents in various herbal products are made. Eg. St.John's Wort, Piperine in Piper Nigrum, I. Caffiene in Tea/Coffee, Nicotine in Tobacco, etc., � Adulteration of plant extracts • + Quality control / authentication / finger printing /screening of plant extracts (eg) Garlic extract (Alliin, allicin), valerian, ashwagandha,. ';i : - "' • ginkgo, ginseng, etc. � Phytochemical analysis of volatile oils : eg. Eugenol in Clove oil ' -'. Clinical applications and metabolism to detect drugs and � Used in pharmacoldnetics metabolites, screening for drugs of abuse� . 29-8
  • 177.
    ,.,., ... · i ·-. - �· N .• o ' .., 1, ,- � • ,• • .. ' i . �·· it ., ..,, '·'·: 1 -J.·,,' ;-·�it;:� ·Ji ....i .� •• JNTRODUCTIO · .. . ' >il Counter current extraction is a method of multiple liquid-liquid extraction technique ,vhere separation of components having variable solubility in two immiscible liquid phases is achieved. • In a conventional liquid-liquid extraction, 2 components (eg. ''a" and "b") are distributed between 2 immiscible liquids, according to their partition co­ efficients. Still pure "a" and pure "b" are not present in these 2 liquids, even after reaching equilibrium. In the counter current extraction, 2 immiscible solvents flow in an opposite direction, in multiple stages, equilibrium is established and after several stages, pure "a" and "b" can be obtained. • PRINCIPLE In counter current extraction, when 2 components "a" and "b", having varying affinity or partition co-efficient, is distributed between 2 immiscible solvents (eg. X and Y) which are allowed to flow in opposite direction, separation of pure "a" and "b" takes place, in multiple stages, as described in the figure 1, in the next page. In the first stage, when equilibrium is achieved, in container l, solvent X (lighter or upper phase) and solvent Y (heavier or lower phase) will have both components "'a" and "b". Of course, based on their distribution coefficient, let us say, "a" is present more in X and "b'' is present more in Y. The upper phase (solvent X) is transferred to next container 2, with similar composition of solvents. Fresh solvent X is added to container 1. �ter achievement of equilibrium in container 2, now the upper phase will conta1� less of "b", due to its low solubility in X and more of "a". This upper phase 1s then transferred to container 3 with similar composition of solvents. Now, the upper layer of container 1 is then transferred to container 2 and fresh solvent is added to container 1. The above steps are repeated till the upper layer contains pure "a" · th " th"m e n container, where "n" is the last container 31-2 .(. I" ,· ;. I I• I I' r I ,. •• The lower phase (solvent Y) of container 1.contains the pure component of "b".• • ... . .# " '· Fig 1. Diagramatic representation of counter current extraction StepO '- .S? Step 1 � Step 2 � Step ·n· • 1 b b �-- . .wa .•· 1 = (b+a)0 b2 ba b +a= (b+a)1 ba ba2 b2 + 2ab + a2 = (b+a)2 ba2 Pure·b'--+-- b4 ba3 equlllbratlon After equilibration Before equilibration After equilibration Before equilibration After equilibration Before equillbration After equilibration The value of "n" depends upon various factors described later in this chapter. Also, the number of steps required to separate "a" and "b", depends upon the difference in their distribution coefficient. When the difference between them is more, few steps are required. But when the difference in 31-3 l '
  • 178.
    "; " ,, d"b" is less then more steps are the distribution coefficient between a an , ' . . required. ••.. '4 •• • . l • . Instrumentation A simple type of apparatus on laboratory scale is a Craig appara:'1s · · ii tin" g upper layer and transfer11ng (Fig 2). This tube has provision or separa b h. h aVl·er solvent only is placed. Fresh solvent 1s added to to next tu e, w ere e tube 1. Start of Cycle Fig 2. Craig Apparatus 31-4 t,r l ltf!· l t • /- ' ' '• •• • . j • ' , .- . Models are available·.. to contain about 20-25 tubes, which can be connected in sequence and used for demo purpose (as given below). On industrial scale, the design of extractors is different and depends upon no. of factors described below: Factors affecting extraction • Solvent selection • Operating Conditions • Mode of Operation • Extractor Type and • Design Criteria Solvent selection, depends upon the type of solute mixtures. Other factors affecting solvent selection are boiling point, density, interfacial tension, viscosity, corrosiveness, flammability, toxicity, stability, compatibility with product, availability and cost. Applications • Separation of components from synthetic mixtures. • Separation of components from plant extracts. • Purification of compounds (removal of impurities). • 31-5