Probability Distribution is a mathematical function
1.
STATISTICS FOR DATASCIENCE
Author: Swathi Voddi
Assistant Professor
BCA
Module 2: Variable and Distributions
Unit 1: Probability Distribution
2.
The explain tostudents how probability distribution develops a deep detailing
of the fundamental principles governing random events and their associated
probabilities.
Aim
3.
• Demonstrate theprincipal concept of different variables
and probability
• Explain Probability Distribution and its type
• Describe the procedure to calculate the probability
• Discuss major distributions of random variables
This unit intends to:
Instructional
Objectives
4.
• Define theprincipal concepts about probability
• Explain the concept of a random variable and the probability
distributions
• Calculate accurately the expected value and the moments
Upon completion of this unit, you will be able to:
Learning
Outcomes
5.
Unit 2.1
Basic Statistics
•2.1.1 Random Variables
• 2.1.2 Probability Distribution of a Random Variable
List of Topics
6.
2.1.1 Random Variables
•A random variable is a numerical representation of how a statistical experiment turned out. Discrete
random variables can only take on a finite number of values or an infinite series of values, but
continuous random variables can take on any value within a range on the real number line. For illustration,
a random variable indicating the volume of cars sold at a specific.
Random Variable
Type of Random Variables
Discrete Random Variable
Continuous Random Variable
7.
2.1.1 Random Variable
DiscreteRandom Variable
:
• An explanation of how probabilities are dispersed across a random variable's values is provided by its
probability distribution. The probability distribution for a discrete random variable, x, is defined by a
probability mass function, represented by f. (x). For each value of the random variable, this function provides
the probability.
• Two requirements must be met in order to create the probability function for a discrete random variable: (1)
f(x) must be nonnegative for each value of the random variable, and (2) the probabilities for each value of
the random variable must add to one.
8.
2.1.1 Random Variable
ContinuousRandom Variable
:
A continuous random variable may take on any value within a real number line interval or within a set of
intervals. It is not useful to discuss the likelihood that a random variable will take on a particular value
because every interval has an unlimited number of possible values; instead, the likelihood that a
continuous random variable will fall inside a particular interval is taken into account.
9.
2.1.1 Random Variable
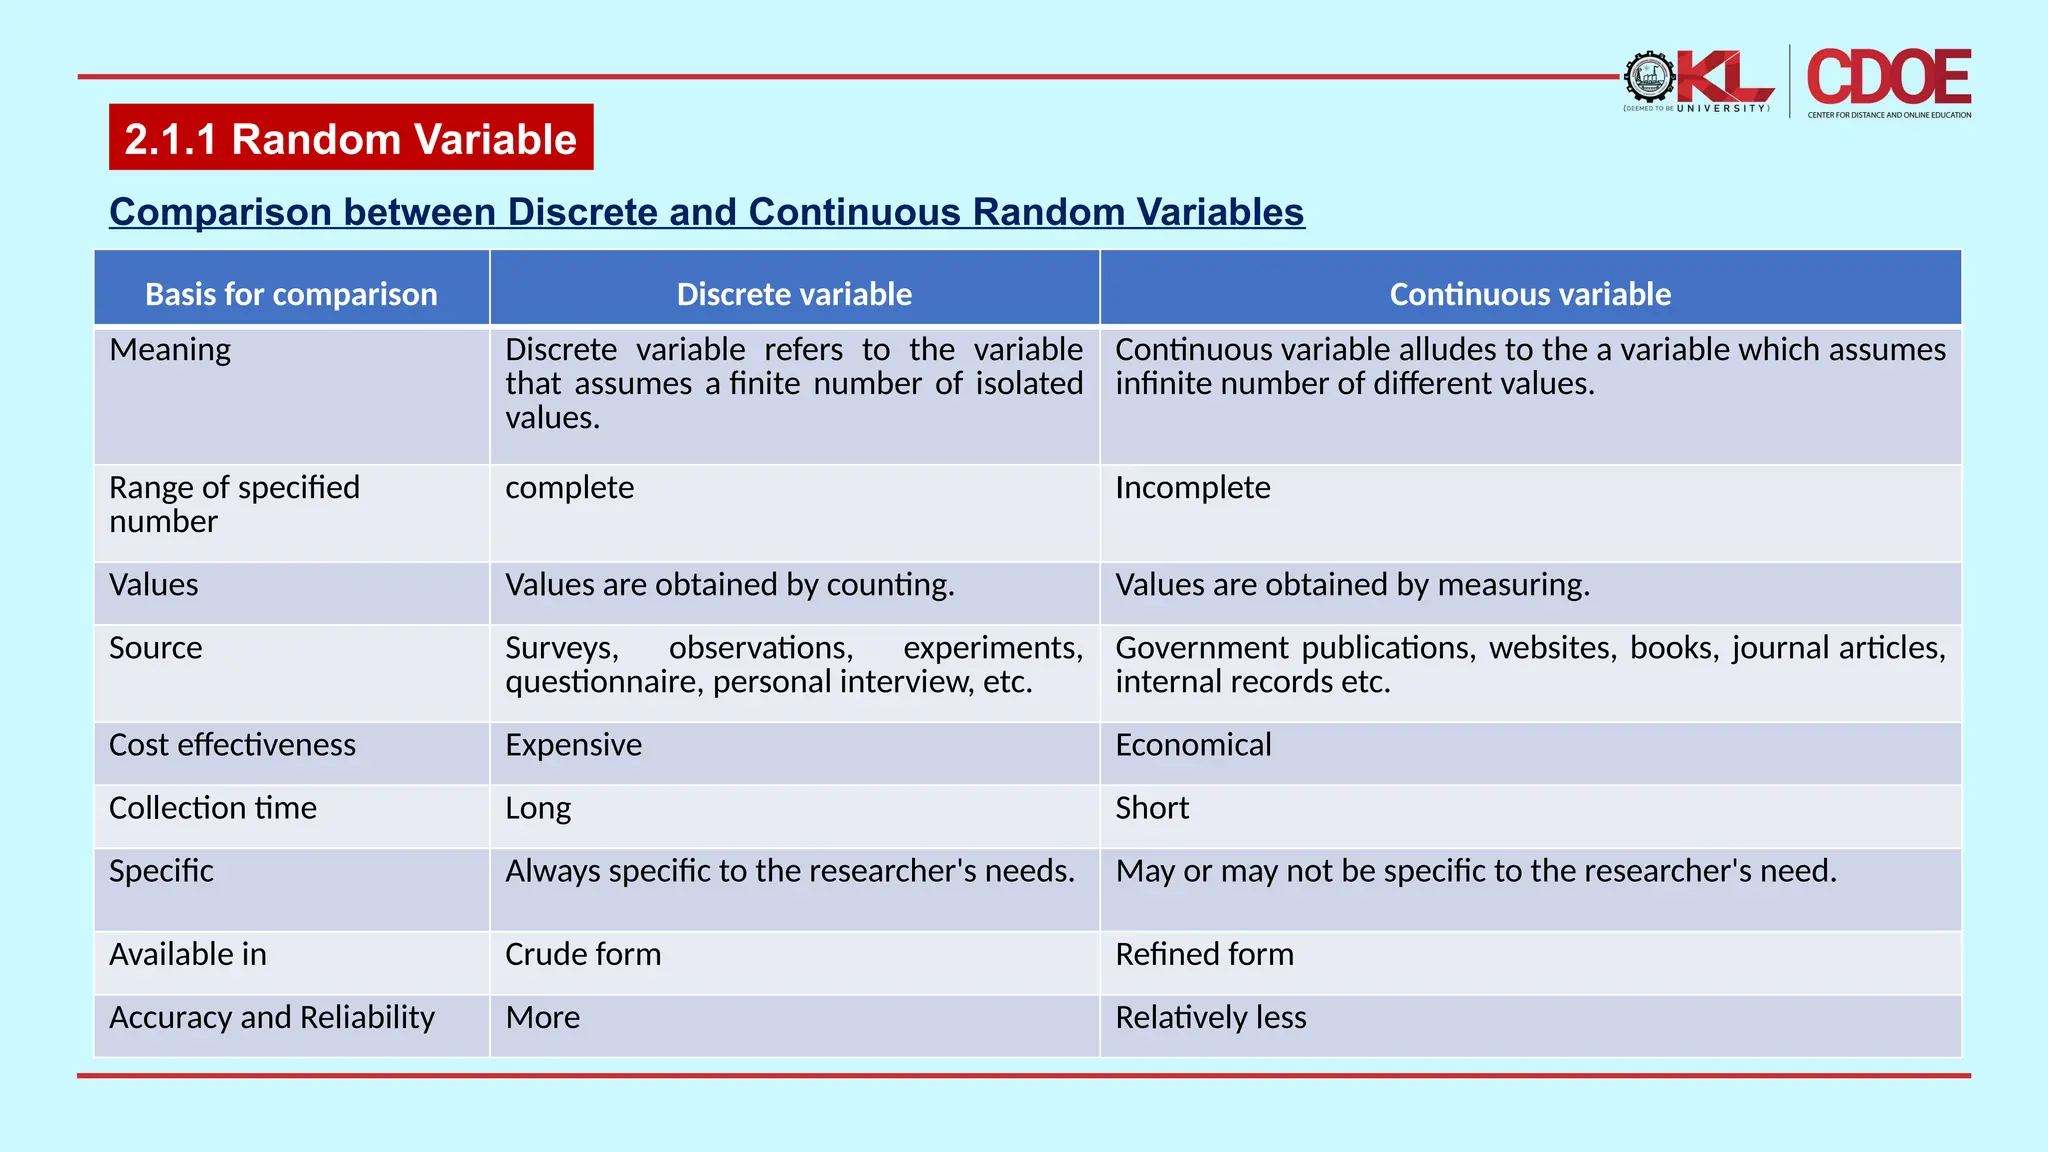
Basisfor comparison Discrete variable Continuous variable
Meaning Discrete variable refers to the variable
that assumes a finite number of isolated
values.
Continuous variable alludes to the a variable which assumes
infinite number of different values.
Range of specified
number
complete Incomplete
Values Values are obtained by counting. Values are obtained by measuring.
Source Surveys, observations, experiments,
questionnaire, personal interview, etc.
Government publications, websites, books, journal articles,
internal records etc.
Cost effectiveness Expensive Economical
Collection time Long Short
Specific Always specific to the researcher's needs. May or may not be specific to the researcher's need.
Available in Crude form Refined form
Accuracy and Reliability More Relatively less
Comparison between Discrete and Continuous Random Variables
10.
Quiz
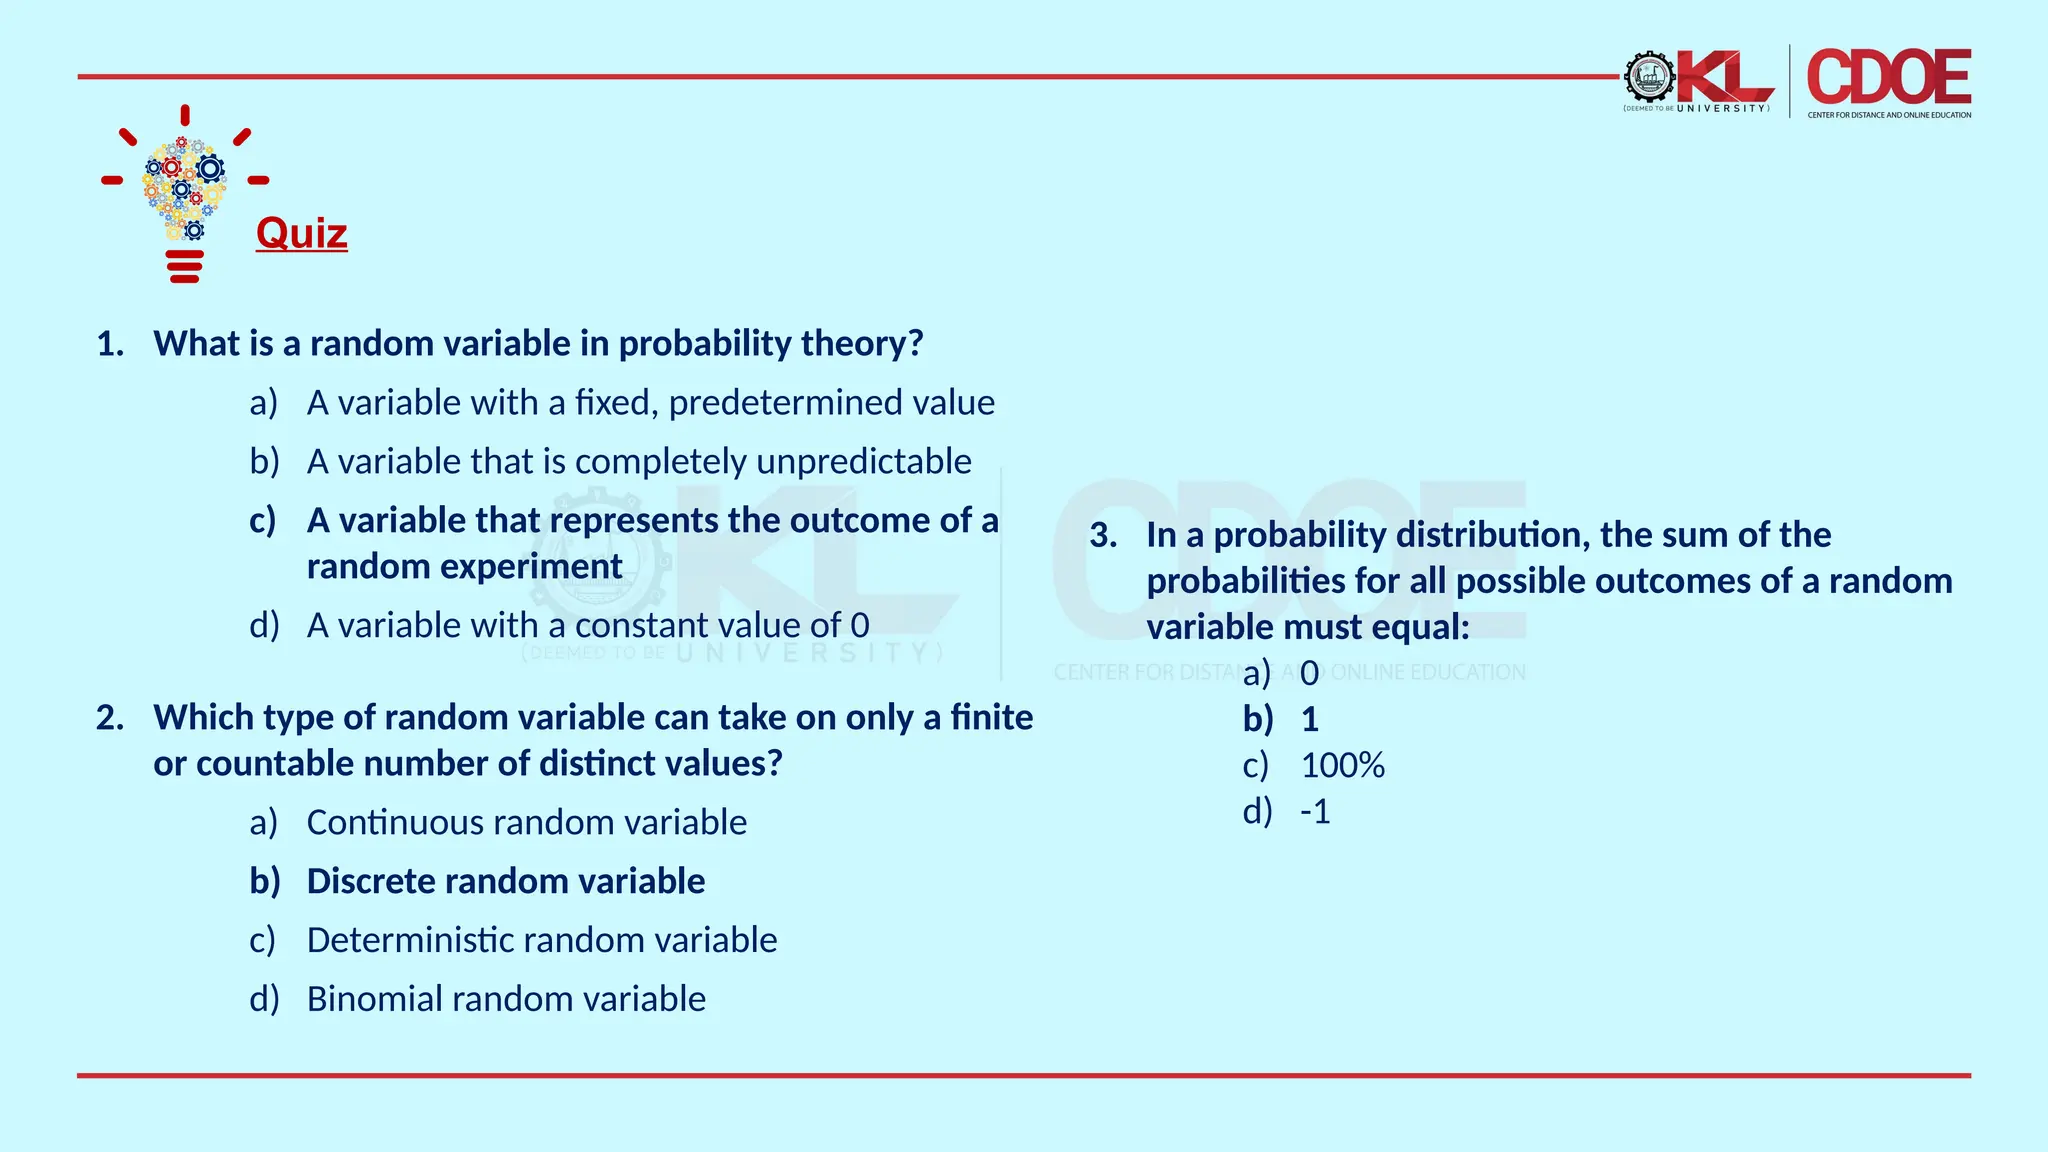
1. What isa random variable in probability theory?
a) A variable with a fixed, predetermined value
b) A variable that is completely unpredictable
c) A variable that represents the outcome of a
random experiment
d) A variable with a constant value of 0
2. Which type of random variable can take on only a finite
or countable number of distinct values?
a) Continuous random variable
b) Discrete random variable
c) Deterministic random variable
d) Binomial random variable
3. In a probability distribution, the sum of the
probabilities for all possible outcomes of a random
variable must equal:
a) 0
b) 1
c) 100%
d) -1
11.
2.1.2 Probability Distributionof a Random Variable
Probability
• Probability refers to the likelihood that something will occur. It is
a mathematical notion that estimates the likelihood that
occurrences will take place. Between 0 and 1, the probability values
are expressed. The degree of likelihood that something will happen
is the definition of probability. Probability distributions are likewise
subject to this fundamental theory of probability.
12.
2.1.2 Probability Distributionof a Random Variable
Probability Distribution
•
A probability distribution is a statistical function that
enumerates all the potential probabilities and values
for a random variable within a certain range. The
lowest and maximum values that may be used to limit
this range will exist, but many variables would affect
where those values would appear on the probability
distribution. These include the distribution's
skewness, kurtosis, skewness, mean, and standard
deviation.
13.
2.1.2 Probability Distributionof a Random Variable
• Probability distribution yields the possible outcomes for any random event. It is also defined based on the
underlying sample space as a set of possible outcomes of any random experiment. These settings could be a set
of real numbers or a set of vectors or a set of any entities. It is a part of probability and statistics.
• Random experiments are defined as the result of an experiment, whose outcome cannot be predicted.
Suppose, if we toss a coin, we cannot predict, what outcome it will appear either it will come as Head or as Tail.
• The possible result of a random experiment is called an outcome. And the set of outcomes is called a sample
point. With the help of these experiments or events, we can always create a probability pattern table in terms of
variables and probabilities.
14.
Quiz
4. In abinomial distribution, which of the following
parameters defines the probability of success on an
individual trial?
a) Number of trials
b) Probability of success
c) Probability of failure
d) Mean
5. The exponential distribution is often used to model the
time between events in a Poisson process. What shape
does the probability density function (PDF) of the
exponential distribution have?
a) Bell-shaped
b) Uniform
c) Exponential decay
d) Symmetrical
6. What type of probability distribution has a
constant probability of success across all trials
and is used for modeling situations with only two
possible outcomes, like flipping a coin?
a) Geometric distribution
b) Poisson distribution
c) Exponential distribution
d) Uniform distribution
15.
Points to Ponder
Whatis a random variable, and how do we differentiate between discrete
and continuous random variables?
What is the expected value of a random variable, and how does it relate to
long-term average outcomes?
How does the expected value (mean) of a random variable relate to the central
tendency of the distribution, and what insights can it provide?
Discuss the differences between probability distributions for discrete random
variables (e.g., binomial, Poisson) and continuous random variables (e.g., normal,
exponential).
16.
• A probabilitydistribution is a fundamental concept in probability theory and statistics that
describes the likelihood of different outcomes of a random experiment or random variable. It
provides a framework for quantifying uncertainty and making probabilistic predictions. There are
two main types of probability distributions: discrete and continuous.
• Probability distribution is a core concept in statistics and probability theory that quantifies the
likelihood of different outcomes in a random experiment or with a random variable.
• Discrete probability distributions are associated with random variables that have distinct,
countable values. Each value has an assigned probability.
Summary
17.
Activity
Calculate and discussdescriptive statistics such as mean,
variance, and standard deviation for the simulated dataset.
18.
The study ofrandom variables and their associated probability distributions is a
fundamental and powerful concept in the field of statistics and probability theory.
These concepts play a crucial role in understanding and modeling uncertain
situations in various real-world applications.
Conclusion